Ching-Fa Yeh, Chun-Lin Chen, and Guan-Hong Lin
D e p a r t m e n t of Electronics Engineering and Institute of Electronics,National Chiao Tung University, Hsinchu, Taiwan, China
A B S T R A C T
In microelectronics, silicon dioxide (SiO2) is widely used as an insulator including the gate dielectric, isolation, and passivation layers. Conventional methods of preparing SiO2 films, such as thermal oxidation or CVD techniques, are subject to several problems, such as thermal stress, do- p a n t redistribution, a n d material interaction. To solve these problems, we suggest replacing conventional tech- niques with a room-temperature method that grows a n SiO2 film with similar quality.
Liquid phase deposition (LPD) is a room-temperature method for SiO2 formation. To date, LPD-oxide films have been obtained by adding either H3BO31-5 or A16 to hy- drofluosilicic acid (HzSiF~) solution saturated with silica. In this approach, however, owing to the n u m b e r of addi- tional parameters, the deposition reaction in LPD is com- plicated. Moreover, this method does not consider the con- t a m i n a t i o n from the chemicals, b u t rather merely assumes that such c o n t a m i n a t i o n is minimal, the LPD method with H20 addition was first attempted by Yoshitomi et al. ~ Ac- cording to Ref. 5, the chemical reaction for SiO2 growth in the treatment solution can be represented by the following equilibrium reaction
Silicon oxide formation was studied by a novel liquid phase deposition (LPD) method with H20 addition only at 35~ The deposition rate could be controlled by varying the q u a n t i t y of H20 added. The LPD-oxide was lightly oxygen-deficient. FTIR spectra a n d AES depth profiles indicate that a small a m o u n t of fluorine was incorporated into the oxide. The composition of LPD-oxide can be represented as SiO2-x F=. The physicochemical properties of LPD oxide were investigated, as was the behavior of fluorine in the oxide and the chemical reaction. A model for the LPD mechanism is proposed that satisfactorily explains all of the experimental phenomena observed.
H2SiF6 + 2H20 +-~ 6HF + SiO2 AH < 0 [1] In fact, however, this equation represents only the chemical reaction i n the solution a n d does not explain the growth of LPD-oxide on the substrate at all. In addition. Yoshitomi
I
H2SiF6
4mol/l I
ISi02 satu. H2SiF6J
et al. concentrated mainly on investigating the electrical properties of the as-deposited a n d the annealed LPD-ox- ide, such as current vs. voltage a n d capacitance-voltage. Basic phenomena such as the effects on the deposition pro- cess of adding different quantities of H20 a n d the physico- chemical properties of LPD-oxide were not clarified. Fur- thermore, the behavior of fluorine incorporated in the LPD oxide a n d the mechanism of the method are still u n k n o w n . In this study, we investigate these issues.
Experimental
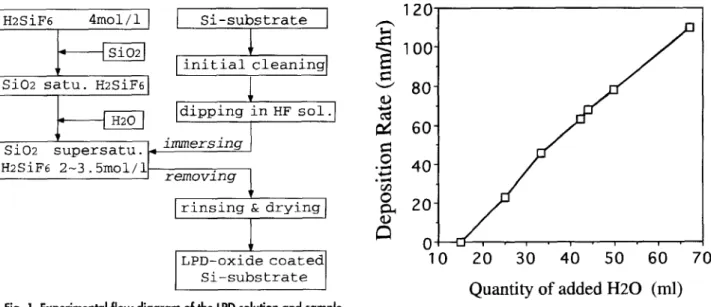
Figure 1 shows the experimental flow diagram for the LPD process, including the preparation of the chemical solution a n d samples. First, 35 g of silica (SiO2) powder (99.999%) were added to 1 liter of hydrofiuosilicic acid (H2SiF6, 4 mol/1). The solution became saturated with sili- cic acid [St(OH)4] after being stirred at 23~ for 17 h. Before the substrates were immersed, the solution was filtered to remove the undissolved silica, a n d deionized water (H20) was added to the saturated solution as it was stirred. The H20 enabled the solution to become supersaturated with silicic acid. The titration rate of H20 was about 1 ml/min, a n d the q u a n t i t y of H20 added was 15 - 67 ml per 100 ml of the immersing solution.
The substrates used in this experiment were n-type (100) silicon wafers. After initial cleaning, the native oxides formed on the substrates in the HC1 + H202 mixed solution
I Si-substrate
]l
initial
cleaning]
Idlpp•
in HF sol r
Si02 supersatu. ~
immersing
~2SiF6 2-3.5moi/i
removlng [
v
I
rinsing &
J
LPD-oxide coated
Si-substrate
drying I
20
30
40
50
60
70
Fig. 1. Experimental flow diagram of the LPD solution and sample
preparation.
J. Electrochem. Soc., Vol. 141,
120
qO0-
80-
I~ 60-
:~ 4o-
~
20-
0
0
The Physicochemical Properties and Growth
Mechanism of Oxide (SiO2_xFx) by Liquid Phase
Deposition with H20 Addition Only
Quantity of added H20 (ml)
Fig. 2. Dependence of deposition rate on added H20 volume.
3178
J. Electrochem. Soc.,
Vol. 141, No. 11, November 1994 9 The Electrochemical Society, Inc.9 c.)
Thermal Oxide
Si-OH H_IO_H LPD-Oxide I \
H - O - H S i - O - S i . . . . , . . . . i . . . . v 4000 3000 2000 1 000 S i - O - S i
Wavenumber (cm -1 )
Fig. 3. Typical FTIR spectra of thermal oxide thickness: 1100 A and LPD oxide t~ickness: 1020 A.
during cleaning were removed by dipping in HF solution. The cleaned substrates were then placed into the immers- ing solution at 35~ until a ~ 110 nm thick L P D - o x i d e film formed gradually on the substrate surface. The substrates were then removed from the solution, rinsed w i t h deionized water, and spin-dried.
The thickness and refractive index of the L P D - o x i d e were determined by ellipsometer. The film structure and chemical resistance were evaluated by using Fourier trans- form infrared spectroscopy (FTIR) and the P-etch rate test, 7 respectively. The depth profile of composition was investi- gated by using Auger electron spectroscopy (AES). To ver- ify the correctness of the proposed LPD mechanism, the
10O 80 60 r 40 20
\
0 I i i i S~ F , , , ~ ~ 2 3 4 5Sputter Time (1in)
Fig. 4. AES depth profile of LPD oxide. 1.44 1.43 r
~ 1.4z
~ 1.41 1.40 1.39 28 26 O9 24 o~ 22 2O9
1 8 16 200 400 600 800 1000 D e p o s i t i o n Rate (/~dhr)Fig. 5. Changes in refractive index and P-etch rate for I.PD oxide films prepared with different deposition rates.
1.0 0.9 0.8 "~ 0.7 O.G 0.5 0 . 4 A : a s - d e p o s i t e d B: 400 ~ C: 600 ~ D: 800 ~ E: thermal oxide
4o0 3oo 1 6o 11oo 9oo 8oo
W a v e n u m b e r (cm "1 )
Fig. 6. Typical changes in FTIR spectra in the region of 700 1400 cm -1 for 1020 A thick LPD-oxide films annealed at various temperatures for 1 h. 09 "o 0J ;> 09 1.46 1,45 r, ~_..__1 1 . 4 4 / 1 . 4 3
142asJdepo.
260 460 6;0 8;0Annealing Temperature (oc)
20 ~-,
i
~
o 9 1 ooo
Fig. 7. Dependence of refractive index and P-etch rate on anneal- ing temperature. The LPD-oxide films were annealed in N2 ambient for lb.
changes in the chemical composition of the i m m e r s i n g so- lution w e r e investigated using the F T I R method.
Results and Discussion
PhysicochemicaI properties.--LPD-oxide
was success-fully formed in the solution w i t h HzO addition only. More- over, the quantity of H20 added had a significant effect on the L P D - o x i d e deposition rate (D.R.). As shown in Fig. 2, the plot of the oxide D.R. as a function of the q u a n t i t y of H20 added indicates that the D.R. can be controlled in the range of 0 - 110 n m / h by adding 15 - 67 ml of H20 per 100 ml of the immersing solution. This D.R. range is similar to that of the L P D m e t h o d with H ~ B O ~ addition. 4 T h e figure clearly shows that the D.R. can be enhanced by increasing the a m o u n t of H 2 0 added, and in fact the D.R. can be con- trolled by adding m o r e or less H20. In the Discussion w e explain this p h e n o m e n o n after w e propose a m e c h a n i s m for the L P D process.
Figure 3 shows a typical F T I R spectrum of 1020 A thick LPD-oxide. It is nearly the s a m e as that of L P D film de- posited with the addition of H3BO3. 8 The absorption bands around 1090 c m -I and 810 c m -I are due to the St-O-St vi- bration. These absorption bands, which are similar to those found in the spectra of thermal oxide, indicate that L P D oxide is a m o r p h o u s in structure. Another m a i n absorption b a n d around 930 c m -~ found in the L P D spectra m a y be due to Si-F. 8 The reason fluorine is incorporated into the oxide is explained w h e n w e discuss our model of the L P D m e c h a n i s m later. The concentration and the distribution of fluorine incorporated in the oxide were investigated by A E S measurement. As s h o w n in Fig. 4, the A E S depth pro-
J. Electrochem. Soc.,
Vol. 141, No. 11, November 1994 9 The Electrochemical Society, Inc. F F F F F F F(n)
F F I1.[ F ~ J i " ~ ~ "F" "" ~ ' ! L / J ~ F F F(E)
Z- + HF Z -[
F
.
. F . . s , j
F F F F Z- H ..x~ F P") - F\ / ' 1
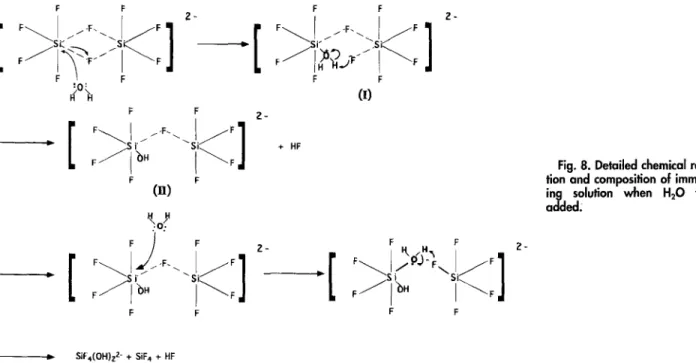
F ID ~S i S J - - / F F ?- 3179Fig. 8. Detailed chemical reac- tion and composition of immers- ing solution when H20 was added.
9 SIF4(OH)z z- + SiFa + HF
file of a n L P D - o x i d e film reveals that the a t o m i c concen- tration ratio of Si: O: F is 32.88: 65.20: 1.92. T h e fluorine is u n i f o r m l y distributed in the L P D - o x i d e . T h e s e results i m - ply that the L P D - o x i d e is a lightly oxygen-deficient film. O n this basis, the c o m p o s i t i o n of L P D - o x i d e can be repre- sented as SiO2_=F=.
O n the other hand, a f e w absorption b a n d s related to w a t e r are also f o u n d in the L P D spectrum. O - H stretching d u e to H 2 0 is exhibited in the absorption b a n d s a r o u n d 3300 e m -I a n d ]640 c m -~, while O - H stretching d u e to S t - O H is exhibited in the b a n d a r o u n d 3 6 0 0 c m -~. T h e s e b a n d s reveal that the L P D film m a y contain a small a m o u n t of water. H o w e v e r , the intensity of these p e a k s is faint, indicating that the a m o u n t of w a t e r contained in the film is small.
F o r the L P D - o x i d e film p r e p a r e d b y this m e t h o d , the refractive i n d e x is a b o u t 1.40 - 1.435. A s w a s reported, ~ the refractive i n d e x of L P D - o x i d e film is l o w e r t h a n the value of 1.462 for t h e r m a l silicon dioxide. ~~ In general, the l o w e r refractive i n d e x is d u e to the fluorine contained in the oxide. TM In fact, the A E S m e a s u r e m e n t s h o w s that the
L P D - o x i d e film indeed contains fluorine. This conclusion is consistent w i t h the properties of the P-etch rate. T h e P-etch rate of L P D - o x i d e in this study w a s a b o u t 18 27 A/s, w h i c h is greater t h a n that of t h e r m a l oxide (2 8 A/s).7 Moreover, our e x p e r i m e n t s also indicated that b o t h the refractive index a n d the P-etch rate are highly d e p e n d - ent o n oxide D.R. A s s h o w n in Fig. 5, the refractive i n d e x decreases as the D.R. increases, while the P-etch rate in- creases w i t h the D.R. This result indicates that to control the film quality deposition conditions w i t h a relatively l o w D.R. should be used. A l t h o u g h b o t h the refractive i n d e x a n d the P-etch rate are d e p e n d e n t o n the D.R., the electri- cal properties of the L P D - o x i d e d o not vary w i t h the D.R. Since the A E S results reveal that L P D - o x i d e contains fluorine, it is essential to investigate the b e h a v i o r of fluo- rine in the a n n e a l e d L P D - o x i d e . Figure 6 s h o w s the typical c h a n g e s in F T I R spectra in the region of 700 ~ 1400 c m -~ for the a n n e a l e d 1020 .~ thick L P D - o x i d e films u n d e r dif- ferent annealing t e m p e r a t u r e s in N2 ambient. T h e s p e c t r u m of t h e r m a l oxide w i t h a thickness of i010 A is also s h o w n (curve E) for comparison. T h e Si-F b a n d a r o u n d 930 c m -~ gradually decreases with annealing temperature. This phe- n o m e n o n indicates that reduction in the Si-F b o n d s oc- curred during annealing at temperatures a b o v e 400~ A t temperatures a b o v e 800~ the s p e c t r u m of the L P D film (curve D) is nearly indistinguishable f r o m that of t h e r m a l oxide (curve E), a n d the Si-F b o n d s s e e m to h a v e c o m - pletely disappeared. After N 2 annealing, the absorption
band near 1090 cm 1 due to St-O-St v i b r a t i o n of LPD shifted toward lower wave numbers, and the w i d t h of the bands became broader. In addition, after N2 annealing the water-related absorption bands, such as 3300 cm -~ (OH) and 3600 cm -I (St-OH), also disappeared at temperatures above 250~ This implies that the composition and struc- ture of LPD oxide became similar to that of thermal oxide after 800~ annealing. It also implies that the wave n u m b e r of St-O-St bonds in as-deposited L P D - o x i d e is slightly higher than t h a t in thermal oxide because of the high elec- tronegativity of fluorine incorporated in LPD oxide.
The effect of annealing temperature on refractive index was also investigated. As shown in Fig. 7, after N2 anneal- ing the refractive index decreases slightly as the t e m p e r a - ture increases until 600~ This decrease can be ascribed to
the release of water out of the LPD-oxide. 7 O n the other
hand, after annealing at higher t e m p e r a t u r e (>600~ the refractive i n d e x increases dramatically. T h e increased re- fractive i n d e x is nearly the s a m e as that of t h e r m a l oxide (1.46). T h e l o w e r index f o u n d in L P D oxide m a y be d u e to the fluorine in the film. W h e n the film is a n n e a l e d at higher t e m p e r a t u r e (>600~ the Si-F b o n d s c a n be b r o k e n a n d m a y be c h a n g e d into St-O-St bonds. This is the reason the refractive index increases after annealing at higher t e m - perature. T h e d e p e n d e n c e of the P-etch rate o n annealing t e m p e r a t u r e is also s h o w n in Fig. 7, w h i c h indicates that the P-etch rate of L P D - o x i d e decreases dramatically w i t h higher temperature. F o r the L P D film a n n e a l e d at 800~ b o t h the refractive index (-].457) a n d the P-etch rate (-2.5 A/s) are nearly the s a m e as those for t h e r m a l oxide. This m e a n s that f e w large c h a n g e s such as c h a n g e s in b o n d - ing a n d the d i s a p p e a r a n c e of fluorine f r o m the L P D - o x i d e occur w h e n the annealing t e m p e r a t u r e is as high as 800~
L P D m e c h a n i s m . - - To investigate the LPD mechanism, it is indispensable to clarify the chemical composition of the immersing solution and the details of the chemical reac- tion. In this section, we explain the composition and the chemical reaction and then propose a mechanism for the LPD process.
T h e i m m e r s i n g solution w a s p r e p a r e d b y dissolving silica in H 2 S i F 6 solution. In relatively concentrated H 2 S i F 6 solu- tion, silica can be dissolved to a n a m o u n t well b e y o n d its solubility I~ w i t h the formation of species such as fluosilicic c o m p l e x [SiF6 9 SiF4] ~-, 12 This has b e e n c o n f i r m e d b y anal- ysis of U V absorption s p e c t r u m in w h i c h the p e a k density w a s f o u n d to be d e p e n d e n t on the H2SiF~ concentration a n d the quantity of SiO2 in solution. ~'13 T h e formation of the fluosilicic c o m p l e x c a n be represented 14 b y
3180
J, Electrochem. Soc.,
Vol. 141, No. 11, November 1994 9 The Electrochemical Society, Inc.OH OH OH OH
o . o
Lj.
~. an
Ll.,o
! "In
OH OH HzO
J,o,
,1o,
I,o,
S~ Su~traZe Si Substrate
+ H:F
(a)
(b)
Fig. 9. Schematic illustrations
of the proposed LPD mechanism.
F-
~
{-I
o
OH ~ ---s I, o. o. - - 0 --s, .I
I Jn
0 HzO 0 H~O 0 0 ,1o, " s J o x . . . $t0 xI
SlO x ,,,1
SI Substnlte Si Substrate(c)
(d)
+ HzO5H2SiF6 + SiO2 --> 3[SiFs - SiF4] ~- + 2H20 + 6H § [2] As i l l u s t r a t e d in Fig. 8, t h e fluosilicic c o m p l e x [SiF8 9 SiFt] 2- is a b r i d g e d i n t e r m e d i a t e , u s u a l l y a n anion. B e c a u s e of h i g h e l e c t r o n e g a t i v i t y of fluorine, t h e b o n d e d Si is elec- t r o n - d e f i c i e n t . However, t h e S i - F - S i b o n d is r a t h e r w e a k , so w e p r o p o s e t h a t t h e S i - F - S i b o n d b r i n g s on an a t t a c k r Sh 4000 3000 2000 1000 Wave Number (cm -1}
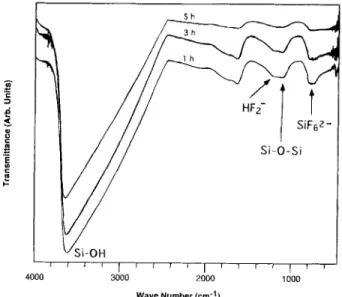
Fig. 10. Typical changes in FTIR spectra for the immersing solution
after deposition for !, 3, and 5 h.
f r o m an e x t e r n a l n u c l e o p h i l e H20, y i e l d i n g t h e p r o d u c t (I). F u r t h e r m o r e , t h e r e a c t i o n of t h e L e w i s b a s e F - w i t h t h e p r o t o n yields t h e p r o d u c t (II) a n d HF. F o r t h e s a m e reason, t h e p r o d u c t (II) c a n f u r t h e r r e a c t w i t h H20 to y i e l d SiF4(OH)~-, SiF4, a n d H E B e c a u s e the i m m e r s i n g solution is acidic, the reaction of SiF4(OH)~- a n d H § will occur as follows
SiF~(OH)~- + 2 H § -~ S i F 4 + 2 H 2 0 [3] H o w e v e r , the hydrolysis of SiF4 in a q u e o u s solution will yield SiFt-, H § a n d silicic m o n o m e r Si(OH)4, as follows
3SiF4 + 4 H 2 0 --> 2SiF~ + Si(OH)4 + 4 H + [4] Thus, f r o m the c h e m i c a l reaction a n d the c h e m i c a l c o m - position discussed above, w e hypothesize that the m e c h a n - i s m for the deposition of L P D - o x i d e can be described b y the five steps s h o w n in Fig. 9. (i) First, the intermediate polysilicic acid is f o r m e d b y the polymerization of the sili- cic m o n o m e r Si(OH)4. i~
(ii)
Since the concentration of polysilicie acid in the s y s t e m is very low, the polysilicic acid c a n n o t f o r m a spatial n e t w o r k t h r o u g h o u t the v o l u m e , but is instead a b s o r b e d onto the substrate surface (the deposi- tion p h e n o m e n o n ) , as illustrated in Fig. 9a.(iii)
Acid-cata- lytic d e h y d r a t i o n occurs b e t w e e n the a b s o r b e d polysilicic acid a n d S i - O H present o n the substrate surface, followed b y Si-O-Si b o n d formation (Fig. 9b).(iv)
B e c a u s e s o m e H F is present in the system, the surface of the as-deposited film will be subject to H F attack (Fig. 9c a n d d) according to the reactionJ. Electrochem. Soc.,
Vol. 141, No. 11, November 1994 9 The Electrochemical Society, Inc. 3181 Hence etching also occurs simultaneously w i t h deposition.(v) I n summary, deposition of L P D - o x i d e film on the sub- strate surface is the p r e d o m i n a n t result, because of the con- t i n u a l absorption of polysilicic acid as described in step (if)
(Fig. 9e and f).
Discussion
To confirm the correctness of the model proposed above, we investigated the changes in the chemical composition of the immersing solution with FTIR after performing deposi- tion for 1, 3, and 5 h. As shown in Fig. 10, FTIR spectra indicate t h a i the peaks a r o u n d 3600, 1202.5, 1090, a n d 732 cm -~ are due to the S i - O H bonds, HF2 functions, Si-O- Si bonds, and SiFt-, respectively. This chemical composi- tion is consistent with the reaction products entailed b y the model presented above. Because the polysilicic acid in so- lution was a b s o r b e d onto the s u b s t r a t e surface, the S i - O - S i p e a k intensity, which is p r o p o r t i o n a l to residual concentra- tion, obviously decreased w i t h deposition time. Although S i - F bonds were detected in the L P D - o x i d e (Fig. 3), they were not detected in the immersing solution. However, the results concerning the chemical reaction and composition support the LPD mechanism proposed above.
The proposed L P D - m e c h a n i s m also explains all the p h e - nomena observed in the experiment. First, the D.R. of the oxide can b e d e t e r m i n e d b y the q u a n t i t y of H20 a d d e d b e - cause a larger a m o u n t of H~O increases the nucleophilic a t t a c k from H20 in the solution. This increases the concen- t r a t i o n of polysilicic a c i d and thus enhances the D.R. Next, the fluorine i n c o r p o r a t i o n can be understood as a result of S i - F b o n d formation. The f o r m a t i o n of S i - F bonds can be a t t r i b u t e d to the fact t h a t the a s - d e p o s i t e d oxide is always a t t a c k e d by HE To e x p l a i n the dependence of the refractive index and P - e t c h r a t e on the D.R. of the LPD-oxide, the relationship between the D.R. and the chemical reaction r a t e has to be t a k e n into account. The increase in the D.R. is due to the increase in the chemical reaction r a t e of the system. When H~O a d d i t i o n increases the reaction rate, the concentration of H F also increases. Because the a s - d e - posited L P D - o x i d e is subjected to H F attack, the amount of S i - F bonds will also increase. Thus the higher the concen- t r a t i o n of S i - F bonds, the lower the refractive index is, a n d the higher the P - e t c h r a t e will become.
Conclusions
This research investigated the formation of oxide b y us- ing l i q u i d phase deposition in s i l i c a - s a t u r a t e d H2SiF6 solu- tion w i t h H20 a d d i t i o n only. The L P D - o x i d e D.R. v a r i e d from 0 - 110 n m / h depending on the q u a n t i t y of H20 added. A larger a m o u n t of H~O a d d i t i o n enhances the nu- cleophilic a t t a c k from H~O in the solution, which increases
the concentration of polysilicic acid and in t u r n raises the D.R. The concentration r a t i o of Si: O: F is 32.88: 65.20: 1.92. The oxide can be represented as SiO2_=Fx. Both the refrac- tive index and the P - e t c h r a t e d e p e n d heavily on the oxide D.R. The higher the concentration of S i - F bonds, the lower the refractive i n d e x is, and the higher the P-etch rate will be. However, high t e m p e r a t u r e annealing in N2 a m b i e n t results in a higher refractive i n d e x and lower P - e t c h rate. The model of the deposition mechanism proposed on the basis of chemical reaction and composition explains how H20 a d d i t i o n enhances oxide deposition and how fluorine is i n c o r p o r a t e d into the oxide.
Acknowledgments
This study was s u p p o r t e d by the National Science Coun- cil, Republic of China, u n d e r Contract N u m b e r NSC 82- 0404-E-009-374. The authors are i n d e b t e d to Y. S a k a i for performing the analysis on the Auger electron spec- troscopy.
Manuscript s u b m i t t e d Sept. 29, 1993; revised m a n u s c r i p t received July 14, 1994.
Dr. Yeh assisted in meeting the publication costs of this article.
REFERENCES
1. T. Goda, H. N a g a y a m a , A. Hishinuma, and H. K a w a - hara, Mater. Res. Symp. Proc., 105, 283 (1988).
2. H. Nagayama, H. Honda, and H. K a w a h a r a , This Jour- nal, 135, 2013 (1988).
3. T. Homma, T. Katoh, Y. Yamada, J. Shimizu, and Y.
Murao, in IEEE Symposium on VLSI Technology,
p. 3, IEEE (1990).
4. C. L. Chen, S. S. Lin, C. E Yeh, and Y. W. Hu, Interna- tional Electron Devices and Materials Symp., p. 489
(1992).
5. S. Yoshitomi, S. Tomioka, and N. Haneji, ibid., p. 22
(1992).
6. A. Hishinuma, T. Goda, and M. Kitaoka, Appl. Surface
Science, 49, 405 (1991).
7. W. A. Pliskin, J. Vac. Sci. Technol., 14, 1064 (1977).
8. C. E Yeh, C. L. Chert, S. S. Lin, and Y. W. Hu, in Interna- tional Electron Devices and Materials Symp., p. 489
(1992).
9. C. E Yeh, S. S. Lin, C. L. Chen, and Y. C. Yang, IEEE Electron Device Lett., 14, 403 (1993).
10. J. W. Fleming and D. L. Wood, Applied Optics, 22, 3102
(1983).
11. R. H. Busey, E. Schwartz, and R. E. Mesmer, Inorg. Chem., 19, 758 (1980).
12. S. Deki, 56th S p r i n g Meeting, Ypn. Electrochem. Soc.,
p. 18 (1989).
13. S. Deki, 56th S p r i n g Meeting, ibid., 751 (1988).
14. S. M. Thomser, J. Am. Chem. Soc., 74, 1690 (1952).
15. N. I. Vorob'ev, O. B. Dormeshkin, and V. V. Pechkovskii,