DOI 10.3233/SPE-2010-0447 IOS Press
Primary events in the photodissociation
of oxyhemoglobin
Atsushi Yabushitaa and Takayoshi Kobayashia,b,c,d,∗
aDepartment of Electrophysics, National Chiao-Tung University, Hsichu, Taiwan
bICORP, JST, Honcho, Kawaguchi, Saitama, Japan
cDepartment of Applied Physics and Chemistry and Institute for Laser Science, University of
Electro-Communications, Chofu, Tokyo, Japan
dInstitute of Laser Engineering, Osaka University, Suita, Osaka, Japan
Abstract. The growing number of data on heme proteins in the ultrafast time domain have revealed complicated photophysics
of the heme that are sensitive both to the structure of the protein and to the ligand species. In this work, ultrafast time-resolved pump–probe in visible spectral range was performed using an ultrashort visible laser pulse. Broad spectral width of visible laser pulse enabled us to observe the pump–probe signal with a broadband range. A broadband multi-channel detector array coupled to a multi-channel lock-in amplifier was used to obtain the pump–probe signals at all of the probe frequencies simultaneously. In the simultaneous measurement at many probe wavelengths, we could obtain ultrafast spectral change after the photo-excitation of oxy-hemoglobin only with a short measurement time, avoiding laser damage on the sample. The time constant of the primary process was determined for the first time. Ultrafast spectral change observed in the early delay time region directly shows ultrafast photo-dissociation process of oxy-hemoglobin.
Keywords: Ultrafast spectroscopy, hemoglobin, photo-dissociation
1. Introduction
Ultrafast laser experiment using ultra-short laser pulses can reveal the transient existence of interme-diate species in the chemical reactions [22]. The ultrafast spectroscopy is a complementary method to those of electron diffraction method by Miller et al. [21] and X-ray diffraction methods by the groups of Anfinrud [23] and Zewail [24]. Instantaneous vibrational amplitude detection reaching sub-fs thanks to the pulse duration of 5 fs and the high signal to noise ratio with high stability can provide much better time resolution than electron and X-ray diffraction experiments. Also the method can be used for the measurements of amorphous and liquid-phase materials, which may be difficult to be measured by X-ray or electron diffraction. In our previous paper [11], we could even detect ultrafast real-time change in frequencies of in-plane and out-of-plane bending modes associated with the structural change during the photoisomerization of bacteriorhodopsin. Femtosecond stimulated Raman spectroscopy with high time and spectral resolution was applied to observe time-dependent conformational change [17], but the method cannot obtain the information of vibrational phase as is obtained in the ultrafast pump–probe spectroscopy.
*Corresponding author: Takayoshi Kobayashi, Department of Electrophysics, National Chiao-Tung University, Hsichu 300,
Taiwan. Tel.: +81 42 443 5845; Fax: +81 42 443 5825; E-mail: kobayashi@ils.uec.ac.jp.
The growing body of data on heme proteins in the ultrafast time domain has revealed complicated photophysics of the heme that are sensitive to both the structure of the protein [3,13–15,18] and to the ligand (CO, O2and NO) [3,4,8,10,13–16]. Petrich et al. studied [20] the excited-state photophysics of
hemoglobin (Hb), myoglobin (Mb), and protoheme and the effects of the ligands CO, O2 and NO on
the excited-state photophysics. Previous studies have demonstrated that heme photophysics is similar in hemoglobin (Hb), heme proteins and heme model systems. All of these hemes exhibit two excited states designated with Hb∗I and Hb∗II[2,5–7,13,19,20]. The data show that Hb∗I is formed in less than 50 fs and then decays to form Hb∗IIin 300 fs [7]. The decay time of the Hb∗II electronic state to the ground state was about 3 ps. This electronic relaxation is so fast that intramolecular vibrational redistribution (IVR) and vibrational cooling occur on a similar (or even slightly longer) time scale. In spite of this energy difference, the electronic relaxation pathways of heme-CO and deoxy heme are thought to be similar [20]. Both the photodissociation of CO and the heme-iron movement out of plane occur very rapidly (<50 fs) to create a species that resembles deoxy Hb. Also, Hb∗I transient spectra appear on the same time scale as photolysis in both Hb*CO and Hb*NO and the intensity and frequency of Hb∗I in deoxy Hb* is the same as in photolyzed Hb*CO and Hb*NO. Although different in intensity, the similarity between the Hb∗II transient absorption bands in Hb*CO and deoxy Hb* indicates that photophysical decay in both occurs by means of similar pathways. From the femtosecond transient absorption spectra and sub-picosecond (sub-ps) time-resolved resonance Raman spectra, the phenomena were explained by Franzen and others [7] in terms of the ultrafast electronic relaxation in the heme protein. A short-lived species Hb∗I was attributed to an iron-to-porphyrin ring charge transfer (CT) state. The CT character of Hb∗I can explain the ultrafast decay of this state, and provides a mechanism for photolysis. The proposed mechanism was claimed to explain the ultrafast intersystem crossing that has been proposed to result in photolysis [9,25].
Above mentioned multiple electronic intermediate state model, which is based on single wavelength measurements [20], was considered not to adequately explain the observed broadband spectral dynamics by later experiment by Ye et al. in their careful study of photo-dissociation process of myoglobin [26,27]. Particularly observed spectral shift on the blue side of the Soret band by Ye et al. was considered to be better explained (unless even further more electronic states are postulated) by another model invoking hot photoproduct in the ground state. They demonstrated how their new model fully describes the ultrafast optical signals that occur in ferrous heme proteins. Moreover, ultrafast non-radiative electronic decay is consistent with the absence of detectable broadband luminescence from excited electronic states in heme systems. These results are consistent with an immediate (sub 100 fs) relaxation to the electronic ground state followed by vibrational equilibration. Relaxation of the hot photoproduct spectrum was well described using independent time scales for narrowing (about 400 fs) and blue shifting (0.4–4 ps) as the system returns to an equilibrium state.
In this work, ultrafast time-resolved pump–probe signal was observed using an ultrashort visible laser pulse in its broadband visible spectral range. The simultaneous measurement at as many as 128 probe wavelengths was performed using a multi-channel detector array to obtain ultrafast spectral change after the photo-excitation of oxy-hemoglobin. The simultaneous measurement can avoid laser damage in the sample. Analyzing the observed time traces, we determined lifetime components. The fastest time constant corresponds to the ultrafast photodissociation process of oxy-hemoglobin. The time constant of the primary process was determined to be 45± 5 fs for the first time. The spectrum of the fastest decay component was determined for the photo-excited oxy-hemoglobin in the spectral range of 719 nm
(13,914 cm−1) and 523 nm (19,109 cm−1) for the first time in the visible range. Ultrafast spectral change found in the measurement result is thought to be reflecting ultrafast photo-dissociation process of oxy-hemoglobin.
2. Experimental section
Hemoglobin from bovine blood (Sigma-Aldrich) was dissolved in water with phosphate buffer sta-bilized at pH 7.7. Undissolved residue was removed by passing the solution through a filter (Millex; Millipore) put on a head of injection syringe. To prevent oxidization of the sample, sodium thiosulfate (Tokyo Chemical Industry, Ltd.) was added into the solution without further purification. The sam-ple solution had an optical density of about 1.0 at 540 nm in a 1 mm cell (6210-27501; GL Science) used for femtosecond pump–probe experiment. The solutions were carefully prepared monitoring their absorption spectra by an ultraviolet–visible–near-infrared (UV–VIS–NIR) scanning spectrophotometer (UV-3101PC; Shimadzu).
A Ti:sapphire laser system (FemtoSource (sPRO); FemtoLasers) with an 8-path bow-tie amplifier (Femtopower; FemtoLasers) was used as a light source of pump–probe experiment. The width, energy, spectral range, and repetition rate of the pulses generated from the amplifier were 20 fs, 30 µJ, 750– 870 nm and 1 kHz, respectively. The output pulse was frequency doubled by a type-I β-barium borate (BBO) crystal and compressed using a prism pair to generate a 395 nm pulse having a width of 40 fs at the 1 kHz repetition rate. The frequency-doubled pulse was used as a pump pulse in this pump–probe measurement.
After the generation of frequency-doubled pulse in the BBO crystal, part of the fundamental pulse still remains in the light path of the pump beam without being frequency doubled. One of the prisms used for the compression of the pump beam displaced the residue of the fundamental pulse, which was also compressed up to 20 fs by passing through another prism pair. The compressed fundamental pulse was focused in a sapphire plate to generate visible broadband spectrum by causing self phase modulation in the sapphire plate. The visible broadband pulse was used as a probe pulse in the pump– probe measurement.
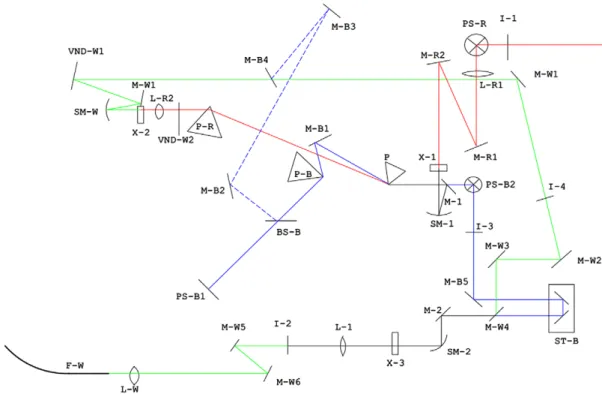
Both of the pump and probe pulses were focused by a parabolic mirror into a 1 mm thick standard fluorimeter cells (6210-27501; GL Science). Time delay of the probe pulse with respect to the pump pulses was changed by an electrically driven stepper with a 1 fs step. The pump–probe signals were detected with a 128-channel lock-in amplifier. The experimental setup is shown in Fig. 1.
Observed stationary spectrum of sample has peaks at 540, 573 and 624 nm. The locations of the peaks are in agreement with those in literature [1]. The spectrum of the laser pulse is extending from 520 to 720 nm with peak around 570 nm with a good overlap with the stationary absorption spectrum of the sample. All measurements were performed at room temperature (294± 1 K).
3. Results and discussion
The laser spectrum overlaps well with the absorption spectrum of oxy-hemoglobin solution sample. The laser spectrum is composed of a main peak at 17,500 cm−1and a weak peak around 14,500 cm−1 and a shoulder at about 16,000 cm−1. The absorption spectrum has two clearly separated peaks around 18,550 and 17,300 cm−1, which are attributed to Q(00) and Q(10), respectively.
Fig. 1. Optical setup to generate pump and probe beams, and to perform pump–probe spectroscopy. I – iris; L – lens; M – mirror; P – prism; PS – periscope to rotate polarization in 90 degree; BS – beam splitter; SM – spherical mirror; ST – step scan stage to control probe delay time; X-1 – β-BaB2O3(BBO) crystal for second harmonic generation; X-2 – sapphire plate for white light generation; X-3 – BBO crystal or sample to be measured; F – fiber to couple light into polychromator connected to lock-in detector arrays.
The probe delay time dependence of absorbance change was observed in the time range extending
from −70 to 1900 fs at 1 fs step. The sample is first excited to the S2 state (the Soret band of heme)
by the 395 nm pump pulse. The positive signal of the absorbance change observed in the visible region is considered to be the excited-state absorption from the S2 state to a higher-lying excited state. Our
previous work [12] shows how to classify dynamic vibronic couplings in vibrational real-time spectra. The probe wavelength dependency of Fourier intensity spectra could be discussed in the future work when vibrational phases of molecular vibrations are observed with good signal-to-noise ratio.
In the work by Ye et al. [26], they performed the time-resolved absorption measurement of myo-globin, both unligated and ligated with diatomic molecules. The pump wavelength was at 580 nm, and the probe spectral range was near UV and blue spectral between 400 and 500 nm. Their study on the photo-dissociation process of myoglobin demonstrated how their new model fully describes the ultrafast optical signals that occur in ferrous heme proteins. Moreover, ultrafast non-radiative electronic decay is consistent with the absence of detectable broadband luminescence from excited electronic states in heme systems. These results are consistent with an immediate (sub 100 fs) relaxation to the electronic ground state followed by vibrational equilibration. Relaxation of the hot photoproduct spectrum was well described using independent time scales for narrowing (about 400 fs) and blue shifting (0.4–4 ps) as the system returns to an equilibrium state.
We studied oxy-hemoglobin performing pump–probe measurement by ultrashort pulse to deter-mine the shortest time constant, which corresponds to the ultrafast photo-dissociation process of
oxy-(a) (b)
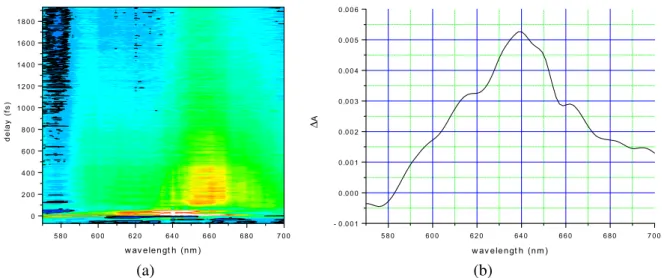
Fig. 2. (a) Two-dimensional display of time-resolved difference absorbance spectra. Black curves show contour ofΔA = 0. (b) Time-resolved difference absorbance spectrum averaged from 30 to 60 fs.
hemoglobin. Time-resolved difference absorption spectra were obtained in the delay range from−70 to 1930 fs and probe spectral region from 523 to 719 nm as shown in Fig. 2(a). Figure 2(b) shows time-resolved difference absorbance spectrum at the earliest time-delay averaged from 30 to 60 fs. Obtained time traces were fitted by double exponential function in the probe wavelength region between 600 and 700 nm whereΔA is not close to zero. The uncertainty of the fitting results was estimated by the stan-dard deviation of the obtained lifetimes. The reason why we choose the number of exponentials as two is because previous time-resolved studies of heme protein show that there are two lifetime components
(τ1 < 50 fs and τ2 ∼ 1 ps) in the time region studied in this work. Exponential fitting of the observed
time traces determined the two time constants. The fastest lifetime, τ1 = 45± 5 fs, corresponds to the
ultrafast photo-dissociation process from the photo-excited HbO2to the deoxy-Hb, which is thought to
be the vibrationally hot electronic ground state. The second shortest time constant τ2 = 676± 75 fs is
close to vibrational cooling time of about 1 ps previously determined in the case of MbO2and assigned
to the cooling of the 6c heme [26]. The third time constant of τ3, which was not accurately determined
in this experiment due to the limited time window of 1.9 ps, can most likely be assigned to the fast geminate recombination phase or a few ps vibrational cooling of photolyzed hemoglobin that has been found in the case of MbO2to have a time constant about 4 ps [26].
Broad spectral width of visible laser pulse enabled us to observe the pump–probe signal with a broad-band range. A broadbroad-band multi-channel detector array was used to obtain the pump–probe signal at all of the probe frequencies simultaneously. In the simultaneous measurement at many probe wavelengths, we could obtain ultrafast spectral change after the photo-excitation of oxy-Hb only with a short measure-ment time, avoiding laser damage on the sample. Thus, we obtained the spectral changes in the ultrafast photo-dissociation process. The difference absorption spectra in the delay region between 0 and 100 fs were averaged over 5 fs to observe the ultrafast spectral change. The observed difference absorption spectra have a positive sign, therefore they are thought to be due to induced absorption of photoexcited HbO2. The ultrafast spectral change shows oscillatory motion, which reflects wavepacket motion in the
4. Conclusion
In this work, ultrafast time-resolved pump–probe signal was observed in visible spectral range using an ultrashort visible laser pulse. Generated visible laser pulse has a broadband spectrum, which enabled us to observe the pump–probe signal in broadband. Furthermore, the pump–probe signal could be ob-tained at all of the probe frequencies at the same time using a broadband multi-channel detector arrays. The simultaneous measurement at many probe wavelengths enables us to obtain ultrafast spectral change after the photo-excitation of oxy-hemoglobin only with a short measurement time, which helps a lot to avoid laser damage on the sample. Using the broadband visible ultrashort laser pulse together with the broadband multi-channel detector array, time-resolved difference absorption spectra were observed in a broadband probe spectral region extending from 523 to 719 nm.
Exponential fitting for the observed time traces determined the primary-process time constant, of which upper limit value only was previously estimated. Ultrafast spectral change found in the delay region between 0 and 100 fs is thought to be reflecting ultrafast photo-dissociation process of oxy-hemoglobin.
References
[1] R.R. Anderson and A. Parrish, J. Invest. Dermatol. 77 (1981), 13–19. [2] J.M. Baldwin and C. Chothia, J. Mol. Biol. 129 (1979), 175–200.
[3] D.A. Chernoff, R.M. Hochstrasser and A.W. Steele, Proc. Natl. Acad. Sci. USA 77 (1980), 5606–5610. [4] P.A. Cornelius, R.M. Hochstrasser and A.W. Steele, J. Mol. Biol. 163 (1983), 119–128.
[5] S. Franzen, B. Bohn, C. Poyart, G. DePillis, S.G. Boxer and J.L. Martin, J. Biol. Chem. 270 (1995), 1718–1720. [6] S. Franzen, B. Bohn, C. Poyart and J.L. Martin, Biochem. 34 (1995), 1224–1237.
[7] S. Franzen, L. Kiger, C. Poyart and J.L. Martin, Biophys. J. 80 (2001), 2372–2385.
[8] J.M. Friedman, T.W. Scott, G.J. Fisanick, S.R. Simon, E.W. Findsen, M.R. Ondrias and V.W. Macdonald, Science 229 (1985), 187–190.
[9] B.I. Greene, R.M. Hochstrasser, R.B. Weisman and W.A. Eaton, Proc. Natl. Acad. Sci. USA 75 (1978), 5255–5259. [10] D. Houde, J.W. Petrich, O.L. Rojas, C. Poyart, A. Antonetti and J.L. Martin, in: Ultrafast Phenomena, Vol. V, G.R.
Fleming and A.E. Siegman, eds, 1986, p. 419.
[11] T. Kobayashi, T. Saito and H. Ohtani, Nature 414 (2001), 531–534.
[12] T. Kobayashi, Z. Wang and T. Otsubo, J. Phys. Chem. A 111 (2007), 12985–12994.
[13] J.L. Martin, A. Migus, C. Poyart, Y. Lecarpentier, R. Astier and A. Antonetti, Proc. Natl. Acad. Sci. USA 80 (1983), 173–177.
[14] J.L. Martin, A. Migus, C. Poyart, Y. Lecarpentier, R. Astier and A. Antonetti, EMBO J. 2 (1983), 1815–1819.
[15] J.L. Martin, A. Migus, C. Poyart, Y. Lecarpentier and A. Antonetti, in: Hemoglobin, A.G. Schnek and C. Paul, eds, 1984. [16] J.L. Martin, A. Migus, C. Poyart, Y. Lecarpentier, R. Astier and A. Antonetti, in: Ultrafast Phenomena, Vol. IV, D.H.
Auston and K.B. Eisenthal, eds, 1984, p. 447.
[17] D.W. McCamant, P. Kukura and R.A. Mathies, Appl. Spectrosc. 57 (2003), 1317–1323. [18] Y. Mizutani and T. Kitagawa, J. Phys. Chem. B 105 (2001), 10992–10999.
[19] M.F. Perutz, Ann. Rev. Biochem. 48 (1979), 327–386.
[20] J.W. Petrich, C. Poyart and J.L. Martin, Biochem. 27 (1988), 4049–4060.
[21] V.I. Prokhorenko, A.M. Nagy, S.A. Waschuk, L.S. Brown, R.R. Birge and R.J.D. Miller, Science 313 (2006), 1257–1261. [22] T.S. Rose, M.J. Rosker and A.H. Zewail, J. Chem. Phys. 88 (1988), 6672–6673.
[23] F. Schotte, J. Soman, J.S. Olson, M. Wulff and P.A. Anfinrud, J. Struct. Biol. 147 (2004), 235–246. [24] R. Srinivasan, J.S. Feenstra, S.T. Park, S. Xu and A.H. Zewail, Science 307 (2005), 558–563. [25] A. Waleh and G.H. Loew, J. Am. Chem. Soc. 104 (1982), 2346–2351.
[26] X. Ye, A. Demidov and P.M. Champion, J. Am. Chem. Soc. 124 (2002), 5914–5924.
[27] X. Ye, A. Demidov, F. Rosca, W. Wang, A. Kumar, D. Ionascu, L. Zhu, D. Barrick, D. Wharton and P.M. Champion,
Submit your manuscripts at
http://www.hindawi.com
Hindawi Publishing Corporation
http://www.hindawi.com Volume 2014
Inorganic Chemistry International Journal of
Hindawi Publishing Corporation
http://www.hindawi.com Volume 2014
Photoenergy
Hindawi Publishing Corporation
http://www.hindawi.com Volume 2014
Carbohydrate Chemistry
International Journal of
Hindawi Publishing Corporation
http://www.hindawi.com Volume 2014
Journal of
Chemistry
Hindawi Publishing Corporation
http://www.hindawi.com Volume 2014
Physical Chemistry
Hindawi Publishing Corporation http://www.hindawi.com Analytical Methods in Chemistry Journal of Volume 2014 Bioinorganic Chemistry and Applications
Hindawi Publishing Corporation
http://www.hindawi.com Volume 2014
Spectroscopy
International Journal ofHindawi Publishing Corporation
http://www.hindawi.com Volume 2014 The Scientific
World Journal
Hindawi Publishing Corporation
http://www.hindawi.com Volume 2014
Medicinal Chemistry
Hindawi Publishing Corporation
http://www.hindawi.com Volume 2014
Chromatography Research International
Hindawi Publishing Corporation
http://www.hindawi.com Volume 2014
Applied ChemistryJournal of
Hindawi Publishing Corporation
http://www.hindawi.com Volume 2014
Hindawi Publishing Corporation
http://www.hindawi.com Volume 2014 Theoretical Chemistry Journal of
Hindawi Publishing Corporation
http://www.hindawi.com Volume 2014
Journal of
Spectroscopy
Hindawi Publishing Corporation http://www.hindawi.com
Analytical Chemistry
Volume 2014
Journal of
Hindawi Publishing Corporation
http://www.hindawi.com Volume 2014
Quantum Chemistry Hindawi Publishing Corporation
http://www.hindawi.com Volume 2014 International
Hindawi Publishing Corporation
http://www.hindawi.com Volume 2014
Catalysts
Journal ofElectrochemistry
International Journal ofHindawi Publishing Corporation