國
立
交
通
大
學
光電工程研究所
碩 士 論 文
可切換直視與投影功能之行動顯示器裝置
Direct view and Projection Functions Hybrid Switchable
Mobile Display
研 究 生:賴佑禎
指導教授:謝漢萍 博士
黃乙白 博士
可切換直視與投影功能
之行動顯示器裝置
Direct view and Projection Functions Hybrid Switchable
Mobile Display
研 究 生: 賴佑禎 Student:Yu-Cheng Lai
指導教授: 謝漢萍 Advisor:Han-Ping D. Shieh
黃乙白
Yi-Pai Huang
國 立 交 通 大 學
光 電 工 程 研 究 所
碩 士 論 文
A ThesisSubmitted to Institute of Electro-Optical Engineering College of Electrical and Computer Engineering
National Chiao Tung University in partial Fulfillment of the Requirements
for the Degree of Master
in
Electro-Optical Engineering 2009
Hsinchu, Taiwan, Republic of China
i
可切換直視與投影功能之行動
顯示器裝置
碩士研究生:賴佑禎 指導教授:謝漢萍教授
黃乙白助理教授
國立交通大學電機學院
光電工程研究所
摘 要
為了讓行動顯示裝置更實用與便利,我們提出一項使用單片液晶面板且可以 切換直視與投影功能的行動顯示裝置。這項裝置由高準直的背光、高分子分散液 晶以及投影鏡頭構成,在此架構下該裝置可以切換直視與投影功能。藉由投影功 能,手機面板所呈現的影像尺寸得以被放大,同時可以提供給更多人來分享手機 的資訊,手機的實用性也因此更加提升。 實際架設硬體後,在 426 公厘的投影距離下影像可以被放大七倍。在此系統 下,影像可以直接藉由面板投影出來。同時展現切換直視與投影的功能,進而實 現手機投影的能力。ii
Direct View and Projection Functions Hybrid
Switchable Mobile Display
Student: Yu-Cheng Lai Advisor: Dr. Han-Ping D. Shieh
Dr.
Yi-Pai
Huang
Institute of Electro-Optical Engineering National Chiao Tung University
Abstract
In order to make mobile phone more useful and convenient, a device which can switch between direct view and projection modes has been presented. The device uses only single liquid crystal (LC) panel as image source and is composed of a highly collimated backlight unit, polymer dispersed liquid crystal (PDLC) component, and a projection lens structure. Thus, the device can switch between direct view and projection modes. The image size of mobile phone panel could be enlarged through the projection function. Therefore, more people are allowed to share information at the same time. This switchable function allows mobile phone to be also as a projector.
From the experimental results, the projection image size in diagonal could be magnified by 7 times at a throw distance of 426mm. The experiment verified that an image was projected from panel directly. In addition, the experimental results showed that the device could switch between the direct view and projection modes. As a result, the mobile phone could also provide projection function.
iii
誌 謝
首先誠摯的感謝指導老師謝漢萍老師及黃乙白老師對於研究與學問態度的 指引,以及對於英文和專業能力的教導。此外也感謝老師提供豐富的資源與完善 研究環境,使我得以在碩士生涯提升了專業及英文的能力,順利完成此論文。同 時,感謝口試委員許根玉、田仲豪教授及莊福明博士所提供的寶貴意見,使本論 文更加的完善。 在此特別感謝晶遠光電張宗閔學長對於研究與專業知識的指導與協助給予 非常大的指導與幫助,在忙碌的工作期間,耐心幫助我解決問題,讓我受益良多, 以得以順利進行研究。另外,也感謝在中央光電的劉焜地同學的幫助,在研究的 過程中也給於很多有用的資訊。除此之外,我要感謝一起合作的清大動機所黃歆 璇同學,給予一起的討論找尋問題的機會,讓研究可以順利進行。 在實驗室的日子裡,感謝有鄭榮安、林芳正、陳均合、莊喬舜、鄭裕國、許 精益、廖凌嶢、王國振、蔡柏全、王奕智、簡銘進,張育誠和陳致維等學長們提 供各方面的指導與協助,同時感謝拓江、宗緯、靖堯、俊賢、宜伶、浩彣、宜如、 博文、益興、高銘等同學們在課業、研究、生活上的幫助與分享,並伴我一起度 過兩年碩士班的日子。我也感謝實驗室的學弟妹們與助理小姐,感謝你/妳們的 幫忙及讓實驗室充滿歡愉的氣氛。 最後,我要感謝我的爸媽、妹妹、女友及關心我的家人和朋友們,感謝爸媽 多年來的支持,使我能無後顧之憂的研究與學習,給我一個這麼好的學習環境, 並順利完成碩士學業。在此,我將這份喜悅與每位關心我的人分享。iv
Table of Contents
Abstract (Chinese) .……….………..….…...i
Abstract (English) ………….………...………ii
Acknowledgements ……….iii
Table of Contents ... iv
Figure Captions ... vi
List of Tables ... x
Chapter 1 ... 1
1.1 Preface ... 1 1.2 Introductions of Projectors ... 2 1.2.1 DLP Type Projector ... 2 1.2.2 3LCD Type Projector ... 41.2.3 LCoS Type Projector ... 6
1.3 Introductions of Mini-projector ... 7
1.3.1 DLP Type Mini-projector ... 8
1.3.2 LCoS Type Mini-projector ... 8
1.4 Motivation and Objective ... 10
1.5 Organization ... 11
Chapter 2 ... 12
2.1 PDLC (Polymer Dispersed Liquid Crystal) Component ... 12
2.2 Microstructure Method ... 14
2.2.1 Optical Structure Components ... 15
2.2.2 Microstructure Method Switch Principle ... 15
2.3 Projection Lens Structure Method ... 17
2.3.1 Optical Structure Components ... 17
2.3.2 Projection Lens Operation Concept ... 18
v
Chapter 3 ... 20
3.1 Experimental Device Specification ... 20
3.2 Backlight Specification ... 21
3.2.1 Brightness ... 21
3.2.2 Uniformity... 21
3.3 Image Specifications ... 22
3.3.1 Magnification Ratio and Throw Distance ... 22
3.3.2 Relative Illumination ... 23
3.3.3 Image Quality... 23
3.4 Summary ... 25
Chapter 4 ... 27
4.1 Design Flowchart ... 27
4.2 Collimation Backlight Module Design ... 29
4.3 Optical Structure for Microstructure Method ... 31
4.3.1 Optical Model Setup ... 31
4.3.2 Image Quality Measurement by Simulation ... 35
4.4 Optical Structure for Projection Lens Structure ... 38
4.5 Summary ... 43
Chapter 5 ... 44
5.1 Backlight Properties ... 44
5.2 Experiment Combining Projection Lens and LC Panel ... 45
5.3 Projection Lens Imaging Ability and Switching Function ... 48
5.4 Summary ... 51
Chapter 6 ... 52
Conclusions and Future Works ... 52
6.1 Conclusions ... 52
6.2 Future works ... 53
vi
Figure Captions
Fig. 1-1 Integrating of a camera, music, and game has increased the practicability... 1
Fig. 1-2 Integrating a projector into a mobile phone allows the information to be widely displayed. ... 1
Fig. 1-3 DLP core technology---DMD by TI. ... 2
Fig. 1-4 DMD mechanism. The micromirror “a” is at bright state, and the micromirror “b” is at dark state. ... 3
Fig. 1-5 DLP projector optical system [1]. ... 3
Fig. 1-6 Color breakup issue for single-chip DLP projector. ... 4
Fig. 1-7 3LCD projector optical engine [5]. ... 5
Fig. 1-8 The “screen door” effect for 3LCD projector. ... 5
Fig. 1-9 Optical engine of LCoS projector. ... 6
Fig. 1-10 (a) Mini-projector by Optoma and DLP technology from TI[9] and (b) connect with mobile phone. ... 8
Fig. 1-11 Sketch and photo of a 3M LCoS mini-projector. ... 9
Fig. 1-12 (a) Direct view mode, and (b) projection mode. ... 11
Fig. 2-1 Orientation of liquid crystal inside the PDLC droplets in the (a) field-off and (b) field-on states. ... 13
Fig. 2-2 The concept of using a panel to project image. ... 14
vii
Fig. 2-4 Sketch of active lens structure. ... 15 Fig. 2-5 (a) Light is scattered in all directions after passing through the combination of the asymmetric lens structure with the PDLC, and (b) Sketch of direct view
condition. ... 16 Fig. 2-6 (a) When PDLC becomes a transparent film, light radiates outward and gradually diverges toward both sides after passing through the asymmetric lens
structure, and (b) sketch of projection condition. ... 16 Fig. 2-7 Configuration of the projection lens structure. ... 18 Fig. 2-8 Operation modes of switchable display device (a) direct view and (b) projection mode. ... 18 Fig. 2-9 The optical structures of the switchable device. ... 19 Fig. 3-1 The sketch of testing point position. The red points are the testing points. 21 Fig. 3-2 Sketch of the throw distance and the relative size of panel and image size. ... 22 Fig. 3-3 FOV formula and sketch. ... 23 Fig. 3-4 Single sine function in (a) object space and (b) image space. ... 24 Fig. 4-1 The direct view/projection switchable device optical design flowchart. .... 28 Fig. 4-2 Configurations of high collimation backlight module (a) perspective and (b) side view. ... 29 Fig. 4-3 Parameters of backlight structure. ... 30 Fig. 4-4 Backlight properties: (a) Angular profile of emerging light from backlight
viii
module and (b) illuminace distribution (red region: panel display area). ... 31
Fig. 4-5 The refractive angles θi(x) are different with respect to position “x”. ... 32
Fig. 4-6 (a) Sketch of the asymmetric microstructure, and (b) each microstructure is comprised of a lens and a prism. ... 32
Fig. 4-7 The sketch of the microstructure. ... 33
Fig. 4-8 The ray trace results of microstructure model. ... 34
Fig. 4-9 (a) Optical path of a microstructure, and (b) whole panel concave lens structure. ... 34
Fig. 4-10 Image quality simulation structure. ... 35
Fig. 4-11 The correlation between image quality index and pitch. The horizontal axis is the barrier pitch, and the vertical axis is the image quality index. ... 36
Fig. 4-12 Emerging light from adjacent barrier regions was overlapped each other. ... 36
Fig. 4-13 The relation between the image quality index and the diverging angle. ... 37
Fig. 4-14 Triplet lens was comprised of two convex elements and one concave element. ... 38
Fig. 4-15 Qualitative plot of optical system type [20]. ... 39
Fig. 4-16 Layout and light path of projection lens in projection mode. ... 40
Fig. 4-17 The projection lens MTF. ... 41
ix
Fig. 5-1 The configuration of the fabricated backlight module. ... 45 Fig. 5-2 (a) Angular profile of emerging light from backlight module and (b)
illuminace distribution (red region: panel display area, and green circle: coating defect). ... 45 Fig. 5-3 Projection lens with LC panel experiment setup. ... 46 Fig. 5-4 (a) Net image source pattern (the picture has been magnified 7 times), (b) projection image. ... 46 Fig. 5-5 The red rectangle indicates the bright region in the projection image. ... 47 Fig. 5-6 (a) Projection mode experiment setup, (b) direct view mode, and (c)
projection mode. ... 48 Fig. 5-7 The PDLC component in (a) off, and (b) on state. ... 49 Fig. 5-8 (a) Image source pattern, (b) direct view image, and (c) magnified
projection image. ... 49 Fig. 5-9 Relative size of image source pattern, direct view image, and projection image. ... 50 Fig. 5-10 The experimental results for different image source patterns by combining projection lens with PDLC component. ... 50 Fig. 6-1 The image brightness difference between the current mini-projector and the proposed switchable device. ... 53 Fig. 6-2 Projection lens diameter is about 50mm. ... 53 Fig. 6-3 (a) Sketch of the redesign backlight module, (b) 1” projection backlight,
x
and (c) 2” direct view backlight (the yellow color region in figs. (b) and (c) are
illuminated region). ... 56 Fig. 6-4 (a) 2” panel for direct view image, and (b) 1” panel for projection mode. . 56
List of Tables
Table. 1 The comparisons of three kinds of projectors. ... 7 Table. 2 Specifications of two kinds of mini-projectors [9][14]. ... 9 Table. 3 The specifications for direct view/projection switchable display device. ... 26 Table. 4 Radius, thickness diameter, and material parameters (unit: mm). ... 40 Table. 5 Projection lens properties ... 42
1
camera
game
music mobile phone
projector mobile phone
Chapter 1
Introduction
1.1 Preface
Mobile phone has become an important part of human life. Function including phone, camera, music player and game console can all be provided by the portable unit (Fig. 1-1). Information of different types and formats can be easily and quickly accessed and shared.
Fig. 1-1 Integrating of a camera, music, and game has increased the practicability.
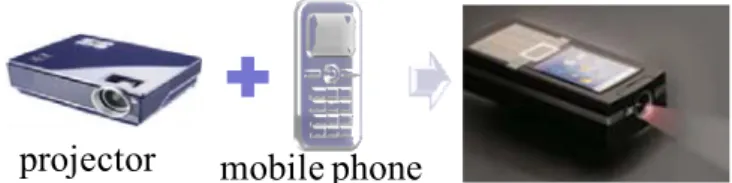
A display panel is a basic requirement to present information. However, the panel in mobile phone has limitation on size; which makes the image not comfortable to read and allows only few people to share information at the same time. To enlarge the image size without impacting mobile phone size has brought in the approach to integrate a projector into mobile phone. One of the future trends for mobile phones is to include projector into existent functions, as shown in Fig. 1-2.
Fig. 1-2 Integrating a projector into a mobile phone allows the information to be widely displayed.
2
1.2 Introductions of Projectors
The requirement on larger image size is the major focus for projector. To achieve large image size, a variety of projectors have been developed. According to optical engines, projectors can be classified into DLP, 3LCD, and LCoS systems.
1.2.1 DLP Type Projector
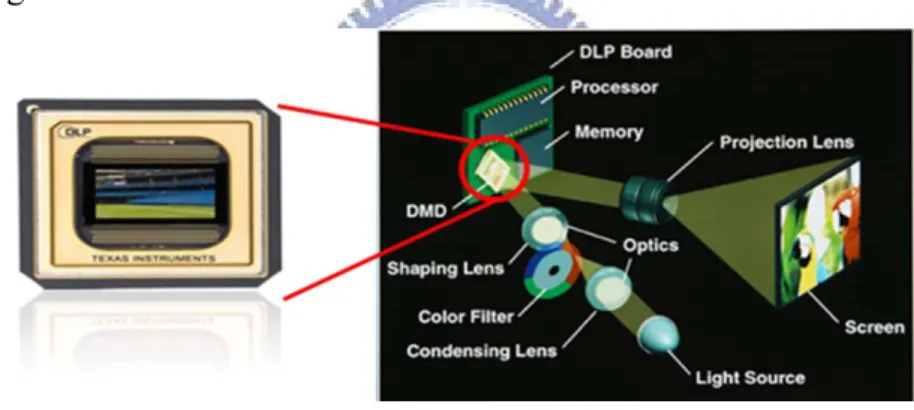
DLP (Digital Light Processing™) [1][2][3] technology was developed by TI (Texas Instruments) and is based on DMD (Digital Micromirror Device), as shown in Fig. 1-3. DMD is a switch component, which controls the intensity and placement of projected light via thousands of mirrors.
Fig. 1-3 DLP core technology---DMD by TI.
In DMD unit, micromirrors which are fixed on the DLP board can tilt either toward or away from light source, as shown in Fig. 1-4. When the micromirrors tilt toward light source (the switch is on state), light is reflected on the projection lens by the micromirrors. Then the bright pixel is yielded (as the micromirror “a”). When the micromirrors tilt the other way (the switch is off state), light is reflected on the light absorber component, and the dark pixel is yielded (as the micromirros “b”). A gray level pixel is yielded by controlling the duty of between micromirror “a” and micromirror “b” states.
3 Projection lens Lamp DMD array Light absorb
a
b
Light absorberFig. 1-4 DMD mechanism. The micromirror “a” is at bright state, and the micromirror “b” is at dark state.
DLP technology uses DMD to form image. In the DLP system, red, green, and blue colors are generated by a color wheel which spins between the lamp and the DLP board. The color wheel alternates the color of the light which is emitting into the micromirrors. Finally, the micromirrors reflect the color light on the projection lens to form an image, as shown in Fig. 1-5 [1].
DLP Board
Fig. 1-5 DLP projector optical system [1].
DLP technology has two features. First, the dynamic image does not suffer from the blur phenomenon. Due to the characteristics of the DMD and digital control technology, the micromirrors can be switched on and off quickly. Therefore, response time of micromirrors is only a few microseconds (ms) [1], which reduce image blue.
4
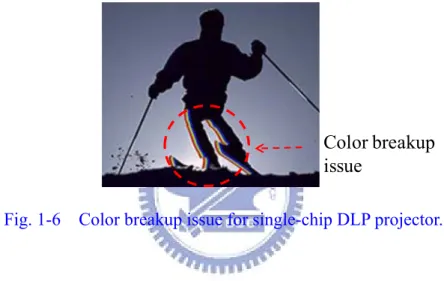
For the reason, DLP system is able to render dynamic image with high quality. Second, the optical engine is compact. Because of microseconds response time of micromirrors, only one chip is allowed to use in the optical engine. Thus, the single chip design helps DLP projector be compact. A single-chip projector system uses color wheel to yield sequential color, and the sequential color form the image. When there is a relative motion between the image and the observer eyes, the separated color on image fringes can be perceived by human eye. The phenomenon is called color breakup, as shown in Fig. 1-6.
Color breakup issue
Fig. 1-6 Color breakup issue for single-chip DLP projector.
1.2.2 3LCD Type Projector
LCD (Liquid Crystal Display) is a popular display technology. LCD is widely used in TVs, monitors, and projectors. 3LCD projector [4] uses three monochromatic LCD panels to produce the color images, as shown in Fig. 1-7 [5].
5 LCD Image Panels Screen
Combining Prism Mirrors Dichroic Mirror Dichroic Mirror Mirror Projection Lens Lamp
Fig. 1-7 3LCD projector optical engine [5].
White light source from the illumination system is separated into three colors (red, green, and blue color) by dichroic mirrors. Then each of the three colors passes through the corresponding LCD panel which is used as a light valve. The LCD panel modifies the color, and then three colors are combined by a dichroic prism to produce an image. Due to 3LCD projector does not use field sequential technology, 3LCD projector has no color breakup issue. However, a disadvantage of 3LCD projectors is the “screen door” effect. 3LCD projector is a transmissive type projector [5], light passes through the monochromatic LCD panels. The panels of 3LCD projector have to be transparent, but the circuits on the panels around each pixel form an opaque grid. Therefore, when the image is projected, the “screen door” effect is easily perceived, as shown in Fig. 1-8. Besides, lower light efficiency is another drawback due to low aperture ratio and the light absorption by LCD panel.
6
1.2.3 LCoS Type Projector
LCoS (Liquid Crystal on Silicon) [6] technology combines a semiconductor with LCD technology. In LCoS projector, reflective mirrors unit used in DLP projector is replaced by liquid crystals applied directly on the silicon.
The LCoS optical engine is shown in Fig. 1-9. White light from the illumination system is divided into three colors (red, green, and blue colors) by a color wheel. The desired colors pass through the corresponding PBS (Polarizing beam splitter) [8] which only reflects s-polarized light on LCoS panel. Then the polarized light is modulated by the LCoS panel. When LC signal is at bright state, LCoS panel modifies s-polarized light to p-polarized. Then light is reflected again by LCoS panel and emitted on projection lens. However, when LC is at dark state, light is kept as s-polarized and is not able to pass through the PBS. No incident light on projection lens resulted in dark image.
Color wheel
PBS
LCoS panel
Projection
lens
Fig. 1-9 Optical engine of LCoS projector.
LCoS projectors is reflective type, light is reflected by LCoS panel [7][8]. Also, because the transistors and driving circuits are located under the LCoS panel surface, the aperture ratio is higher than LCD panel. Therefore, compared with 3LCD projectors, higher brightness and higher light efficiency are achieved. Moreover, light does not pass through the circuits on the panel, the LCoS projector has no “screen
7
door” issue. However, the LCoS projector system also uses color wheel to produce sequential color and form the image. Thus, the LCoS projector has color breakup issue, too. Then the comparison of the three kinds of projectors between the three projector types is summarizes in Table. 1.
Table. 1 The comparisons of three kinds of projectors.
Type Color breakup issue Screen door effect Light efficiency Compact volume DLP [1][2][3] Reflective 3LCD [4][5] Transmissive LCoS [6][7][8] Reflective : Good :Poor
The projectors previously mentioned can provide large image size. However, the bulky volume of projector limits the practicality. Therefore, the lightweight mini-projectors start to get interest and attention. The development of mini-projectors is described as follows.
1.3 Introductions of Mini-projector
The bulky volume of projectors limits its practicality. A compact, lightweight, and portable projector becomes the trend. Different types of mini-projectors have been developed. Due to the optical engine of 3LCD projector uses three monochromatic LCD panels to form image, 3LCD projector is not appropriate to be used for mini-projector. However, the optical engines of either DLP or LCoS projectors can be compact by using single-chip or single-panel system, respectively.
8
Thus DLP and LCoS type mini-projectors have already been developed. These two kinds of mini-projectors are introduced below.
1.3.1 DLP Type Mini-projector
DLP type mini-projectors are shown in Fig. 1-10(a). The mini-projector combinesDLP® Pico chipset technology with R, G, and B LED light sources, and the working principle is similar to DLP projector mentioned previously. The projector can be connected with mobile phone or game console (Fig. 1-10(b)), and form an image of the dimension 6” to 60” in diagonal with a throw distance between 0.25 to 2.6m [9]. Furthermore, the projected image resolution can achieve 480x320 (HVGA), and the image brightness is about 10 lumens [9].
Fig. 1-10 (a) Mini-projector by Optoma and DLP technology from TI[9] and (b) connect with mobile phone.
1.3.2 LCoS Type Mini-projector
LCoS projector is another kind of mini-projector, and the sketch [10] is shown in Fig. 1-11. The mini-projector which uses one LCoS panel enables compact size. Red, green, and blue colors LED light sources are used, and the working principle is
9
similar to the LCoS projector described earlier [11]. The projected image can achieve a size of 6” to 50” [10] diagonally with a throw distance between 0.25 to 2.2m. Moreover, the projected image resolution is 640x480(VGA), and the image brightness is about 10 lumens [10]. The specifications of these two mini-projectors are summarized in Table. 2.
34.0 mm
43.7mm
12.5mm
Fig. 1-11 Sketch and photo of a 3M LCoS mini-projector.
Table. 2 Specifications of two kinds of mini-projectors [9][14].
Company Optoma [9] 3M [14]
Type DLP LCoS
Image diagonal 6” to 60” 6” to 50”
Resolution HVGA(480x320) VGA(640x480)
Brightness(lumens) ~10 ~10
Light source R,G, B LEDs R,G, B LEDs
Dimensions(W x H x D) (unit : mm)
15x50x103 22 x 50 x 115
10
1.4 Motivation and Objective
A compact and portable mini-projector was developed to achieve mobile projector. The DLP and LCoS type mini-projectors both have an embedded projection module in the mobile platform. The embedded projection module included either DLP chips or LCoS panels, in addition to optical components such as PBS, color combiner, and reflective micromirrors. Furthermore, the projection module needed a power supply and extra circuits to function. Therefore, the entire mini-projector was as large as a portable device, such as PDA or mobile phone (Fig. 1-10(b)). Carrying a mini-projector and mobile phone at the same time was not convenient, therefore practicality was limited.
In order to resolve the problem of embedding projection module into portable display device, a structure was proposed to replace projection module and allow panel to project image directly. The structure was able to switch between direct view and projection functions, and was named direct view/projection hybrid switchable mobile display. Direct view mode here was referred to the general panel applications, an observer saw the image directly, as shown in Fig. 1-12(a) and projection mode projected the panel image on a screen, as shown in Fig. 1-12(b). Hence, the projection module and the extra circuits were unnecessary. Furthermore, according to the specifications of mini-projectors [9][14], the brightness for the proposed device in projection mode should achieve 10 lumens. In order to maintain image quality, the backlight uniformity also needed to be taken into consideration. Backlight uniformity was required to be higher than 70%, and the image quality index MTF (Modulation Transfer function) to achieve 50% (base on manufacturing tolerance) which would be described later.
11
(a) (b)
Fig. 1-12 (a) Direct view mode, and (b) projection mode.
1.5 Organization
This thesis is organized as follows. In Chapter 2, the concept and mechanism of switchable optical structure will be detailed. In Chapter 3, the considerations of specifications will be described. Besides, the MTF principle will be introduced. In Chapter 4, the optical structure designs and simulations will be presented. In Chapter 5, the experimental results and discussions will be described. Finally, the conclusions and future works will be given in Chapter6.
12
Chapter 2
Concepts of Switchable Optical Structure
In order to perform direct view and projection functions, two methods including microstructures and projection lens were proposed. The microstructure method was composed of active lens and collimated backlight. The projection lens method was comprised of a projection lens, PDLC, and collimated backlight. First, the optical component PDLC (polymer dispersed liquid crystal) which was used in both methods will be introduced. Second, the microstructure components and the switch method will be described. Then, the projection lens method and the operation concept were presented. Finally, the brief summary will be given.
2.1 PDLC (Polymer Dispersed Liquid Crystal) Component
The microstructure and projection lens structure methods could switch between direct view and projection mode. In order to achieve the switch function, the PDLC component played an important role.
PDLC was a combination of polymers and liquid crystals, which was used in displays, light shutters, and switchable windows. In a PDLC, the liquid crystal existed in the form of micron- and submicron-size droplets which were dispersed in the polymer binder [16]. The polymer formed a continuous medium, but the liquid crystal droplets were isolated from one another. In a PDLC, the scattering of light was due to the refractive index mismatched between the liquid crystal and the polymer. At zero voltage, the droplets directions were oriented randomly throughout the cell. The
13
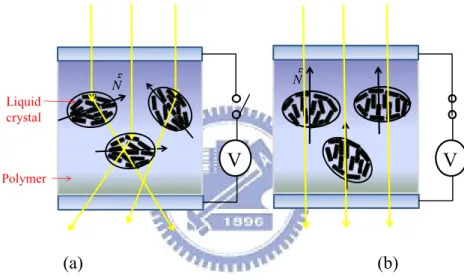
PDLC was a non-uniform optical medium and light was scattered when light propagated through the PDLC, as shown in Fig. 2-1(a). However, when a sufficient electric voltage was applied the PDLC cell, the droplets were reoriented to the same direction which paralleled to the normal of the cell. Hence, the PDLC was a uniform optical medium for the light. When light went through the PDLC, light was not scattered, as shown in Fig. 2-1(b). Therefore, base on the PDLC scattering characteristic, PDLC component was adequate to achieve the functions which could switch between the direct view and projection modes.
Nr
V
NrV
Polymer Liquid crystal (a) (b)Fig. 2-1 Orientation of liquid crystal inside the PDLC droplets in the (a) field-off and (b) field-on states.
According to the PDLC scatting characteristic, the microstructure method and projection lens method used PDLC component to switch between direct view and projection functions. These two methods were described below.
14
2.2 Microstructure Method
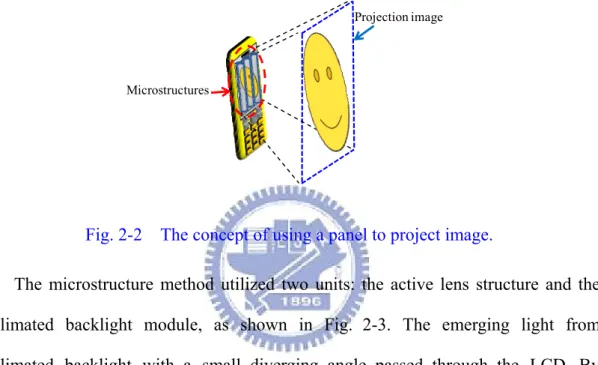
To achieve the target of doing projection whenever needed without being limited by a projection module (named as mobile projection in later discussion), the microstructure was added to the top of liquid crystal display (LCD) panel, and the panel projected image directly, as shown in Fig. 2-2.
Projection image
Microstructures
Fig. 2-2 The concept of using a panel to project image.
The microstructure method utilized two units: the active lens structure and the collimated backlight module, as shown in Fig. 2-3. The emerging light from collimated backlight with a small diverging angle passed through the LCD. By adjusting the active lens, the image was projected. The optical components of active lens and collimated backlight were described as follows.
Active Lens
LCD Collimated Backlight
15
2.2.1 Optical Structure Components
The active lens was used to switch between direct view and projection functions. Therefore, the active lens was comprised of asymmetric lens structure and PDLC, as shown in the Fig. 2-4. The asymmetric lens was used to guide light directions by the lens shape and extends the projection image regions.
Asymmetric lens structure
PDLC Active lens
Fig. 2-4 Sketch of active lens structure.
The other part of the active lens was PDLC, which is used to scatter light. When light passed through PDLC component, light was scattered by applying a sufficient voltage. The details were described in section 2.1.
Another unit was the collimated backlight module. The collimation of backlight was important. The light with small diverging angle could decrease the crosstalk phenomenon, and image quality in projection mode was improved. Therefore, the small diverging angle light was required for the microstructures method.
2.2.2 Microstructure Method Switch Principle
The microstructure method could switch between direct view and projection modes. In the direct view mode, the PDLC was applied no voltage, the PDLC became a diffusive film. Then, light was scatted in all direction after passing through the combination of the asymmetric lens structure with the PDLC, as shown in Fig. 2-5. Thus an observer could see the image directly. In the projection mode, the PDLC was
16
applied a sufficient voltage, the PDLC became transparent. Light was not scattered after passing through the PDLC. Then when light went through asymmetric lens, light radiated outward and gradually diverged toward both sides. Therefore, a broader projection area and magnified image were obtained, as shown in Fig. 2-6.
Asymmetric lens structure
PDLC ( a diffusive film) LC
(a) (b)
Fig. 2-5 (a) Light is scattered in all directions after passing through the combination of the asymmetric lens structure with the PDLC, and (b) Sketch of direct view condition. Asymmetric lens structure PDLC ( a transparent film) Collimated Backlight LC (a) (b)
Fig. 2-6 (a) When PDLC becomes a transparent film, light radiates outward and gradually diverges toward both sides after passing through the asymmetric lens structure, and (b) sketch of projection condition.
17
After introducing the microstructure method, the second method was projection lens method and also used to perform direct view and projection functions.
2.3 Projection Lens Structure Method
Instead of using a projection module to achieve mobile projection, projection lens was utilized. The method used the collimated backlight module, PDLC, and projection lens. The backlight module was also required to provide the smaller diverging angle light. The light with small diverging angle could enter to the optical system and was not blocked by optical component, such as aperture stop, so that light could be used effectively. Thus, the projection lens method required the small diverging angle light to increase light efficiency.
2.3.1 Optical Structure Components
In order to integrate the projection lens into mobile phone, a folding phone was used. A device configuration is shown in Fig. 2-7. The image source panel and collimated backlight module were on the bottom plate, and a projection lens was on the top plate. The image source panel was a conventional liquid crystal panel with a polymer dispersed liquid crystal (PDLC) diffuser[15] in between the backlight module and the LC panel. Besides, the projection lens on the top plate was stretchable and similar to camera lenses, which stretches out only when being used.
18
Stretchable
projection lens Liquid crystal image panel
PDLC
Backlight
Fig. 2-7 Configuration of the projection lens structure.
2.3.2 Projection Lens Operation Concept
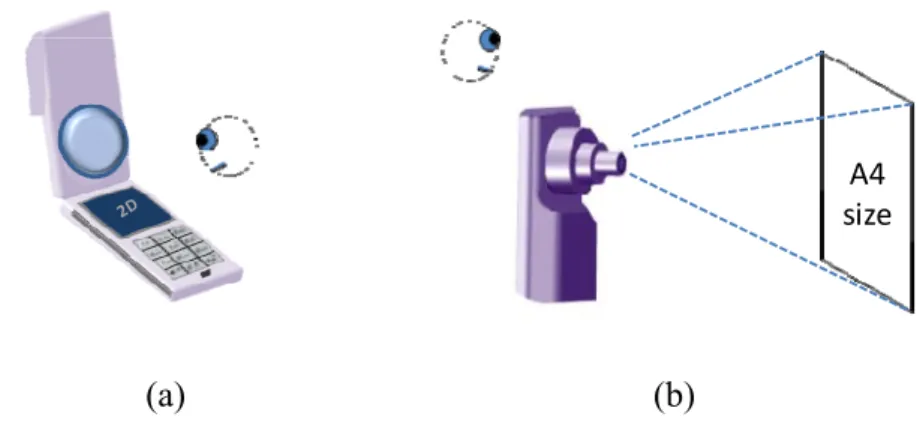
The device had two different operation modes: direct view mode and projection mode. For direct view mode, as shown in Fig. 2-8(a), the cover plate was flipped over. At the same time, the PDLC was off and became highly diffusive. Then light was scattered, and an observer could see the image directly. The projection mode required closing the cover plate and stretching the projection lens element, as shown in Fig. 2-8(b). In projection mode, the PDLC needed to be on to become a transparent film, which allowed light to go through PDLC without scattering. Then, the image could be projected after light passed through the projection lens. Therefore, an observer could perceive the projected image.
A4 size
(a) (b)
Fig. 2-8 Operation modes of switchable display device (a) direct view and (b) projection mode.
19
2.4 Summary
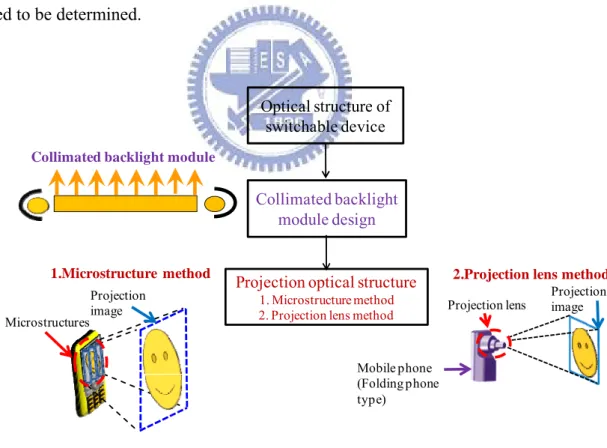
The concepts of the optical architectures and switch methods of the microstructures and projection lens method were presented. Furthermore, PDLC component played an important role in the switching segment. Therefore, the direct view/projection switchable display device was able to be achieved by combining the PDLC with the microstructure or the projection lens structure. A simple design flowchart is shown in Fig. 2-9. From Fig. 2-9, the all optical structures of the switchable device were comprised of two parts: collimated backlight module and projection optical structure. The design detail will be described in later section. In order to set up the optical structures, the specifications for the both optical structures needed to be determined.
Collimated backlight module design
Projection optical structure 1. Microstructure method 2. Projection lens method
Projection image Microstructures 1.Microstructure method Projection image Projection lens Mobile phone (Folding phone type)
2.Projection lens method
Collimated backlight module
Optical structure of switchable device
20
Chapter 3
The Considerations of Specifications
To design optical structures of the switchable device, the considerations and specifications of the device will be discussed first. The specifications were divided into three parts: experimental device, backlight and image specifications. The experimental device specification covered panel size and resolution. The backlight specifications were comprised of backlight brightness and uniformity. Finally, the image specifications included the image magnification ratio, throw ratio, relative illumination, and image quality. Furthermore, the image quality principle will also be described later.
3.1 Experimental Device Specification
To allow LCD panel of mobile phone to project image directly (Fig. 2-2), the optical structures were applied directly to the LCD panel. Therefore panel specifications must be determined. Because the panel resolution used by mobile phone was QVGA (320x240) or VGA (640x480), the QVGA display panel was chosen for this study. Besides, the panel size was 1.96 inch in diagonal length, and the aspect ratio was 4:3. Thus, the corresponding pixel size was 124.5um by 124.5um.
21
3.2 Backlight Specification
3.2.1 Brightness
The mini-projectors which were mentioned previously could display 10 lumens brightness image. In order to achieve the same brightness as that of mini-projectors, the minimum brightness for the proposed backlight module in projection mode was 10 lumens.
3.2.2 Uniformity
In projection system, a small diverging angle backlight was required to improve image quality and light efficiency. The backlight module needed to provide the small diverging angle light. Therefore, in order to achieve the small diverging angle light, the diffuser was not used. However, to avoid the projection image to be non-uniform caused by lack of diffuser, the uniformity problem should be taken into consideration, and the backlight uniformity was determined to achieve 70%. The uniformity measurement was as follows. 9 testing points distributed evenly on the panel, and each point had its own brightness, as shown in Fig. 3-1. The area inside red dotted line was the panel display area. Then, the uniformity was the ratio of min brightness to max brightness, and the formula is shown below:
22 Uniformity = max min
L
L
(1) Lmax and Lmin are the maximal and the minimum brightness of the 9 testing points, respectively.3.3 Image Specifications
3.3.1 Magnification Ratio and Throw Distance
Switchable device in projection mode could magnify the image to a size of an A4 paper with a throw distance between 400 to 500 millimeters, which was similar to mini-projectors [9][14]. The throw distance was the distance from the optical structure to the projected image. Due to the image was magnified from 1.96 inch in diagonal length to a size of A4 paper which was about 14 inch in diagonal length, the magnification ratio was about 7 times. The sketch of the throw distance and magnification is shown in Fig. 3-2.
Image size ~14 inch in diagonal Panel size ~2 inch in diagonal Throw distance 400 ~500mm
23
3.3.2 Relative Illumination
Relative illumination (RI) was defined as the illumination ratio of off-axis to on-axis. In a projection system, the illumination decayed from the image center (FOV=0。) to image edge (FOV=
2
δ 。
), and the decay ratio was
2
cos 4 δ [17], where “δ” is the field of view (FOV) of optical system. The FOV sketch is shown in Fig. 3-3. Therefore, for our projection lens FOV, relative illumination was determined to be bigger than 70% at the max field of view.
x = Distance from image to lens y = Image height FOV= 2* α x y α α = 2 * tan-1(y/x)
Fig. 3-3 FOV formula and sketch.
3.3.3 Image Quality
MTF [18] (Modulation Transfer function) was an index to determine the image quality, and the definition was described as follows. The light intensity in object space could be represented by sine function. After light passed through the optical system to the image space, the light intensity in image space was modified and formed an image. The OPT (optical transfer function) is presented as:
)]
(
exp[
)
(
)
(
v
MTF
v
iPTF
v
OPT
=
(2)Where, the symbol “v” is spatial frequency. MTF(v) was the real part of OPT(v) and represented the amplitude ratio of sine function in image space to that in object space. PTF(v) (phase transfer function) was the image part of OPT(v), and was the phase
24
difference between image and object spaces. The example (Fig. 3-4) below used sine function to describe the meaning of MTF. The contrast ratio was defined as the formula:
Fig. 3-4 Single sine function in (a) object space and (b) image space.
min max min max
)
(
)
(
)
(
)
(
)
(
v
I
v
I
v
I
v
I
v
C
+
−
=
(3) I(v)max and I(v)min are the maximal and the minimum intensities of object or image spaces for the spatial frequency v. In Fig. 3-4, the object contrast ratio is:0 0 0 0 0
)
(
)
(
)
(
)
(
)
(
a
a
a
a
a
a
a
a
a
a
v
C
obj=
−
+
+
−
−
+
=
(4)The image contrast ratio is:
0 0 0 0 0
(
)
*
]
*
)
(
[
]
*
)
(
[
]
*
)
(
[
]
*
)
(
[
)
(
a
a
v
MTF
a
v
MTF
a
a
v
MTF
a
a
v
MTF
a
a
v
MTF
a
v
C
img=
+
+
+
+
−
+
=
(5)25
Dividing equation (4) by (5), the MTF index is:
)
(
)
(
)
(
v
C
v
C
v
MTF
obj img=
(6) According to the equation (6), MTF(v) was defined as the ratio of image contrast to object contrast ratio. Therefore, the image quality of the optical system could be estimated by MTF(v) index. If the MTF was of less than 0.2 or near 0, the image could not be recognized by the optical system. The MTF was measured at a spatial frequency which was defined assize(mm)
pixel
*
2
1
lp/mm)
frequency(
Spatial
=
(7)The panel pixel size was 124.5um, the corresponding spatial frequency was 4 lp/mm(line pair per millimeter). Due to the impact of manufacturing tolerance on MTF, the MTF for manufacturing was determined to be 50% for spatial frequency of 4 lp/mm.
3.4 Summary
The specifications for the proposed direct view/projection switchable display device had been determined. All specifications were summarized in Table. 3. According to the above specifications, the optical system was designed. The optical systems and simulation will be described in later sections.
26
Table. 3 The specifications for direct view/projection switchable display device.
Item Specification Experiment device specification
Resolution 1.96” QVGA (320x240)
Pixel size 124.5um by 124.5um
Backlight specification
Brightness (lumens) 10
Uniformity (%) 70
Image specification
Image size About 14” in diagonal length
Magnification About 7 times
Throw distance (mm) 400~500
Relation illumination >70% at maximum FOV
27
Chapter 4
Optical Structure Design and Simulations
The Optical structures which allowed the panel to project image directly from LCD panel was designed to replace projection module. Using these optical structures, the embedded projection module became unnecessary. The optical design and simulation results were presented. First, the design flowchart was introduced. Second, the backlight design and the microstructure method were described. Finally, the projection lens structure was implemented.
4.1 Design Flowchart
An optical system design procedures could be divided into the following steps and the design flowchart for the proposed optical system is shown in Fig. 4-1.
(1) Optical system specifications
The optical system specifications such as panel size and resolution were decided. In addition, backlight and image specifications were also determined.
(2) Optical structure design
The optical structures were comprised of two parts: backlight module and projection optical structure. The backlight module was designed first. The backlight module design was based on the achievement of smaller diverging angle and requirement of uniformity. Then the projection optical structure was designed. The projection optical structure had two approaches: optical microstructures and projection lens structure. Also, the projection optical
28
structure was designed and the resulted image quality was estimated. If the image quality satisfied the required specifications, the optical structure would be fabricated. Otherwise, the optical structure would need to be redesigned. The design details were presented in next section,
(3) Experiment
With the fabricated module, the switch function experiments will be proceeded. Besides, the experiment which combined backlight with projection optical structure will also be demonstrated.
Prior art & relation information survey
Collimated backlight module design
Projection optical structure
1. Microstructure method 2. Projection lens method
Image quality estimation (MTF > 50%) Fail Backlight module modification Fail Projection optical modification Fabrication Pass Experiments and results analysis Specifications determinations of optical system Projection image Microstructures 1.Microstructure method Projection image Projection lens Mobile phone (Folding phone type)
2.Projection lens method
Collimated backlight module
29
4.2 Collimation Backlight Module Design
In the projection mode, a collimated light source was required to reduce the crosstalk, as well as to improve image quality and light efficiency. Therefore, the major characteristic of backlight was to provide a small diverging angle.
The collimation backlight [19] perspective view and side view are shown in Fig. 4-2. The collimation backlight module used LED array light source. The LEDs which were located at the side edge of the light guide were firstly collimated by a parabolic mirror, one for each LED. Then, micro-prism structure was patterned on the bottom surface of light guide. The micro-prism structure redirected the emerging light from light guide plate to the direction that was perpendicular to the top surface of light guide. x y Light-guide plate LED Parabolic mirror Parabolic mirror & LED array
(Perspective)
(a)
(b)
Fig. 4-2 Configurations of high collimation backlight module (a) perspective and (b) side view.
30 , 2 4 tan 1 ⎟ ⎠ ⎞ ⎜ ⎝ ⎛ − = π θ m
In the backlight structure, following parameters should be considered, as shown in Fig. 4-3.
θ: the LED divergent angle c: the distance from the focus to
the reflector apex α: the angle of side prism β: the angle of micro-prism D: the radius of parabolic mirror h: the thickness of light-guide plate m1,m2: the slope of tangent p: the period of LED array
Fig. 4-3 Parameters of backlight structure.
According to the diverging angle of ±θ for LED, the tangent of parabolic slope is:
(8) and the formula of parabolic curve is:
z
2=
4
cx
(9) then the tangent of parabolic slope is:(10) By equations (8) through (10), z1 and z2 could be obtained, and thickness of
light-guide plate satisfied the equation:
(11) In the light-guide plate part, in order to guide the light to the normal direction, the relationship between α and β follows:
(12) “n” is the refractive index. According to equations (8) through (12), the backlight module could be built by simulation software. According to simulating results, the light diverging angle could be confined within 5。 measured at the FWHM (Full Width
⎟ ⎠ ⎞ ⎜ ⎝ ⎛ + = 2 4 tan 2 π θ m x c m=
(
z1 z2)
h≥ − 1 ) 2 sin( ) 2 cos( tan − ∗ = β β α n31
at Half Maximum), and the uniformity was 76%. The angular profile of emerging light and illuminance distribution passing through the light guide surface are shown in Figs. 4-4(a) and (b) respectively. The area inside red dotted line was the panel display area, as shown in Fig. 4-4(b).
(a) (b)
Fig. 4-4 Backlight properties: (a) Angular profile of emerging light from backlight module and (b) illuminace distribution (red region: panel display area).
4.3 Optical Structure for Microstructure Method
After the backlight simulation, the optical structure of microstructure method was designed. The asymmetric lens structure was built to confirm that light direction in the projection mode as the assumption mentioned in section 2.2.
4.3.1 Optical Model Setup
The optical structure was an asymmetric lens structure. By various curvatures of the asymmetric lens, light radiated outward and gradually diverged toward both sides (Fig. 2-6(a)). Therefore, light refractive angles θi(x) were different with respect to
32
asymmetric lens structure which was similar to the microstructure was built by simulation software LightTools, as shown in Fig. 4-6.
Asymmetriclenticularlens
: Light trace
X
Fig. 4-5 The refractive angles θi(x) are different with respect to position “x”.
1 + i
θ
iθ
θ
i+2θ
i+3x
Lens prism (a) (b)Fig. 4-6 (a) Sketch of the asymmetric microstructure, and (b) each microstructure is comprised of a lens and a prism.
Each microstructure was comprised of a prism and a lens. The prism was used to guide the light and the lens was to magnify the image as shown in Fig. 4-6(b). Because the total microstructures on the panel were bilateral, half of the microstructures were adequate to build the model. Due to panel pixel numbers of 320 per column and microstructure pixel by pixel characteristic, the half microstructures were 160 in each column. According to the magnification ratio, panel size, and throw distance, the refractive angles “θi”, prism angle “Φi”, and prism height “hi” were calculated, as
33
x
d
pixel size= p Magnified pixel size =mp Half projection area length = ma
Half panel length = a
i
θ
i
φ
Half projection area length = ma Magnified pixel size = mp Half panel length = a pixel size = p Throw distance = d Light refractive angles = θi
Prism angle = Φi
Prism height = hi
i
h
Fig. 4-7 The sketch of the microstructure.
The value of the refractive angles “θi” is:
(
)
160 ~ 1 i , d 1 * 2 * 2 -a -) 1 * 2 ( * 2 mp -ma tan1 = ⎥ ⎥ ⎥ ⎥ ⎦ ⎤ ⎢ ⎢ ⎢ ⎢ ⎣ ⎡ ⎥ ⎦ ⎤ ⎢ ⎣ ⎡ ⎟ ⎠ ⎞ ⎜ ⎝ ⎛ − ⎟ ⎠ ⎞ ⎜ ⎝ ⎛ − = − i p i iθ
(13)The symbol “d” is the throw distance. By Snell’s law and equation (13), the prism angle “Φi” and prism height “hi” are obtained:
⎥⎦
⎤
⎢⎣
⎡
−
=
−)]
cos(
5
.
1
[
)
sin(
tan
1 i i iθ
θ
φ
(14) ) tan( * i i p h = φ (15) The prism structures can be designed by equations (13) through (15).After calculating the microstructure parameters, the one column microstructures model was built using simulation software, and light was radiated outward and
34
gradually diverged toward both sides, as shown in Fig. 4-8. In addition, from ray trace results, the length of projection area was magnified from 40.64mm to 284.48mm. The magnification ratio was 7 times.
One column structure Ray trace
Receiver
Microstructures
Fig. 4-8 The ray trace results of microstructure model.
From the simulation result of one column structure, light behavior satisfied the assumption that light radiated outward and gradually diverged toward both sides. Then, the whole panel structure was built. Building microstructures covering the whole panel was difficult by simulation software, the microstructures were replaced with a concave lens structure. First, the optical path of each microstructure was calculated (Fig. 4-8(a)). Then these optical paths were summed up, a concave lens structure which covered the whole panel was obtained (Fig. 4-9(b)), and the optical model was set up. Therefore, the structure for simulation was simplified.
L1 L2 L3 OPD=np*L1+na*L2+nl*L3 l a p n n n : prism reflective index : air reflective index : lens reflective index Microstructures panel
Concave lens structure panel
(a) (b)
Fig. 4-9 (a) Optical path of a microstructure, and (b) whole panel concave lens structure.
35
4.3.2 Image Quality Measurement by Simulation
After setting up the optical structure, the concave lens structure was combined with the backlight module by simulation, and image quality was calculated. According to the MTF definition, different barrier pitches could be used to simulate different spatial frequencies. The light was blocked by the black sections of barrier, and passed through the white sections of barrier, as shown in Fig. 4-10. Then, comparing light intensity on the projection area with the barrier structure, image quality was obtained. The structure used to simulate image quality is shown in Fig. 4-10. Base on the MTF definition and formula, the image quality formula is:
pitch
B/L(Diverging angle~=5o)
receiver
Barrier Backlight Concave lens structure
Fig. 4-10 Image quality simulation structure.
Contrast ratio(cr) = min max min max
I
I
I
I
+
−
(16)Image quality index =
b r
cr
cr
(17) “I” is the intensity measured at the barrier or receiver. The suffixes “r” and “b” refer to the receiver and barrier respectively. The contrast ratio (crb) was equal to 1, so that the image quality index formula is:
Image quality index =
min max min max
I
I
I
I
cr
r+
−
=
(18)36
By using a backlight of 5-degree diverging angle, the correlation between image quality index and pitch is shown below (Fig. 4-11), where the horizontal axis is the pitch, and the vertical axis is the image quality index which had been normalized. When using the backlight of 5-degree diverging angle, the emerging light from adjacent barrier regions overlapped, as shown in Fig. 4-12. Therefore, after passing through concave lens, the projected image became indistinguishable. In Fig. 4-11, the indices are lower than 0.5 for all pitches, which also meant the projected image contrast decreased for more than 50 %. Thus, image quality did not achieve the specifications (Table. 3). In addition, the 5-degree diverging angle backlight was not adequate for the concave lens structure.
0 0.1 0.2 0.3 0.4 0.5 3.81 3.30 2.79 2.54 2.29 2.03 1.78 1.52 1.27 0.76 0.25 Im ag e qu al it y inde x pitch(mm) Diverging angle =5 degree
Fig. 4-11 The correlation between image quality index and pitch. The horizontal axis is the barrier pitch, and the vertical axis is the image quality index.
B/L(Diverging angle~=5o)
Barrier Backlight Overlapped parts
37
In order to determine the appropriate diverging angle for the concave lens structure, different diverging angles were applied. The panel pixel size was 124.5um, corresponding to 0.25mm barrier pitch. At 0.25mm pitch, using different diverging angles, the correlation between the image quality index and the diverging angle is shown in Fig. 4-13. 0 0.2 0.4 0.6 0.8 1 1.2 0 0.5 0.56 0.6 0.8 1 2 3 4 5 Im ag e qual it y i nde x diverging angle
0.5
~0.7 Pitch=0.25(mm)Fig. 4-13 The relation between the image quality index and the diverging angle.
From Fig. 4-13, if the diverging angle was about 0.7。, the image quality index was higher than 0.5. Consequently, to improve the image quality, the backlight diverging angle must be of less than 0.7。in microstructures system. However, 0.7-degree backlight diverging angle was hardly achieved by using LED light source for mobile phone. The combined concave lens structure with 5-degree diverging angle backlight was not applicable in mobile projection.
38
4.4 Optical Structure for Projection Lens Structure
The microstructure method could not achieve the projection function. To project an image using the 5-degree diverging angle backlight, a projection lens structure was proposed.
The relationship between magnification, throw distance, total track of projection lens, the object distance, image distance, and focal length are defined below,
f m m T T. .=(2−1 − )* (19) f m OBD=(1− )* (20) f m IMD=(1−1 )* (21)
Here “m” is the magnification, “f” is focal length, and “T.T.” is total distance from object plane to image plane. “OBD” and “IMD” are object distance and image distance. Due to the 5-degree diverging angle, the optical system f/# was 11.5. In addition, the field of view (FOV) was the ratio of half projection image to OBD and was about 23。. Then, the triplet lens was decided based on f/# and FOV (Fig. 4-15) [20]. The triplet lens consisted of three elements: two convex elements at both sides and one concave element in the middle, as shown in Fig. 4-14 [21]. Also, the lens offered sufficient design flexibility to reach the image quality specifications which was mentioned in Chapter 3.
Convex element Convex element Concave element
Fig. 4-14 Triplet lens was comprised of two convex elements and one concave element.
39
Triplet lens
f/#=11.5 FOV=23
Fig. 4-15 Qualitative plot of optical system type [20].
Moreover, to maintain the light efficiency and brightness from the light source in projection mode, emerging light from the LCD panel needed to be perpendicular to the panel surface. The characteristic was called telecentricity [22] and was a feature of the projection lens. Also, to achieve telecentircity, the fourth lens was added in front of the panel to modify the light emitting from the panel. Besides, to consider the projection lens weight, the plastic material was used, and PMMA was selected for transmittance concern. PMMA (Polymethylmethacrylate) [23] has features such as high transmittance (about 93%) and lower density (1.19 G/cm3). Due to lower density, the projection lens weighted less.
A simulation based on the above considerations was proceeded, then the projection lens layout and light path in the projection mode is shown in Fig. 4-16, and the projection lens parameters are list in Table. 4.
40 74mm 426mm Image size ~14” Panel size ~1.96”
Projection lens elements
Fig. 4-16 Layout and light path of projection lens in projection mode.
Table. 4 Radius, thickness diameter, and material parameters (unit: mm).
Radius Thickness Diameter Glass
Object Infinity 426.7 357 1 16.5 3.6 16 PMMA 2 -465.4 5 14.6 Stop Infinity 3.5 7.8 4 -16.2 1.1 9.6 PMMA 5 19 2.6 11.5 6 41.3 3.8 17.2 PMMA 7 -23.7 29.6 18.1 8 50.5 11.4 52 PMMA 9 -656.9 12.6 52 Image Infinity 50.8 (mm) (mm) (mm)
41
In Fig. 4-16, all four plastic lenses were spherical, and the total track of light path was 500mm. Then the projection image size on the left end was 284mm by 213mm, about a size of an A4 paper with a throw distance of 426mm.
According to the projection lens design, the panel size on the right end of the light path had a diagonal length of 1.96 inches. Thus, the pixel size was 124.5um, which was corresponding to the spatial frequency of 4 lp/mm. Then, from simulation results, the MTF of the projection lens is shown in Fig. 4-17. According to Fig. 4-17, the MTF was greater than 50% at 4 lp/mm for all fields, which satisfied the required specifications. Besides, the relative illumination is shown in Fig. 4-18. The horizontal axis is the image height (the distance from on-axis), and the vertical axis is the normalized
4.00
Fig. 4-17 The projection lens MTF.
relative illumination. Relative illumination was the relation between on-axis illumination and off-axis illumination, and the relative illumination was higher than 70% at the maximum FOV (the right end of figure), which also satisfied the specifications. Then Table. 5 summarized the projection lens properties.
42
Fig. 4-18 Relative illumination figure.
Table. 5 Projection lens properties
Projection lens
F/# 11.5 Total track of lens element
(at projection mode)
61mm
Throw distance 426mm
Magnification ratio ~7 times (50.8mm in diagonal magnifies to 356mm in diagonal)
Relation illumination ~71%
43
4.5 Summary
The microstructure method was not applicable for mobile projection, due to backlight diverging angle limitation. The microstructure method required backlight diverging angle to be of less than 0.7。. However, the projection function was achieved by combining the projection lens and collimation backlight module. Using ray tracing simulation, the projection lens MTF was greater than 50% at 4 lp/mm. Moreover, the projection image size was about the size of an A4 paper, which was about 14 inch diagonally in length, with a throw distance of 426mm. Besides, the backlight module uniformity reached 76% and the diverging angle was 5。 measured at the FWHM. Base on simulation results, the projection lens and backlight module were determined to be the experimental structure and was fabricated.
44
Chapter 5
Experimental Results and Discussions
With the fabricated module, backlight properties including the diverging angle of emerging light and uniformity will be measured. The experiment which is combining projection lens with backlight will be presented. Finally, in order to confirm the switch function, direct view and projection functions will be demonstrated
5.1 Backlight Properties
The fabricated collimated backlight module is shown in Fig. 5-1. The backlight module used 14 LED light sources which were located at the side of the light guide, and the measured total flux of the backlight module could provide about 43 lumens brightness. Moreover, to reflect light, the surface of the micro prism structure was coated with Ag, as shown in Fig. 5-1. The backlight angular profile measurement is shown in Fig. 5-2(a). The FWHM of angular divergence was about 8∘. The measured angular divergence was different from the simulation result of 5∘. The difference was an accumulated result from fabrication tolerance to set-up deviation. Besides, the backlight uniformity is shown in Fig. 5-2(b). The red line region was panel display area. From Fig. 5-2(b), a coating defect on the left side was observed (the green circle). However, the defect had no impact on uniformity. Thus, the measured uniformity was 82%. The uniformity was higher than simulation result by about 7.8%.
45
Micro prism structure(coating with Ag) Parabolic mirror
LEDs
Fig. 5-1 The configuration of the fabricated backlight module.
8o 1-0.8 - 0.6- 0.4- 0.2- 0--80 -60 -40 -20 0 20 40 60 80 Viewing angle (a) (b)
Fig. 5-2 (a) Angular profile of emerging light from backlight module and (b) illuminace distribution (red region: panel display area, and green circle: coating defect).
5.2 Experiment Combining Projection Lens and LC Panel
The image source was expected to be provided by the LC panel in the switchable device. In order to confirm the LC panel could project an image, experiments which combined projection lens with a LC panel were conducted, as shown in Fig. 5-3.
46
~~
42cm screen Collimated backlight module LCD Projection lensFig. 5-3 Projection lens with LC panel experiment setup.
The LC panel provided the image source pattern. Then, projection lens projected the image pattern on the screen, as shown in Fig. 5-4. The grid size of image source pattern was 0.127mm by 0.127mm, as shown in Fig. 5-4(a), and the magnified grid of projection image was 0.876mm by 0.876mm (Fig. 5-4(b)). Therefore, the magnification ratio was about 7 times.
Projection image Image source pattern
0.876mm 0.876
mm
(a) (b) Image source pattern
0.127mm 0.127
mm
Fig. 5-4 (a) Net image source pattern (the picture has been magnified 7 times), (b) projection image.
Due to the lens quality, the surfaces of all the used lenses were not spherical and with lots of blemishes on the lens surfaces. These lens defects resulted in only few rays
47
near panel edge could pass through the projection lens. Consequently, the projected image was brighter in center than the edge, and formed an image with bright circle in the middle (Fig. 5-4 (b)).
In order to form a brighter projected image, which would only show in the above-mentioned bright circle region, as shown in Fig. 5-4(b), the image source area must be limited. To fit this area constraint, image source size was required to be reduced so that the entire image pattern could be shown. Because the diameter of the bright circle was 124.5mm (4.9”), the usable image source size was 17.78mm (0.7”) in diagonal length based on experimental results, as shown in Fig. 5-5. The ratio of 124.5 to 17.8 mm matched the magnification ratio of the projected image to the source image. From the experimental results, projection lens element with LC panel could perform the projection function. Furthermore, to present the brighter projected image, the size of image source pattern was modified to 0.7” in diagonal length in later experiments. Projection image Image source pattern 4.9”=124.5mm 0.7”=17.8mm
48
5.3 Projection Lens Imaging Ability and Switching Function
To make sure the switching function was practicable, the switching experiment was implemented, and the experiment setup is shown in Fig. 5-6(a). A collimated backlight module, a commercialized PDLC, a projection lens element, a LC panel, and screen are shown. The image source pattern was provided by a LC panel, then direct view and projection functions could be switched by adjusting the PDLC on/off state. The PDLC on/off states are shown in Fig. 5-7. When no voltage was applied to the PDLC, the PDLC was off and became diffusive, then light was scattered by passing through the PDLC, as shown in Fig. 5-7(a). Nevertheless, when sufficient voltage was applied to the PDLC, the PDLC turned on and became a transparent film. Light passed through the PDLC without scattering, as shown in Fig. 5-7(b).
~~
42cm screen PDLC Collimated backlight module LCD Projection lens (a) PDLC (off) Collimated backlight module LCD~ ~
42cm screen PDLC (on) Collimated backlight module LCD Projection lens (b) (c)Fig. 5-6 (a) Projection mode experiment setup, (b) direct view mode, and (c) projection mode.
![Fig. 1-5 DLP projector optical system [1].](https://thumb-ap.123doks.com/thumbv2/9libinfo/8341589.176073/15.892.136.757.525.919/fig-dlp-projector-optical-system.webp)
![Fig. 1-7 3LCD projector optical engine [5].](https://thumb-ap.123doks.com/thumbv2/9libinfo/8341589.176073/17.892.159.703.128.361/fig-lcd-projector-optical-engine.webp)
![Fig. 1-10 (a) Mini-projector by Optoma and DLP technology from TI [9] and (b) connect with mobile phone](https://thumb-ap.123doks.com/thumbv2/9libinfo/8341589.176073/20.892.145.726.543.771/fig-mini-projector-optoma-technology-connect-mobile-phone.webp)