Effect of non-uniform heating on the performance of the microchannel heat sinks
☆
Chun-Kai Liu
a, Shu-Jung Yang
a, Yu-Lin Chao
a, Kun Ying Liou
b, Chi-Chuan Wang
b,⁎
a
Electronics and Optoelectronics Research Laboratories, Industrial Technology Research Institute, Hsinchu 310, Taiwan b
Department of Mechanical Engineering, National Chiao Tung University, Hsinchu 300, Taiwan
a b s t r a c t
a r t i c l e i n f o
Available online 5 March 2013 Keywords:
Microchannel Non-uniform heating Heat sink
The present study experimentally investigates the performance of a 2-pass microchannel heat sink subject to non-uniform heating. The size of the microchannel heat sink is 132 mm × 82 mm × 6 mm with a rectangular channel of 1 mm × 1 mm. Three independent heaters having identical size (96 mm × 38.5 mm × 1 mm) is placed consecutively below the microchannel heat sink. Two kinds of manifolds are used for testing of the microchannel, one with a side entrance (type A) and the other with a front entrance (type B). Test results show that both maximum temperature and average temperature rise with the total input power, and this is applicable for both manifolds. For uniform heating condition, the maximum temperature for type B manifold is much lower than that for type A manifold due to a betterflow distribution and heat transfer per-formance. The pressure drop is slightly reduced with the rise of supplied power. For non-uniform heating, the maximum temperature and the average temperature depend on the location of heaters. For the same sup-plied power with non-uniform heating, it is found that heater being placed at the inlet of the microchannel will give rise to a higher maximum temperature than that being placed at the rear of the heat sink. This
phenomenon is especially pronounced when the inletflowrate is comparatively small and becomes less
noted as the inletflowrate is increased to 0.7 L/min.
© 2013 Elsevier Ltd. All rights reserved.
1. Introduction
The microelectronic industry has continued to follow the Moore's law of increasing transistor density on a single chip[1]. Hence, the heat dissipation density of a typical chip has risen dramatically since more and more transistors are being packed in a confined area. As a consequence, thermal management exploiting convention-al air-cooling becomes insufficient to handle the increasing heat dis-sipation of the current and future microprocessors. In this regard, single phase liquid cooling for microprocessors has been recognized as an effective alternative for the highflux applications. Liquid cooling employing microchannel design is especially promising for it pro-vides effective heat removal within a limited space. However, there are two major issues in association with liquid-cooled microchannel heat sink. Thefirst is the liquid flow distribution alongside the multiple microchannels and the second problem is inherited with the nature of electronic devices whose heat source is normally non-uniform. The presence of non-uniform heating may substantially raise the tempera-ture for its gigantic spreading resistance.
In recent years, there had been some studies concerning the in flu-ence of inlet location on theflow distribution of a liquid-cooled heat sink. For example, Lu and Wang[2]studiedfive different inlet loca-tions, namely I-type, Z-type,]-type, L-type andΓ-type, on the overall
performance of a multiple liquid-cooled heat sink. Their results showed that the heat transfer performance for I-type outperforms other inlet arrangements. Ljubisa et al.[3]designed a microchannel having a splittingflow arrangement which can considerably reduce the pressure drop of the microchannel heat sink.
Since both heat transfer and pressure drop must be considered in optimizing the performance of the microchannel heat sinks. Toh et al.
[3]performed a 3-D numerical simulation of the microchannels, and they reported that at lower Reynolds number the temperature of the water increases, leading to a decrease in the viscosity and hence smaller frictional losses. Park et al.[4]numerically examined the ef-fect of rectangular channel size on the performance of microchannels. They found that there were deviations between the experimental and theoretical values of the heat transfer rate in the microchannels, and they proposed an empirical correlation to amend the deviations. Liu et al. [5] use a PIV technique to measure velocity distribution of microchannel subject tofive different inlet arrangements, and their measured results are generally in line with the numerical calculation by Lu and Wang[2].
The foregoing results are mainly associated with uniform heating condition. In practical application, the surface heatflux may not be uniform, and this is commonly encountered in typical IGBT/diode high power module. However, relevant researches on this topic are very rare. Lelea[6] numerically investigated the effect of partially heated perimeter on the microchannel. He found that the partial heating together with variable viscosity casted a strong influence on the thermal and hydrodynamic characteristics of the micro-heat
☆ Communicated by W.J. Minkowycz.
⁎ Corresponding author at: EE474, 1001 University Road, Hsinchu 300, Taiwan. E-mail address:[email protected](C.-C. Wang).
0735-1933/$– see front matter © 2013 Elsevier Ltd. All rights reserved. http://dx.doi.org/10.1016/j.icheatmasstransfer.2013.02.003
Contents lists available atSciVerse ScienceDirect
International Communications in Heat and Mass Transfer
j o u r n a l h o m e p a g e : w w w . e l s e v i e r . c o m / l o c a t e / i c h m tsink. Cho et al. [7,8] investigated the cooling performance of the microchannel heat sinks under various heatflux conditions subject to different geometry and header locations. Thermal load is applied to the microchannel heat sinks by nine separate heaters in order to provide a uniform or non-uniform heatflux. Their results indicated that the straight microchannels are less sensitive to the temperature distributions.
As seen, very few researches were concerned with the influence of non-uniform heating on the performance of the microchannel heat
sink, yet the experimental data is especially rare. In this regard, it is the objective of this study to provide some experimental data on this subject.
2. Experimental setup
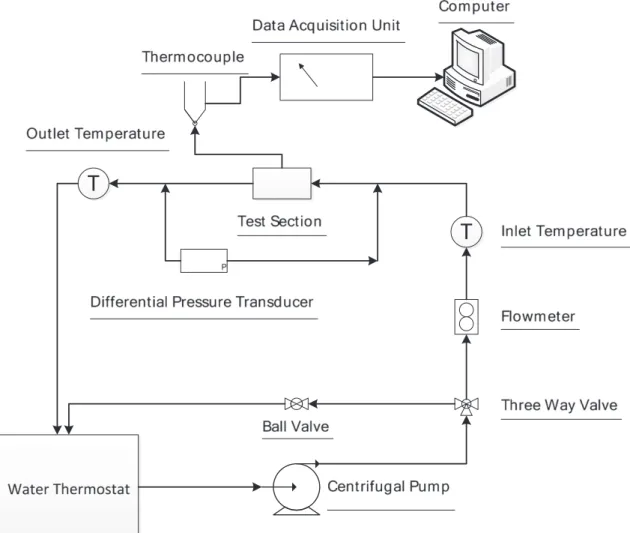
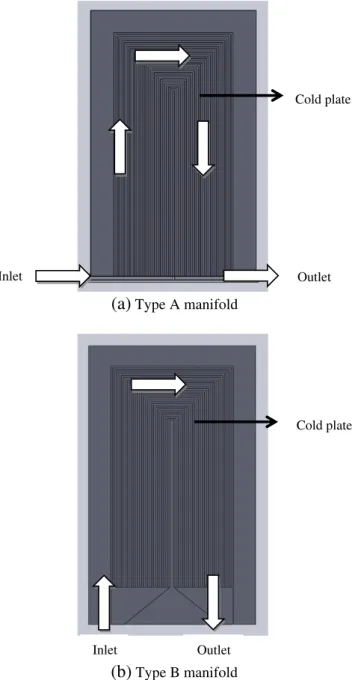
The schematic of the experimental apparatus is depicted inFig. 1. The test rig is composed of a water cooling loop, a data acquisition system, and a water thermostat. The water thermostat is to maintain afixed inlet water temperature into the test section. The water loop consists of a centrifugal pump (Iwaki Corp., model MD-20RZ) which delivers water coolant alongside the piping and into the test sec-tion. The water pump can provide a volumetricflowrate from 0.1 to 1 L/min. A pre-calibrated rotameter is installed between the water pump and the test section. The uncertainty of the volumetric flowrate is less than 0.005 L/min of the test span. The test sample is a two-pass microchannel heat sink with two different designs of manifold. The manifolds are characterized as long edge (type A) or short edge (type B). The long edge manifold denotes a side inlet entrance which is normal to the mainflow direction while the inlet of the short edge manifold is parallel to theflow direction. The size of type A manifold is 10 mm × 102 mm × 21 mm. The size of inlet and outlet manifolds is identical. The size of the type B manifold is 25 mm × 90 mm × 14 mm. Schematic of theflow direc-tion in and out the microchannel for type A and type B manifolds is schematically shown inFig. 2. The size of the microchannel heat sink is 132 mm ×82 mm×6 mm and is made of cooper. The rectangular Nomenclature
Dh hydraulic diameter, mm
P supplied power into the heater, W Pr Prandtl number, dimensionless
Q heat transfer rate carried by water coolant, W Qavg average heat transfer rate, Qavg¼
QsupþQ 2 , W
Qlosg heat loss through the bakelite, W
Qsup supplied input to the microchannel heat sink, W Re Reynolds number, dimensionless
T temperature, °C
Tin water inlet temperature, °C Tout water outlet temperature, °C
x axial coordinate from the entrance of the microchannel, m
x+ dimensionless axial coordinate, xþ fully devloped¼
x DhRePr
channel size is 1 mm × 1 mm, and each pass has a total offifteen chan-nels. The channel is located in the middle of the copper plate, indicating a wall thickness of 2.5 mm for the microchannel heat sink.
A differential pressure transducer (Yokogawa, model EJA110-DM) is used to measure the pressure drop across the test section with an accuracy of 0.1% of the test span. The inlet and outlet water tempera-tures were measured by two precision RTDs with calibrated accura-cies of 0.1 °C. A total of six T-type thermocouples are used to measure the surface temperature beneath the cold plate. The loca-tions of the thermocouples are shown inFig. 3(a). Notice that the thermocouples were pre-calibrated from 20 °C to 80 °C, with a cali-brated accuracy of 0.1 °C. All the measured temperatures were recorded by a data acquisition unit (Yokogawa MX100) for further analysis. An insulation box made of bakelite with a low thermal con-ductivity of 0.233 Wm−1K−1is placed beneath the heater to reduce the heat loss. In addition, a total of 4 T-type thermocouples are installed inside the bakelite block at two cross positions to calculate the heat loss from the bottom of the heater. Three independent
heaters having identical size (96 mm × 38.5 mm × 1 mm) is placed consecutively below the microchannel heat sink. A schematic show-ing the heater arrangement is shown inFig. 3(b). Three autotrans-formers are used to control power into the heater and the maximum power is 250 W. To minimize the contact resistance amid the heater and the microchannel heat sink, a thermal grease with ef-fective thermal conductivity of 2.8 W m−1K−1is used, and an addi-tional load cell with supplying load of 100 kgf is also utilized during the experiment. The actual power into the microchannel is calculated as follows: Qsup¼ P−Qloss: ð1Þ Q¼ _mcpðTout−TinÞ: ð2Þ Qavg¼ Qsupþ Q 2 : ð3Þ
where P is the supplied power into the heater and Qlossis the heat floss estimated from the Fourier conduction law of the measured temperatures at the bakelite. Qavgdenotes the mathematical average of Qsupand Q. Normally the energy unbalance amid Qsupand Q is less than 5%.
3. Results and discussion
Fig. 4shows the maximum temperature and the average surface temperature for the test sample for type A manifold subject to inlet temperature. The corresponding inlet temperatures are 25 °C, 30 °C, 35 °C, and 40 °C respectively while the inletflow rate is 0.71 L/min. In this case, the three independent heat sources are all activated and the total input power, Qavg, is shown in the abscissa. The condi-tion represents the uniform heating situacondi-tion. As expected, both max-imum temperature and average temperature rise with the total input power. On the other hand, the temperature difference between the maximum temperature and average temperature also rises with the supplied power. It is also noted that the maximum temperature is lo-cated at the 6th thermocouple location which is near the exit of the cold plate.
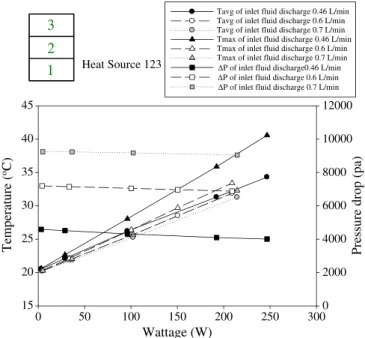
Fig. 5shows the maximum temperature, the average surface tem-perature, and pressure drops for the type B manifold subject to total input power. The corresponding inlet temperature is 20 °C while the inlet flow rates are 0.46, 0.6, and 0.7 L/min, respectively. As shown inFig. 5, the pressure drop is reduced with the rise of supplied power. This is because the corresponding viscosity of the water coolant is reduced with the increasing temperature, thereby leading to a slight decline of the pressure drop. The results are analogous to that reported by Toh et al.[3]. It is also noted that the difference be-tween maximum temperature and average temperature for type B manifold is comparatively lower than type A manifold. This is primar-ily due to the difference of inlet/outlet manifold. The manifold of type B yields a betterflow distribution. This is somewhat expected from the inlet configurations where the flow entering the inlet manifold for type A may exhibit a jetflow pattern which may jeopardize the flow distribution. The mal-distribution had been numerically and experimentally verified by Lu and Wang[2], Liu et al.[5], and Wang et al.[9,10]. On the other hand, the inlet configuration of type B manifold had lifted the influence of jet flow, thereby leading to a bet-ter flow and temperature distribution. As aforementioned in the
Introductionsection, the numerical calculation by Lu and Wang[2]
also indicated that I type manifold shows the best heat transfer than other arrangements. The present type B manifold is similar to that of I-type arrangement of Lu and Wang[2]. This also substantiates a lower temperature for the type B manifold due to its better heat transfer performance.
(a)
Type A manifold
(b)
Type B manifold
Inlet
Outlet
Cold plate
Cold plate
Inlet
Outlet
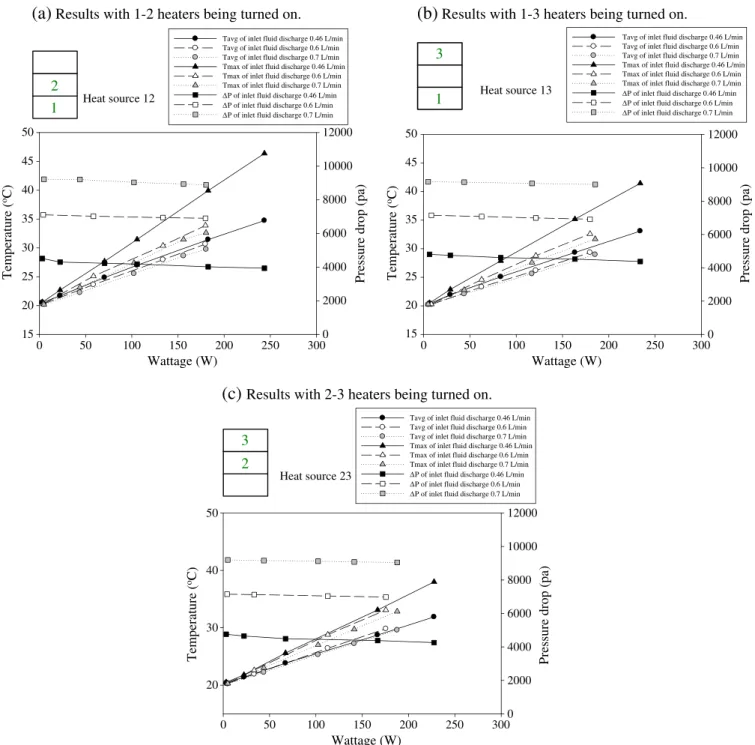
The foregoing results are applicable for the uniformly supplied input power, the effect of non-uniform heating subject to various heating locations is shown inFig. 6(a)–(c). For an easier understand-ing about the on/off characteristics of the provided heaters, the appeared number in the figure indicates that the corresponding heater is turned on during the test. For the case of two heaters at a specified flow rate, it appeared that the 1–2 heaters show the highest maximum surface temperature, followed by for 1–3 heaters and 2–3 heaters that reveal the lowest temperature. This is especially pro-nounced at a lower inletflowrate of 0.46 L/min. Note that the tem-perature difference amid heaters 1–2 and 2–3 is as high as 10 °C at a total input power of 250 W. The results are quite surprising for both heater size and the total input power are the same. Explanations
of this phenomenon are two-fold. Firstly, as is well known, the heat transfer coefficient, or in terms of local Nusselt number Nu, is strongly related to the entrance length. The heat transfer coefficient decreases appreciably from the entrance toward the exit. However, since the present test sample is a 2-pass design where theflow is abruptly forced to turn around at the end of thefirst pass, thereby the violent flow field and strong mixing occurs that suggests the flow at the be-ginning of the second pass is similar to that at thefirst pass. For the 1–2 heater arrangement, the portion of the second pass is at a lower heat transfer performance region (downstream at the second pass).
(a)
Thermocouple
(b)
heater
Fig. 3. Schematic of the location of thermocouples and heaters.
Wattage (W)
0 100 200 300 400Temperature (
oC)
20 30 40 50 60 70 80Tavg at inlet fluid temperature,25 o C Tmax at inlet fluid temperature,25 o
C Tavg at inlet fluid temperature,30 o
C Tmax at inlet fluid temperature,30 o
C Tavg at inlet fluid temperature,35 oC Tmax at inlet fluid temperature,35 o
C Tavg at inlet fluid temperature,40 o
C Tmax at inlet fluid temperature,40oC
Fig. 4. Variation of maximum and average surface temperature vs. input power subject to various inlet water temperatures.
Heat Source 123
Wattage (W)
0 50 100 150 200 250 300 15 20 25 30 35 40 45Pressure drop (pa)
0 2000 4000 6000 8000 10000 12000
Tavg of inlet fluid discharge 0.46 L/min Tavg of inlet fluid discharge 0.6 L/min Tavg of inlet fluid discharge 0.7 L/min Tmax of inlet fluid discharge 0.46 L/min Tmax of inlet fluid discharge 0.6 L/min Tmax of inlet fluid discharge 0.7 L/min ΔP of inlet fluid discharge0.46 L/min ΔP of inlet fluid discharge 0.6 L/min ΔP of inlet fluid discharge 0.7 L/min
1
2
3
1
2
3
Temperature (
oC)
Fig. 5. Variation of maximum temperature, average surface temperature, and pressure drop vs. input power subject to various inlet waterflowrates under uniform heating condition.
On the other hand, despite the rear portion of thefirst pass of the 2–3 heaters region shows a comparatively lower heat transfer perfor-mance, it appeared that the portion of the lower heat transfer region is smaller than that of 1–2 arrangements. Secondly, the entrance por-tion (locapor-tion of thefirst heater) which possesses a comparatively lower temperature at the entrance region (heater 1 region) acts as a conduction cooling region for the 2–3 heater arrangement. This pro-vides an additional cooling for the 2–3 heater arrangement. By con-trast, the conduction contribution by the location of the third heater subject to 1–2 heater arrangement is appreciably lower since water temperature in this region is much higher than in the entrance region. In summary of the two foregoing reasons, one can see a significant difference of the maximum temperature for the arrangement of the 1–2 heaters and the 2–3 heaters when the inlet flowrate is 0.46 L/
min. Note that the performance of the 1–3 heaters falls between 1–2 and 2–3 heaters. This is because its arrangement is between 1–2 and 2–3.
On the other hand, the difference of maximum temperature or average temperature between various heater arrangements (1–3, 1–2, or 2–3) is significantly reduced when the inlet flowrate is raised to 0.6 L/min or 0.7 L/min. Explanation of this result is asso-ciated with a much larger increase of pressure drop that leads to a betterfluid flow distribution that eventually gives rise to a small-er tempsmall-erature deviation. In the meantime, a highsmall-erflow rate also results in a shorter entrance length. Note that the fully developed length for a flowrate of 0.46 L/min is about 140 mm (based on the evaluation of xþfully devloped¼
x DhR
hePr≈0:04, Shah and London [11])
but the fully developed length is reduced to 90 mm for an inletflowrate
Heat source 12 15 20 25 30 35 40 45 50
Pressure drop (pa)
0 2000 4000 6000 8000 10000 12000
Tavg of inlet fluid discharge 0.46 L/min Tavg of inlet fluid discharge 0.6 L/min Tavg of inlet fluid discharge 0.7 L/min Tmax of inlet fluid discharge 0.46 L/min Tmax of inlet fluid discharge 0.6 L/min Tmax of inlet fluid discharge 0.7 L/min ΔP of inlet fluid discharge 0.46 L/min ΔP of inlet fluid discharge 0.6 L/min ΔP of inlet fluid discharge 0.7 L/min
1
2
(a)
Results with 1-2 heaters being turned on.
Heat source 13 15 20 25 30 35 40 45 50
Pressure drop (pa)
0 2000 4000 6000 8000 10000 12000
Tavg of inlet fluid discharge 0.46 L/min Tavg of inlet fluid discharge 0.6 L/min Tavg of inlet fluid discharge 0.7 L/min Tmax of inlet fluid discharge 0.46 L/min Tmax of inlet fluid discharge 0.6 L/min Tmax of inlet fluid discharge 0.7 L/min Δ
Δ Δ
P of inlet fluid discharge 0.46 L/min P of inlet fluid discharge 0.6 L/min P of inlet fluid discharge 0.7 L/min
1
3
(b)
Results with 1-3 heaters being turned on.
Temperature (
oC)
Wattage (W)
0 50 100 150 200 250 300Wattage (W)
0 50 100 150 200 250 300Temperature (
oC)
Heat source 23 20 30 40 50Pressure drop (pa)
0 2000 4000 6000 8000 10000 12000
Tavg of inlet fluid discharge 0.46 L/min Tavg of inlet fluid discharge 0.6 L/min Tavg of inlet fluid discharge 0.7 L/min Tmax of inlet fluid discharge 0.46 L/min Tmax of inlet fluid discharge 0.6 L/min Tmax of inlet fluid discharge 0.7 L/min Δ
Δ Δ
P of inlet fluid discharge 0.46 L/min P of inlet fluid discharge 0.6 L/min P of inlet fluid discharge 0.7 L/min
2
3
(c)
Results with 2-3 heaters being turned on.
Temperature (
o
C)
Wattage (W)
0 50 100 150 200 250 300
Fig. 6. Variation of maximum temperature, average surface temperature, and pressure drop vs. input power subject to various inlet waterflowrates under non-uniform heating condition.
of 0.7 L/min. The results imply that the variation of the heat transfer per-formance alongside the microchannel heat sink is considerably reduced, and accordingly a less variation of the temperature difference. 4. Conclusions
This study experimentally investigates the performance of microchannel heat sink subject to non-uniform heating. The size of the microchannel heat sink is 132 mm×82 mm×6 mm having a two-pass arrangement. Size of the rectangular microchannel is 1 mm×1 mm and two manifolds are used in this study. The manifolds are characterized as long edge (type A) or short edge (type B). The long edge manifold denotes a side inlet entrance which is normal to the mainflow direction while the inlet of the short edge manifold is parallel to theflow direction. Three in-dependent heaters having identical size (96 mm×38.5 mm×1 mm) are placed consecutively below the microchannel heat sink. The input power into the heaters can be individually turned on or off to simulate the non-uniform heating condition. Experimental results of this study are summarized in the following:
(1) For either uniform or non-uniform heating condition, both max-imum temperature and average temperature rise with the total input power, and this is applicable for both manifolds. (2) For uniform heating condition, the maximum temperature for
type B manifold is much lower than that of type A manifold due to a betterflow distribution and heat transfer performance. (3) The pressure drop is reduced with the rise of supplied power. This is because the corresponding viscosity of the water coolant is reduced with the supplied power, thereby leading to a slight decline of pressure drop.
(4) For non-uniform heating, the maximum temperature and the average temperature depend on the location of heaters. For the same supplied power, it is found that heater being placed at the inlet of the microchannel will give rise to a higher maximum temperature than that being placed at the rear of the heat sink. This phenomenon is especially pronounced when the inlet flowrate is comparatively small and becomes less noted as the inlet flowrate is increased to 0.7 L/min.
Acknowledgments
This work is supported by the National Science Council of Taiwan under contract of 100-2221-E-009-087-MY3. Thefinancial support from the Department of Industrial Technology, Taiwan is also highly appreciated.
References
[1] M.K. Tiwari, I. Zinovik, D. Poulikakos, T. Brunschwiler, B. Michel, 3D integrated water cooling of a composite multilayer stack of chips, Journal of Heat Transfer 132 (2010) 121402-1–121402-9.
[2] M.C. Lu, C.C. Wang, Effect of the inlet location on the performance of parallel-channel cold-plate, Transactions on Components and Packaging Technol-ogies 29 (2006) 30–38.
[3] L.D. Stevanovic, R.A. Beaupre, A.V. Gowda, A.G. Pautsch, S.A. Solovitz, Integral micro-channel liquid cooling for power electronics, integral micro-channel liquid cooling for power electronics, Proceedings of the Applied Power Electronics Con-ference and Exposition (APEC), Twenty-Fifth Annual IEEE, 2010, pp. 1591–1597. [4] K.C. Toh, X.Y. Chen, J.C. Chai, Numerical computation offluid flow and heat trans-fer in microchannels, International Journal of Heat and Mass Transtrans-fer 45 (2002) 5133–5141.
[5] H.S. Park, J. Punch, Friction factor and heat transfer in multiple microchannels with uniformflow distribution, International Journal of Heat and Mass Transfer 51 (2008) 4535–4543.
[6] M.X. Liu, W.J. Sheu, S.B. Chiang, C.C. Wang, PIV investigation of theflow maldistri-bution in a multi-channel cold plate subject to inlet locations, Journal of En-hanced Heat Transfer 14 (2007) 65–76.
[7] E.S. Cho, J.W. Choi, J.S. Yoon, M.S. Kim, Modeling and simulation on the massflow distribution in microchannel heat sinks with non-uniform heatflux conditions, International Journal of Heat and Mass Transfer 53 (2010) 1341–1348. [8] E.S. Cho, J.W. Choi, J.S. Yoon, M.S. Kim, Experimental study on microchannel heat
sinks considering massflow distribution with non-uniform heat flux conditions, International Journal of Heat and Mass Transfer 53 (2010) 2159–2168. [9] C.C. Wang, K.S. Yang, J.S. Tsai, I.Y. Chen, Liquidflow distribution characteristics in
compact parallelflow heat exchangers, part I: typical inlet header, Applied Ther-mal Engineering 31 (2011) 3226–3234.
[10] C.C. Wang, K.S. Yang, J.S. Tsai, I.Y. Chen, Liquidflow distribution characteristics in compact parallelflow heat exchangers, part II: modified inlet header, Applied Thermal Engineering 31 (2011) 3025–3242.
[11] R.K. Shah, A.L. London, Laminar Flow Forced Convection in Ducts, Academic Press, 1978.