Policy Design and Simulation Analysis for Rice Crop Revenue
Insurance Under WTO Agreement
Pei-Ing Wu
Professor
Department of Agricultural Economics National Taiwan University, Taiwan
Hsing-Yi Shen
Adjunct Teacher
Kaohsiung Municipal Haiching Vocational High School of Technology and Commerce, Taiwan
Je-Liang Liou
Ph.D. Student
Department of Agricultural Economics National Taiwan University, Taiwan
Corresponding Author:
Dr. Pei-Ing Wu
Department of Agricultural Economics
National Taiwan University
No. 1 Section 4 Roosevelt Road
Taipei, 106
TAIWAN
Tel:(02) 886-2-3366-2663
Fax:(02) 886-2-2363-5995
Email:piwu@ntu.edu.tw
The purpose of this study is to design a rice crop revenue insurance policy that takes account of the agreement of WTO and the rice crop guaranteed price program of Taiwan. That is, this revenue insurance policy is a combination of guaranteed revenue, retail revenue, set-aside direct payment, and natural disaster redressing for rice crop production. Simulation analysis is conducted to examine the difference between the government expenditure and net revenue of rice farmers with and without this policy under various insurance expenditures shared by government and rice farmers.
The comparison has also accomplished to examine different scenarios that the whole country is designed as one insurance zone, as six crop-basin insurance zones, and as the insurance zones for major rice crop production counties and cities. Data used in this study is the newest set of individual farm data collected in 1995 from Taiwan
Agriculture, Forest, Fishery, and Animal Husbandry Census Report.
The results from the simulation analyses have shown that the net revenue from rice crop is remained at NT $28,000 per hectare annually while the whole country is
designed as one insurance zone. The government expenditure is increasing with progressive increment share of the insurance expenditure but is decreasing as the guaranteed quantity purchase decline in any kind of the insurance zones design in the study.
The results have further demonstrated that decrease of the guaranteed quantity purchase by 10% and with the share of 25% insurance expenditure for government is an effective design for rice crop revenue insurance. Moreover, with specific insurance expenditure share along with the decrease of guaranteed quantity purchase for
government, the change of net revenue for rice crop is within certain limit. This result illustrates that the rice crop revenue insurance policy has the function of stabilizing income for rice farmers.
Keywords: Guaranteed Price Program, Set-aside Direct Payment, Natural Disaster
Redressing Payment, Insurance Premium, Income Security
I. Introduction
Taiwan’s accession to the World Trade Organization (WTO) in 2002 for joining the global trade membership is comforting on one hand. On the hand, however, it is pressuring Taiwan to confront a new challenge in adjusting agricultural production structure and government subsidy and compensation scheme. Currently, the main supports for agricultural products in Taiwan are guaranteed prices programs for rice, sugar, selected vegetables, fruits, et al. Among these, the support for rice crop production accounts for an average about 33% of all the domestic supports (Wu and Lin, 2000). In order to fulfill the percentage reduction for the amount of aggregate measurement of support (AMS) regulated by the WTO agreement, a new support scheme for rice crop production for devaluating the importance of guaranteed price program and without lessening the farm income is essential.
For stabilizing farm income, different crop insurance, revenue coverage, and farm income protection programs have been adopted in the United States, Canada, and Japan (Carl and Loehman, 1987; Hennessy, Babock, and Hayes, 1997; Barry and Ker, 1998). In Taiwan, although there is compensation for redressing damage to farmers caused by natural disaster the standard for obtaining the payment is normally not controllable. Moreover, choice of targeting on farming land and direct payment on land size to fully replace the current rice guaranteed price program is not agreeable from various
prospects. The alternative approach that is accepted in the agreement of the WTO’s “income insurance and income security program” can then be considered for designing a scheme that partially takes into account the current rice guaranteed price program and rice crop revenue insurance.
insurance plan, the attitude of farmers toward agricultural insurance, the supply and demand of agricultural insurance, and the comparison among different types of agricultural insurance plans (Syed, Ali, and Kurian, 1982; Calum and Boadu, 1989; Michael, 1989; Jen, 1990; Mario, 1991; Calum, 1992; Lee, 1993; Chen, 1995; Babcock and Hennessy, 1996; Hennessy, Babcock, and Hayes, 1997; Jerry, et al., 1998; Cheng, 1999; Huang, Taung, and Huang, 2000; Stephen, Kahl, and Rathwell, 2000). Unifying the ideas of WTO agreement, rice farmers’ revenue, and governmental expenditure in the agricultural revenue insurance scheme is still lack in the literature.
In order to fill the gap, the purpose of this paper is therefore to design a rice crop revenue insurance policy that accounts for the agreement of WTO and the rice crop guaranteed price program of Taiwan. That is, this revenue insurance policy is a combination of income from guaranteed price program, retail revenue of rice selling, set-aside direct payment, and redressing damage to farmers caused by natural disaster for rice crop. The rice crop revenue insurance policy designed in this study is a modification of the model from the studies done by Calum (1992), by Stephen, Kahl, and Rathwell (2000), and by Hennessy, Babcock, and Hayes (1997).
Simulation analysis is conducted to examine the difference between the
government expenditure and net income of rice farmers without and with this policy under various insurance expenditure rates shared by government and rice farmers. The comparison has also been made to accomplish the examination for different scenarios that the whole country is designed as one insurance zone, six crop-basin insurance zones, and the insurance zones for major rice production areas. Data used in this study is the newest set of individual farm data collected in 1995 from Taiwan Agriculture,
To realize the difference of net revenue and government expenditure between supports for rice crop production under current rice guaranteed price program, and set-aside direct payment, and supports from insurance schemes designed as a combination of income from guaranteed price program, rice crop retail revenue, set-aside direct
payment, and natural disaster payment for rice crop, models of Calum (1992), Stephen, Kahl, and Rathwell (2000), Hennessy, Babcock, and Hayes (1997) are modified to be consistent with Taiwan’s current rice crop support programs to achieve this purpose.
1. Net Revenue of Current Rice Crop Production Program
Rice farmers’ income from rice production in Taiwan mainly comes from two sources. One is the income obtaining from the market places and the other is the income acquiring from the rice guaranteed price program. In addition, to achieve the target of domestic support reduction from guaranteed price, “Adjustment of Paddy Utilization in Relation to Upland Crop Rotation” is effectuated since 1998. This kind of direct payment for set-aside farmland is another source of income for rice crop farmers. Moreover, payment could come from redressing damage to farmers while rice crop production is caused by unexpected natural disaster.
Thus elements of per hectare net revenue (W) from rice production for rice farmer
i are partly composed of guaranteed price (TP), market price (P), guaranteed amount of
quantity purchase (YYi), and total quantity of rice production (YFi). These are the
income from guaranteed price program and from market places. The difference
between level of guaranteed price and market prices determines different proportion of total rice crop production that farmers will sell to government or farmers' associations or to market places.
Other elements of income in relation to rice production include redressing damage to farmers caused by natural disaster occasionally. The qualification for rice farmers in any specific county or city to realize per hectare payment (N) is that more than 30% of
total farmlands in that county or city is damaged. Additionally, income from set-aside direct payment is a per hectare payment, designated as S, multiplied by total hectares of set-aside farmland, denoted as Ri. Summation of all these elements is the total revenue
of rice crop production. Thus net revenue of rice production for each rice farmer will be the total revenue minuses the production cost (Ci) and it is written as equation (1)
W=
k i 1
P(Y
Fi-Y
Yi)+[max(T
P, P)Y
Yi]+ξ
iα
iN+R
iS-C
i/
k i 1
α
i(1)
In whichαi is the total rice harvested hectares that each farmer manages and with ξi
percentage of them is qualified to acquire the payment while disaster occurs. While k is the numbers of rice farmers concerned. Per hectare of net revenue from rice production is the total revenue for all rice farmers divided by summing the hectares that each rice farmer manages.
2. Government Expenditure under Current Rice Guaranteed Price Program
Since current supports for rice crop production indicated as those shown in equation (1) and if the rice guaranteed price is greater than the market price, the guaranteed price (TP) multiplied by purchased quantities (YYi) is the total expenditure
for government expending on rice purchase. As such, government expenditure (G) per hectare for rice production should include the cost spent on rice guaranteed price expenditure (TPYYi), redressing damage to farmers caused by natural disaster (αiN), and
the set-aside direct payment (RiS). Hence, this can be shown as
G=
k i 1[T
PY
Yi+ (ξ
iα
iN)+ R
iS] /
k i 1α
i(2)
Similarly, per hectare supports for rice production is the total government expenditure for all rice farmers divided by summation of the hectares that each rice farmer manages.
3. Determination of Insurance Premium
Since there is no definite principle for determining the insurance premium, the crop insurance models of Calum (1992), of Calum and Boadu (1989), and of Hennessy, Babcock, and Hayes (1997) modified to account for the rules of the WTO is adopted here. The basis of these insurance premium models is a measurement of the degree of deviation away from certain income level from agricultural production. Besides, the agreement of the WTO places restrictions on the maximum-security level of income from agricultural production. Model for the computation of insurance premium
constructed here is designed to conform to that agreement. That is, the secured level of income is stabilized at the level while the difference between average income from agricultural production for the past three years and income from agricultural production for current year is 70%.
However, since revenue from rice production is not always remained at a constant level, it distributes at a probability ρ is deemed to be normal. As a result, the insurance
premium
*
is the specific income level distributed at a probability ρ afterperforming the insurance program designed here. The specific income level, then, is the difference between average income for the past three years (WAi), and designated as the
secured level of income, and that of the current year (WBi). The above relation can be
shown as equation (3)
l 1 i
*β[max(WA
i-WB
i, 0) ]
(3)
In equation (3), l represents numbers of farmers joining the insurance program for rice production and l could have the same numbers of farmers as that in equation (1) and (2) or might be less, if not all the rice farmers connect to the insurance program. That is,
l≦k.
A certain percentage of income earned from rice production for the past three years that each farmer delivers to join the insurance program is β. When the current actual income is lower than the secured level of income, this insurance policy starts its function. On the other hand, if secured level of income is less than the current actual income level then the insurance policy terminates to operate.
4. Net Revenue of Rice Production under Insurance Schemes
The first part of the simulation analyses will be conducted to realize the change of net revenue for rice production. Change of net revenue with and without the insurance program is to be apprehended from the comparison between the net revenue before and after this program operates.
Net revenue per hectare from rice production (W1) under insurance program comprises revenue from market prices (P(YFi-YYi)), revenue from the guaranteed price
accompanied by the insurance program (max(TP,P)YYi), the insurance payment
(
βmax(WAi-WBi, 0)) if the insurance program performs, the payment for naturaldisasterαiN, the set-aside direct payment (RiS), the insurance premium (δ
*),
and theproduction cost (Ci). That is, net revenue under insurance program can be expressed as
1
W =P(YFi-YYi)+max(TP,P)YYi+βmax(WAi-WBi,0)
+
ξ
iα
i(γ
N)+RiS-δ*-Ci (4)
Where δ stands for the share of insurance premium that rice farmers are responsible for andβis assumed to be fixed at the limited level 70% regulated by WTO. Due to the similarity between the insurance program and the redressing damage to farmers caused by natural disaster program, the importance of the redressing program is expected to be gradually invalidated. This would cause the payment for natural disaster be regulated under a more rigorous condition γ, where 0 γ 1. The amount of direct payment for ≦ ≦ set-aside is still kept at 1995 standard.
5. Government Expenditure under Insurance Schemes
Similarly, government expenditure for rice supports under insurance program includes expenditure on guaranteed price purchase, the responsible share of insurance premium, and set-aside direct payment. Since the insurance program is more specific and adequate than the natural disaster payment for measurement of stabilizing revenue there is a trade-off for government to spend on these two complementary programs. Equation (5) is the expression of above components for government expenditure under insurance schemes. Again, supports for rice production for all farmers joining the insurance program divided by the total rice production hectares yields average government expenditure per hectare and it is written as follows
G
1=
l i 1[T
PY
Yi+ξ
iα
i(γN)+R
iS+(1-δ)
*] /
l i i 1 (5)
By comparing government expenditure computed from equation (5) and (2), the difference between government expenditure with and without the insurance program is
identified.
III. Simulation and Method of Analyses 1. Data Sources
In order to accomplish the analyses and simulation stated above, individual
farmer’s records with rice crop production as major agricultural production are selected for this purpose. Data collected in Taiwan Agriculture, Forest, Fishery, and Animal
Husbandry Census Report with the newest version in 1995 fulfill the requirement. This
set of data is an interim census data between general census for the year of 1990 and 2000 and it is also the only well-documented set of data by the time of this study
conducted. There are 6,506 individual farm records selected for the following analyses. The county and city distribution of these farms is presented in Table 1. There are seven out of top ten major rice crop production counties and cities that are consistent with the data recorded in the Agricultural Statistics Yearbook (Council of Agriculture, 2000).
It is also found that among 6,506 farmers 12.48% of them are part-time farmers. This is also in accordance with the data surveyed in the Agricultural Statistics
Yearbook. Moreover, total revenue from rice crop production is classified as 13 ranges.
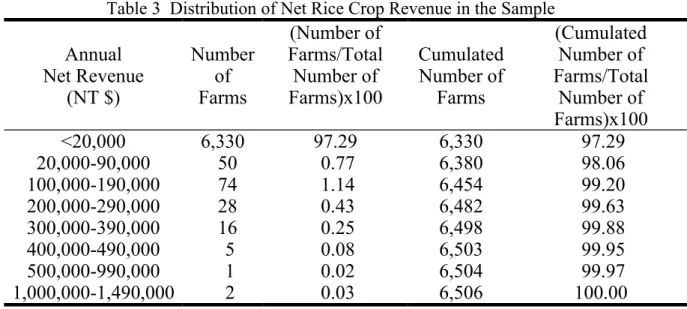
There are 51.12% of farmers’ rice crop total revenues, showing in Table 2, falling in the range of NT$ 20,000 and NT$ 90,000 each year. The net revenue is even lower. That is, from Table 3 it is known that 97.29% of farmers’ net revenue is less than NT$ 20,000 annually.
Table 1 Rice Farms’ County and City Distribution in the Sample
County or City Number of
Farms Percentageof Farms CumulatedNumber of Farms Cumulated Percentage of Farms County Taipei(台北縣) 135 2.08 135 2.08 Ilan*(宜蘭縣) 673 10.34 808 12.42 Taoyun(桃園縣) 217 3.34 1,025 15.75
Hsinchu(新竹縣) 202 3.10 1,227 18.86 Miuli*(苗栗縣) 351 5.40 1,578 24.25 Taichung*(台中縣) 817 12.56 2,395 36.81 Changhua*(彰化縣) 1,324 20.35 3,719 57.16 Nantao(南投縣) 124 1.91 3,843 59.07 Yunlin*(雲林縣) 348 5.35 4,191 64.42 Chiayi*(嘉義縣) 359 5.52 4,550 69.94 Tainan*(台南縣) 379 5.83 4,929 75.76 Kaohuiung(高雄縣) 464 7.13 5,393 82.89 Pingtung(屏東縣) 48 0.74 5,441 83.63 Taitung(台東縣) 238 3.66 5,679 87.29 Hualien(花蓮縣) 170 2.61 5,849 89.90 City Keelung(基隆市) 6 0.09 5,855 89.99 Hsinchu(新竹市) 154 2.37 6,009 92.36 Taichung(台中市) 157 2.41 6,166 94.77 Chiayi(嘉義市) 122 1.88 6,288 96.65 Tainan(台南市) 35 0.54 6,323 97.19 Taipei(台北市) 48 0.74 6,371 97.92 Kaohsiung(高雄市) 135 2.08 6,506 100.00
Note: County or city with asterisk indicates that, consistent with the
statistics reported in the Agricultural Statistics Yearbook in 2000
prepared by Council of Agriculture (2000), the total rice crop
harvested acreages are ranked as top ten production areas.
Table 2 Distribution of Total Rice Crop Revenue in the Sample
Annual Total Revenue (NT $) Number of Farms (Numbers of Farms/Total Number of Farms)x100 Cumulated Number of Farms (Cumulated Number of Farms/Total Number of Farms)x100 <20,000 543 8.35 543 8.35 20,000-90,000 3,326 51.12 3,869 59.47 100,000-190,000 1,792 27.54 5,661 87.01 200,000-290,000 498 7.65 6,159 94.67 300,000-390,000 172 2.64 6,331 97.31 400,000-490,000 89 1.37 6,420 98.68 500,000-990,000 76 1.17 6,496 99.85 1,000,000-1,490,000 5 0.08 6,501 99.92 1,500,000-1,990,000 3 0.05 6,504 99.97 2,000,000-2,990,000 1 0.02 6,505 99.98
>5,000,000 1 0.02 6,506 100.00
Table 3 Distribution of Net Rice Crop Revenue in the Sample
Annual Net Revenue (NT $) Number of Farms (Number of Farms/Total Number of Farms)x100 Cumulated Number of Farms (Cumulated Number of Farms/Total Number of Farms)x100 <20,000 6,330 97.29 6,330 97.29 20,000-90,000 50 0.77 6,380 98.06 100,000-190,000 74 1.14 6,454 99.20 200,000-290,000 28 0.43 6,482 99.63 300,000-390,000 16 0.25 6,498 99.88 400,000-490,000 5 0.08 6,503 99.95 500,000-990,000 1 0.02 6,504 99.97 1,000,000-1,490,000 2 0.03 6,506 100.00
2. Design of Simulation Scenarios for Rice Crop Revenue Insurance
(1) Net Revenue of Rice Crop Production and Government Expenditure of Baseline Year
Since the data are collected from the records in 1995 all the simulated scenarios are designed for comparing to this year. In addition, another baseline year is obtained from the adjustment of all corresponding variables for the year of 2000 to update the records. From the Census Report, data for net income of rice production, the proportion of sales targets, net income of rice farmers from market places, net income from the guaranteed price program, and the set-aside direct payment can be computed accordingly. Since there is no natural disaster redressing payment in 1995, net agricultural income for rice farmers and the expenditure of government are calculated correspondingly.
variables for each farmer’s average income of rice production for the past three years, farmer’s income of rice production of the base year, the guaranteed proportion of income from rice production, and the probability of the specific income level
maintained. To be conformable to the rules regulated by the WTO, the secured specific income level from rice production is fixed at 70% of total revenue for a certain year. The average income of every farmer from rice production for the past three years is about NT$ 128,434. Determination of the probability for the specific income level is similar to those in the studies by Calum (1992) and by Cheng (1999) and the magnitude is 1/6506. This probability, differing from the time series studies done in the past, is considered to reasonably reflect a single year cross sectional sample analyzed here. As a result, the computed insurance premium is NT$ 2,508 per year for each hectare.
The simulation scenarios are designed from the following two aspects. Firstly, as for the shares of insurance premium between the government and rice farmers, we refer to the methods of the U.S. and Japan. That is, the share of the insurance premium for government is between 25% and 75%. The comparison will be made for the change of every 10% among this range of insurance premium. Secondly, based on the guaranteed price purchase quantity of observations in 1995, the guaranteed quantity purchase is simulated to decrease at level of 10%, 20%, 30%, and 40% respectively.
Various scenarios are produced from the above combinations for further simulation analyses. For each scenario, we observe the change of net revenue of rice farmers and government expenditure as compared to the baseline year while whole country is managed as one insurance zone, whole country is divided as six crop-basins, and the insurance zones designed for major rice crop production counties and cities.
(2) Net Revenue of Rice Crop Production and Government Expenditure While Whole Country as One Insurance Zone
Base upon the general information provided above, the net revenue from rice production for the baseline year in 1995 while whole country is designed as one insurance zone can be computed from equation (1). The net revenue is computed by summing the net revenue from the market price, net revenue from guaranteed price, the set-aside direct payment, and redressing damage to farmers caused by natural disaster from the data recorded in Taiwan Agriculture, Forest, Fishery, and Animal Husbandry
Census Report. This results the net revenue of rice production of all observations NT$
139,140,014. On the average, it is NT$ 22,635 per hectare.
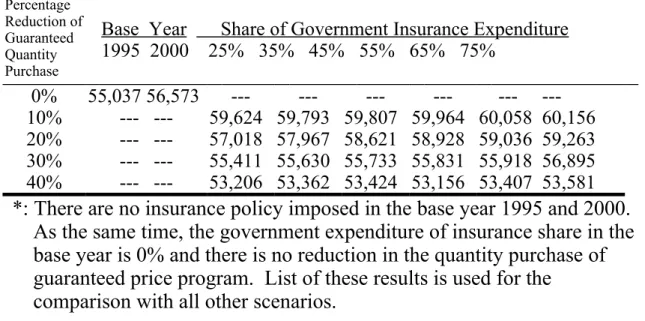
In addition, the government expenditure on the guaranteed price program, the set-aside direct payment, and the redressing damage to farmers caused by natural disaster is NT$ 338,314,763 in 1995. It emerges an average of each hectare NT$ 55,037. It is obvious to perceive that the government expenditure takes 2.43 times as net revenue from rice crop production for every observation. The pressure and burden for
government arising from rice production subsidy and support policies is noticeable. All the necessary variables stated above adjusted for the year 2000, the corresponding results for net revenue of rice production and government expenditure are NT$ 24,282 and NT$ 56,573 respectively.
Under different combinations of insurance expenditure share born by government and various percentage reduction of quantity purchase from the guaranteed price
program, equation (4) and (5) can be used to simulate the government expenditure and net revenue from rice crop production for each scenario. For the 10% reduction of quantity purchase from the guaranteed price program for instance, the revenue from the insurance program is the 90% purchase amount multiples the guaranteed price level. Similar procedure will be conducted for all other scenarios. All the results for net
treated as one insurance zone are presented in Table 4 and Table 5.
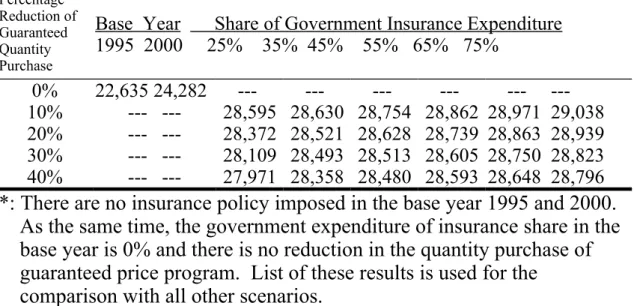
The results indicate that at specific percentage reduction of quantity purchase from guaranteed price program, net revenue of rice crop production is increasing while the loading of the insurance expenditure shared by government increases. On the other hand, under a specific burden of government insurance expenditure, net revenue of rice crop production decreases as the percentage reduction of quantity purchase from guaranteed price program increases.
Various scenarios reveal that net revenue of rice crop production and government expenditure are more efficient than that for either of the baseline year. For instance, the combination of 25% share of government insurance expenditure and 10% reduction of quantity purchase from guaranteed price program, net revenue is NT$ 28,595 per hectare. This amount is respectively 1.26 times and 1.18 times of the baseline year of 1995 and 2000. Similarly, government expenditure for this scenario is NT$ 59,624 per hectare and it is about 1.08 times and 1.05 times of the 1995 and 2000 baseline year respectively. However, the relative
Table 4 Net Revenue from Rice Production
-- Whole Country as One Insurance Zone
*Unit: NT $/hectare Percentage
Reduction of Guaranteed Quantity
Base Year Share of Government Insurance Expenditure 1995 2000 25% 35% 45% 55% 65% 75% Purchase 0% 22,635 24,282 --- --- --- --- ---10% --- --- 28,595 28,630 28,754 28,862 28,971 29,038 20% --- --- 28,372 28,521 28,628 28,739 28,863 28,939 30% --- --- 28,109 28,493 28,513 28,605 28,750 28,823 40% --- --- 27,971 28,358 28,480 28,593 28,648 28,796
*: There are no insurance policy imposed in the base year 1995 and 2000.
As the same time, the government expenditure of insurance share in the
base year is 0% and there is no reduction in the quantity purchase of
guaranteed price program. List of these results is used for the
Table 5 Government Expenditure
-- Whole Country as One Insurance Zone
*Unit: NT $/hectare Percentage
Reduction of Guaranteed Quantity
Base Year Share of Government Insurance Expenditure 1995 2000 25% 35% 45% 55% 65% 75% Purchase 0% 55,037 56,573 --- --- --- --- ---10% --- --- 59,624 59,793 59,807 59,964 60,058 60,156 20% --- --- 57,018 57,967 58,621 58,928 59,036 59,263 30% --- --- 55,411 55,630 55,733 55,831 55,918 56,895 40% --- --- 53,206 53,362 53,424 53,156 53,407 53,581
*: There are no insurance policy imposed in the base year 1995 and 2000.
As the same time, the government expenditure of insurance share in the
base year is 0% and there is no reduction in the quantity purchase of
guaranteed price program. List of these results is used for the
efficiency is shown by the higher share of net revenue of rice crop production to government expenditure. This indicates that the net revenue insurance program is a good alternative to improve the efficiency of government expenditure for increasing and stabilizing farm income for rice crop production farmers.
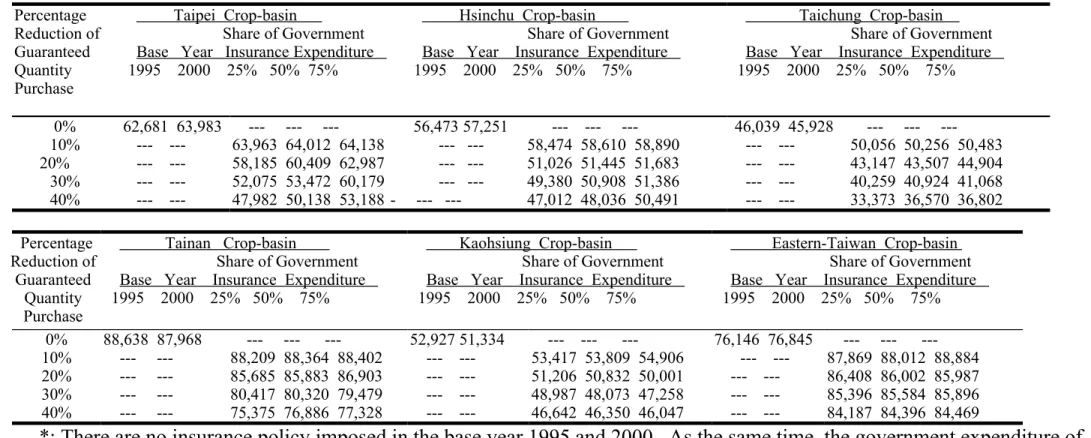
(3) Net Revenue of Rice Crop Production and Government Expenditure While Whole Country Divided as Six Crop-basins Insurance Zone
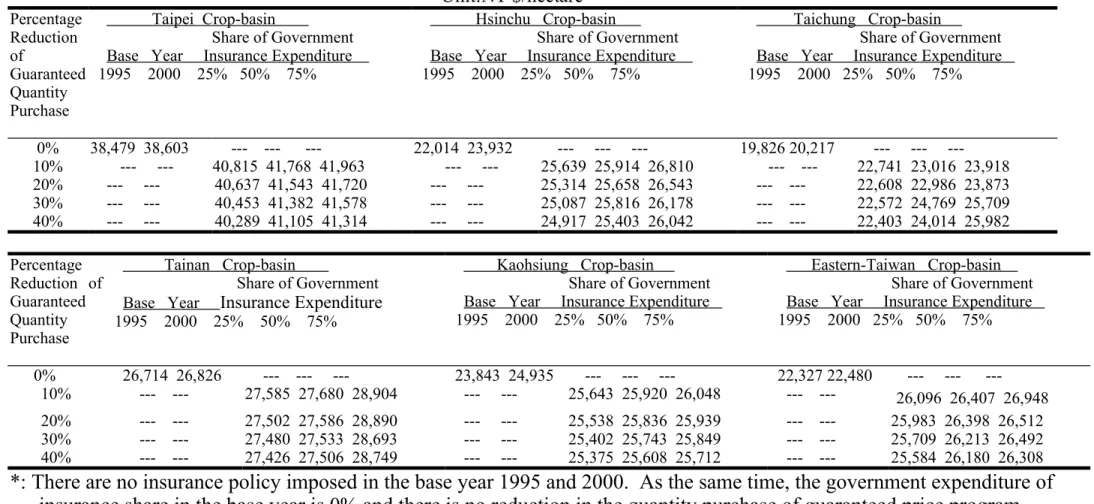
The revenue insurance can further be simulated by designing the whole country as six crop-basins. These are respectively Taipei, Hsinchu, Taichung, Tainan, Kaohsiung, and Eastern-Taiwan crop-basins and each crop-basin includes two to five surrounding counties and/or cities. According to equation (1), net revenues of rice crop production and government expenditure for all baselines of each crop-basins are computed and listed in Table 6 and Table 7. Base upon the baseline year of net revenue, the insurance premium for each crop-basin is calculated correspondingly. They are NT$ 785, NT$ 614, NT$ 1,156, NT$ 908, NT$ 1,209, and NT$ 1,593 per year respectively for Taipei, Hsinchu, Taichung, Tainan, Kaohsiung, and Eastern-Taiwan crop-basin.
The scenarios under crop-basin insurance zone have the similar design as those while whole country treated as one insurance zone except selecting larger and obvious percentage change of government insurance expenditure share. With 25% of government insurance expenditure share and 10% reduction of guaranteed quantity purchase, net revenue of rice crop production from the highest to the lowest crop-basin is Taipei, Tainan, Eastern-Taiwan, Kaohsiung, Hsinchu, and Taichung respectively. Furthermore, the highest government expenditure is in the Eastern-Taiwan crop-basin. This might be caused by the more frequent damage from
Table 6 Net Revenue of Rice Crop Production--Whole Country Divided as Six Crop-basin Insurance Zones*
Unit:NT $/hectare Percentage Reduction of Guaranteed Quantity Purchase Taipei Crop-basin Share of Government Base Year Insurance Expenditure 1995 2000 25% 50% 75%Hsinchu Crop-basin Share of Government Base Year Insurance Expenditure 1995 2000 25% 50% 75%
Taichung Crop-basin Share of Government Base Year Insurance Expenditure 1995 2000 25% 50% 75% 0% 38,479 38,603 --- --- --- 22,014 23,932 --- --- --- 19,826 20,217 ---10% --- --- 40,815 41,768 41,963 --- --- 25,639 25,914 26,810 --- --- 22,741 23,016 23,918 20% --- --- 40,637 41,543 41,720 --- --- 25,314 25,658 26,543 --- --- 22,608 22,986 23,873 30% --- --- 40,453 41,382 41,578 --- --- 25,087 25,816 26,178 --- --- 22,572 24,769 25,709 40% --- --- 40,289 41,105 41,314 --- --- 24,917 25,403 26,042 --- --- 22,403 24,014 25,982 Percentage Reduction of Guaranteed Quantity Purchase Tainan Crop-basin Share of Government Base Year Insurance Expenditure 1995 2000 25% 50% 75%
Kaohsiung Crop-basin Share of Government Base Year Insurance Expenditure 1995 2000 25% 50% 75%
Eastern-Taiwan Crop-basin Share of Government Base Year Insurance Expenditure 1995 2000 25% 50% 75% 0% 26,714 26,826 --- --- --- 23,843 24,935 --- --- --- 22,327 22,480 ---10% --- --- 27,585 27,680 28,904 --- --- 25,643 25,920 26,048 --- --- 26,096 26,407 26,948 20% --- --- 27,502 27,586 28,890 --- --- 25,538 25,836 25,939 --- --- 25,983 26,398 26,512 30% --- --- 27,480 27,533 28,693 --- --- 25,402 25,743 25,849 --- --- 25,709 26,213 26,492 40% --- --- 27,426 27,506 28,749 --- --- 25,375 25,608 25,712 --- --- 25,584 26,180 26,308
*: There are no insurance policy imposed in the base year 1995 and 2000. As the same time, the government expenditure of
insurance share in the base year is 0% and there is no reduction in the quantity purchase of guaranteed price program.
List of these results is used for the comparison with all other scenarios.
Table 7 Governmental Expenditure—Whole Country Divided as Six Crop-basin*
Unit:NT $/hectare Percentage Reduction of Guaranteed Quantity Purchase Taipei Crop-basin Share of Government Base Year Insurance Expenditure 1995 2000 25% 50% 75%Hsinchu Crop-basin Share of Government Base Year Insurance Expenditure 1995 2000 25% 50% 75%
Taichung Crop-basin Share of Government Base Year Insurance Expenditure 1995 2000 25% 50% 75% 0% 62,681 63,983 --- --- --- 56,473 57,251 --- --- --- 46,039 45,928 ---10% --- --- 63,963 64,012 64,138 --- --- 58,474 58,610 58,890 --- --- 50,056 50,256 50,483 20% --- --- 58,185 60,409 62,987 --- --- 51,026 51,445 51,683 --- --- 43,147 43,507 44,904 30% --- --- 52,075 53,472 60,179 --- --- 49,380 50,908 51,386 --- --- 40,259 40,924 41,068 40% --- --- 47,982 50,138 53,188 - --- --- 47,012 48,036 50,491 --- --- 33,373 36,570 36,802 Percentage Reduction of Guaranteed Quantity Purchase Tainan Crop-basin Share of Government Base Year Insurance Expenditure 1995 2000 25% 50% 75%
Kaohsiung Crop-basin Share of Government Base Year Insurance Expenditure 1995 2000 25% 50% 75%
Eastern-Taiwan Crop-basin Share of Government Base Year Insurance Expenditure 1995 2000 25% 50% 75% 0% 88,638 87,968 --- --- --- 52,927 51,334 --- --- --- 76,146 76,845 ---10% --- --- 88,209 88,364 88,402 --- --- 53,417 53,809 54,906 --- --- 87,869 88,012 88,884 20% --- --- 85,685 85,883 86,903 --- --- 51,206 50,832 50,001 --- --- 86,408 86,002 85,987 30% --- --- 80,417 80,320 79,479 --- --- 48,987 48,073 47,258 --- --- 85,396 85,584 85,896 40% --- --- 75,375 76,886 77,328 --- --- 46,642 46,350 46,047 --- --- 84,187 84,396 84,469
*: There are no insurance policy imposed in the base year 1995 and 2000. As the same time, the government expenditure of
insurance share in the base year is 0% and there is no reduction in the quantity purchase of guaranteed price program.
List of these results is used for the comparison with all other scenarios.
natural disasters in this area.
It is also observed that for most of the crop-basin the variation of net revenue of rice crop production under insurance scheme is insignificant. That is, the insurance scheme with function of stabilizing farm income can be considered for partially replacing the current guaranteed price program for rice production.
As comparing the net revenue of rice crop production with the government expenditure under different scenarios of this insurance scheme, the relative efficiency of this policy can be realized. For the combination of 25% government insurance expenditure share and 10% reduction of quantity purchase from the guaranteed price program, it is found that for all crop-basins every dollar spent by government through the insurance program will create higher net revenue for rice crop production. That is, remaining at current level of net revenue of rice crop production, support program with design of insurance scheme demands less government expenditure.
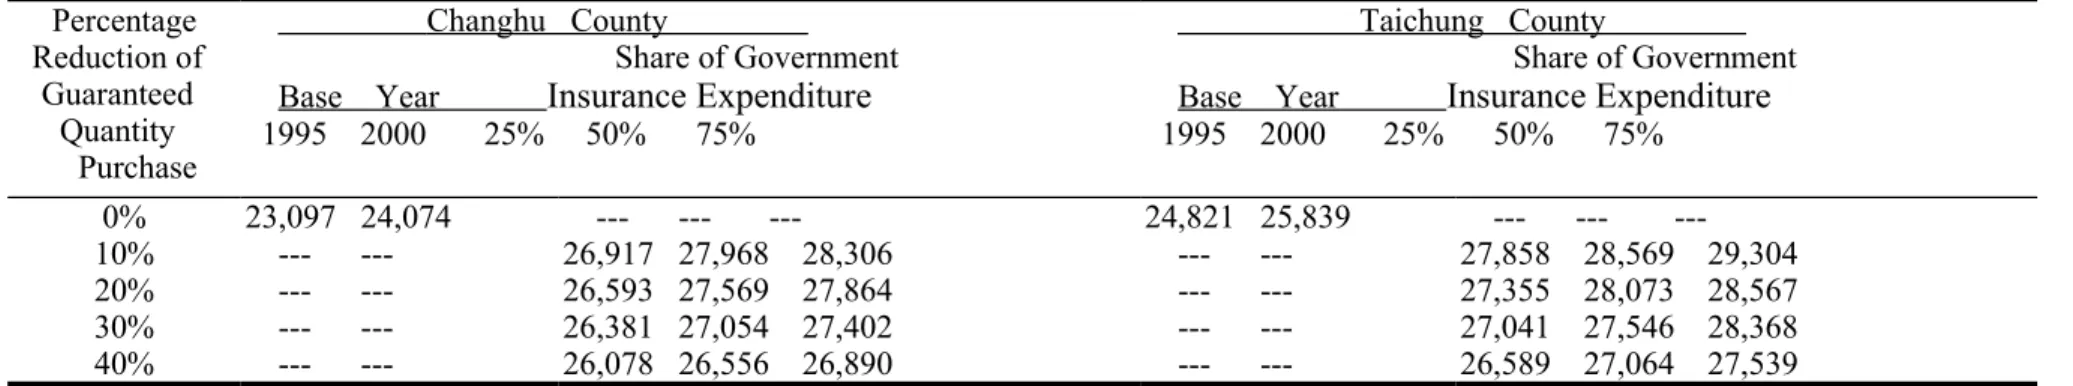
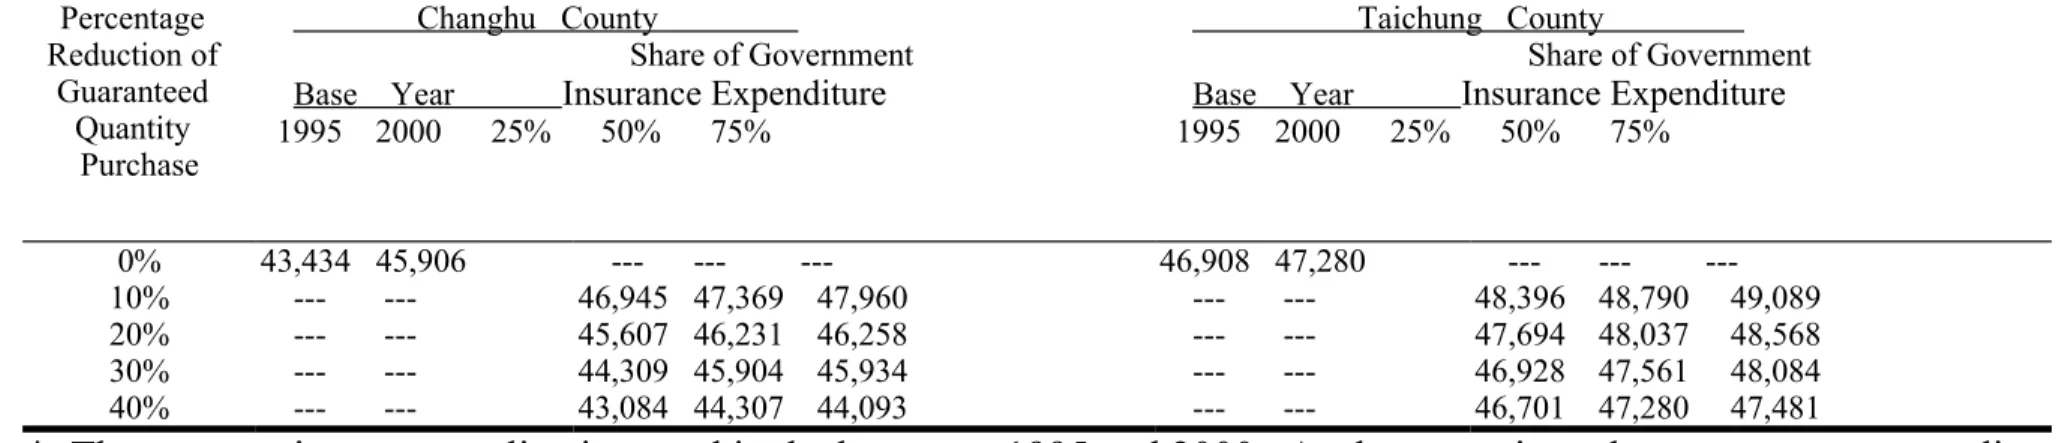
(4) Net Revenue of Rice Crop Production and Government Expenditure While Insurance Zones Designed for Major Rice Production County and City
County and city with the highest numbers of observations in the sample are selected specifically for further simulation to examine all the corresponding results analyzed above and to detect the role of insurance premium in these major rice production county and city. These are the counties of Changhua and Taichung. All the simulated results are presented in Table 8 and Table 9. It is observed that the insurance premiums for these two counties are NT$1,078 and NT$ 982 per year. Similarly, the relative efficiency in terms of government expenditure on rice crop production supports is higher with insurance scheme design than
Table 8 Net Revenue of Rice Crop Production-- Major Rice Crop Production County and City*
Unit:NT $/hectare Percentage Reduction of Guaranteed Quantity Purchase Changhu County Share of Government Base Year Insurance Expenditure 1995 2000 25% 50% 75%Taichung County Share of Government Base Year Insurance Expenditure 1995 2000 25% 50% 75% 0% 23,097 24,074 --- --- --- 24,821 25,839 ---10% --- --- 26,917 27,968 28,306 --- --- 27,858 28,569 29,304 20% --- --- 26,593 27,569 27,864 --- --- 27,355 28,073 28,567 30% --- --- 26,381 27,054 27,402 --- --- 27,041 27,546 28,368 40% --- --- 26,078 26,556 26,890 --- --- 26,589 27,064 27,539
*: There are no insurance policy imposed in the base year 1995 and 2000. As the same time, the government expenditure of
insurance share in the base year is 0% and there is no reduction in the quantity purchase of guaranteed price program.
List of these results is used for the comparison with all other scenarios.
Table 9 Government Expenditure -- Major Rice Crop Production County and City*
Unit:NT $/hectare Percentage Reduction of Guaranteed Quantity Purchase Changhu County Share of Government Base Year Insurance Expenditure 1995 2000 25% 50% 75%Taichung County Share of Government Base Year Insurance Expenditure 1995 2000 25% 50% 75% 0% 43,434 45,906 --- --- --- 46,908 47,280 ---10% --- --- 46,945 47,369 47,960 --- --- 48,396 48,790 49,089 20% --- --- 45,607 46,231 46,258 --- --- 47,694 48,037 48,568 30% --- --- 44,309 45,904 45,934 --- --- 46,928 47,561 48,084 40% --- --- 43,084 44,307 44,093 --- --- 46,701 47,280 47,481
*: There are no insurance policy imposed in the base year 1995 and 2000. As the same time, the government expenditure
insurance share in the base year is 0% and there is no reduction in the quantity purchase of guaranteed price program.
List of these results is used for the comparison with all other scenarios.
that purely from the guaranteed price program.
IV. Concluding Remarks
In order to perform in accordance with the requirements established in the WTO, aggregate domestic supports via guaranteed price or quantity purchase for crop production in general are compelled to adjust. Rice, as one of the major staple foods with the most numbers of farmers and taking the largest acreages involving in production, confronts the highest pressure from this adjustment. Maintaining and stabilizing net revenue from rice production is the crucial goal of this alteration. As such, direction of “income insurance and income security program” in the WTO agreement is chosen for this contemplation.
The revenue insurance scenarios are designed for different combination of the insurance premium shared by government, ranged between 25% and 75%, and reduction of guaranteed quantity purchases, ranged between 10% and 40%. For each scenario, we observe the change of net revenue of rice farmers and government expenditure as compared to the baseline year while whole country is managed as one insurance zone, whole country is divided as six crop-basins, and the insurance zones designed for major rice crop production counties and cities.
The results from the simulation analyses have shown that the net revenue from rice crop is remained at NT $28,000 per hectare annually while the whole country is designed as one insurance zone. The government expenditure is increasing with progressive increment share of the insurance expenditure but is decreasing as the guaranteed quantity purchase decline in any kind of the insurance zones design in this study
The results have further demonstrated that decrease of the guaranteed quantity purchase by 10% and with the share of 25% insurance expenditure for government is an effective design for rice crop revenue insurance. Moreover, with specific insurance expenditure share along with the decrease of guaranteed quantity purchase for
government, the change of net revenue for rice crop is within certain limit. This result illustrates that the rice crop revenue insurance policy has the function of stabilizing income for rice farmers.
References
Babcock, B. A. and D. A. Hennessy, 1996. “Input Demand under Yield and Revenue Insurance,” American Journal of Agricultural Economics. 78:416-27.
Barry, K. G. and A. P. Ker. 1998. “Revenue Insurance,” Choice. 42:24-27.
Calum, G. T., 1992. “An Economic Analysis of Alternative Farm Revenue Insurance Policies,” Canadian Journal of Agricultural Economics. 40:403-426.
Calum, G. T. and V. A. Boadu, 1989. “Evaluating Premiums for a Farm Income Insurance Policy,” Canadian Journal of Agricultural Economics. 37:233-247. Carl, H. N. and E. T. Loehman, 1987. “Further Toward a Theory of Agricultural
Insurance,” American Journal of Agricultural Economics. 3:523-531.
Chen, J.-C., 1995. “A Research on Insurance Premium for Rice Crop Damage in Taiwan,” Unpublished Master Thesis, Department of Agricultural Economics, National Chung-Hsing University. (In Chinese)
Cheng, H.-C., 1999. “An Economic Analysis of Rice Insurance in Taiwan,” Unpublished Master Thesis, Department of Agricultural Economics, National Chung-Hsing University. (In Chinese)
Council of Agriculture, 2000. Agricultural Statistics Yearbook. Taipei: Council of Agriculture. (In Chinese)
Hennessy, D. A., Bruce A. Babcock, and D. J. Hayes, 1997. “Budgetary and Producer Welfare Effects of Revenue,” American Journal of Agricultural Economics.
79:1024-1034.
Huang, W.-C., F.-L. Tung, R.-J. Hung, 2000. “A Feasibility Study of Implementing Agricultural Income Insurance Program in Taiwan,” Journal of the Land Bank of
Taiwan. 37(2): 189-207. (In Chinese)
Ph.D. Dissertation, Department of Agricultural Economics, National Chung-Hsiung University. (In Chinese)
Jerry, R. S., J. Harwood, A. Somward, and J. Perry, 1998. “The Potential for Revenue Insurance Policies in the South,” Journal of Agricultural and Applied Economics. 30:47-61.
Lee, H.-J., 1993. “A Survey on Rice Farmers Attitudes toward Joining Rice Crop Damage Insurance,” Agricultural Finance Review. 29: 243-303. (In Chinese)
Mario, J. M., 1991. “Area-Yield Crop Insurance Reconsidered,” American Journal of
Agricultural Economics. 73: 233-242.
Michael, S. K., 1989. “Farm Level Analysis of Agricultural Insurance: A Mathematical Programming Approach,” Agricultural Systems. 30: 235-244.
Stephen, E. M., K. H. Kahl, and P. J. Rathwell, 2000. “Revenue Insurance for Georgia and South Carolina Peaches,” Journal of Agricultural and Applied Economics. 32:123-132.
Syed, M. A., A. G. Ali, and N. J. Kurian, 1982. “Toward a Theory of Agricultural Insurance,” American Journal of Agricultural Economics. 64:520-529.
Tung, F.-L., 2000. “A Study on Recent Amendment of Agricultural Income Insurance Policy in Canada,” Agriculture Policy & Review. 92:55-59. (In Chinese)
Wu, P.-I. and K.-C. Lin, 2000. “Adjustment of Agricultural Subsidy System and Stabilization of Farm Income,” Council of Agriculture. No. 89 KG-1.6-C-61(2). Department of Agricultural Economics, National Taiwan University. (In