Vol. 37, No. 8, August 1999
Inverse Evaluation of Material Constants for Composite
Plates by Optical Interferometry Method
Chien-Ching Ma¤and Chan-Chiao Lin†
National Taiwan University, Taipei 10617, Taiwan, Republic of China
Electronic speckle pattern interferometry (ESPI) is a powerful tool for the full eld, noncontact, and real-time measurement method of surface displacements for deformed bodies. As compared with the conventional lm recording and optical reconstruction procedures used for holographic interferometry, the interferometric fringes of ESPI are produced instantlyby a video recording system. In this study,the amplitude uctuation ESPI (AF-ESPI) optical system is used for measuring the resonant frequencies and mode shapes of vibrating composite plates. By makinguse ofthe resonant frequencies for free plates obtainedexperimentally,an inverse evaluationfor the material constants is developed using the Rayleigh–Ritz technique and the Simplex method for function minimization. Finally, nite element calculation is used to construct the mode shapes from the obtained material constants by inverse evaluation, and the results are compared with the experimental observations. The experimental method based on optical AF-ESPI setup and the inverse algorithms proposed might become a reliable and self-consistent methodology for evaluating material constants of composite plates.
Nomenclature
A = vibration amplitude
Di j = laminate bending stiffness
IA = object light intensity
IB = reference light intensity
w = transverse displacement
µ = angle between object light and observation direction ¸ = wavelength of laser
½ = mass density
¿ = charge-coupleddevice refreshing time
Á = phase difference between object and reference light ! = vibration frequency
Introduction
H
OLOGRAPHIC interferometry opened new worlds of re-search by making possible accurate, global measurement of small dynamic surface displacements in a two-step process for a wide variety of objects. For this purpose, different methods of holo-graphic interferometry have been developed for vibration analysis, which have made possible the gathering of a large amount of prac-tical and theoreprac-tical information. Unfortunately,the slow and cum-bersome process of lm developmentlimits the applicationof holo-graphic vibration analysis in industry. Electronic speckle pattern interferometry (ESPI) was proposed1in the 1970s as a method of producing the interferogram without using traditional holographic technique.2The main difference between ESPI and holography is the interferometric image processing. The image data are digitized by video camera and digital signal processor for the ESPI method, which will eliminate the time-consuming chemical development and will speed up the process. Because the interferometricimage is recorded and updated by the video camera every 130s, ESPI is faster to operate and more insensitive to the environment than hologra-phy. However, this method cannot reach the high image quality of holographic interferometry due to the low resolution of the video camera system. For practical applications, these disadvantages are outweighed by the high sampling rate of the video camera. For these reasons, ESPI has become a powerful technique in academic research and engineering applications. Because ESPI uses video
Received 26 September 1998; revision received 5 February 1999; ac-cepted for publication 6 February 1999. Copyright c° 1999 by the American Institute of Aeronautics and Astronautics, Inc. All rights reserved.
¤Professor, Department of Mechanical Engineering. †Graduate Student, Department of Mechanical Engineering.
recording and display, it works in real time to measure dynamic displacement. Its real-time nature makes it possible to implement this technique for vibration measurement. The most widely used experimental setup to study vibration by ESPI is the time-averaged method.3The disadvantageof this method is that the interferometric fringes represent the amplitude but not the phase of the vibration. Løkberg and Hogmoen4 developed the phase-modulation method, which used the reference beam modulation technique to determine the relativephase of the vibrationobject. To reducethe noise coming from environment, the subtraction method was developed.5 ;6 The subtraction method differs from the time-averaged method in that the reference frame is rst recorded before vibration and continu-ously subtractedfromthe incoming frames after vibration.However, the interferometricfringe visibility of the subtraction method is not good enoughfor quantitativemeasurement.To increasethe visibility of the fringe pattern and to reduce the environmental noise simul-taneously, an amplitude- uctuation ESPI method was proposed by Wang et al.7 for out-of-plane vibration measurement. In the am-plitude uctuation ESPI (AF-ESPI) method, the reference frame is recorded in a vibrating state and subtracted from the incom-ing frame. Consequently, it combines the advantages of the time-averaged and subtraction methods, i.e., good visibility and noise reduction. Ma and Huang8and Huang and Ma9used the AF-ESPI method to investigate the three-dimensional vibrations of piezo-electric rectangular parallelepipeds and cylinders; both the reso-nant frequencies and mode shapes were presented and discussed in detail.
Modern engineering design requires the use of material in a way that optimizes their inherent properties. The general class of mate-rials that is most suitable for optimum design is composites. Com-posite materials are used in engineering structures for a variety of reasons, such as high speci c stiffness. Composite structural ele-ments are now used in a variety of components for automotive, aerospace, marine, and architectural structures, in addition to con-sumer products. Structures made of advanced composites, such as ber-reinforcedplastics, often consist of a number of layers having unidirectional bers. These layers, or laminas, will generally be or-thotropic.When orthotropiclaminas are stacked to form a laminate, the resulting structure is generally anisotropic. The laminate will be orthotropic only for certain stacking sequences. The microme-chanics is concerned with the mechanical behavior of constituent materials, the interaction of these constituents, and the resulting behavior of the basic composite. However, the macromechanics is concernedwith the gross mechanical behavior of composite materi-als and structureswithoutregardfor the constituentmaterimateri-alsor their interactions. This macromechanical behavior may be characterized
by averaged stresses and strains and effective mechanical properties in an equivalent homogeneous material.
The measurement of mechanical properties is an important el-ement of the quality control and quality assurance processes as-sociated with the manufacture of composite materials. Because of the special characteristics of composites, the measurement of stiff-nesses for composite materials is more dif cult than for isotropic measurement. This is mainly due to the number of independent coef cients to be determined and the coupling effects; it has been found that the mechanical test methods that are used for conven-tional metallic materials are usually not applicable to composites. Thus, the developmentand evaluationof new test methods for com-posites have been major challenges for the experimental mechanics community. In the general case, a thin symmetric composite plate is characterized by 12 independent parameters: 6 in-plane and 6 bending stiffnesses. Standard tests are available to determine these parameters,but several samplesare necessary,which lead these tests to be destructive. The American Society for Testing and Materials Standards D3039-76 and D4255-83 present static tensile and shear tests for determining the elastic constants of ber-reinforced com-posites. To obtain one set of constants, two tensile test specimens and one shear test specimen must be fabricated and tested. The dis-advantagesof these tests are that resultingstrainsmeasured by strain gauges occur at localized areas and that they are slow, expensive, and destructive tests.
If vibrations are induced in a composite plate, then its dynamic response will be a function of plate geometry, density, boundary conditions, and the elastic constants. This implies the possibility of using plate vibration theory to develop a non-destructive test to determine the dynamic elastic constants of a composite plate. Ref-erences 10 and 11 each presented a unique method for determining the elastic constants of an isotropic plate. Reference 12 reported a technique for determining the Poisson ratio of an orthotropic plate. The Rayleigh–Ritz or Galerkin techniques are often used to obtain approximate solutions for the mode shapes and natural frequencies. This approach has been investigated in many papers, in which the discussion is focused mainly on the iterative procedure providing elastic constants from plate vibration measurements and on the type of displacementfunctionsused. For instance,Deobald and Gibson13 determined elastic constants of orthotropic plates with boundary conditions consisting of clamped and free edges.
In this paper, we employ an optical method based on the AF-ESPI to study the resonant propertiesof composite plates. The advantage of using the AF-ESPI method is that resonant frequencies and the corresponding mode shapes can be obtained simultaneously from the experimental measurement. By making use of the resonant fre-quencies for free composite plates obtained experimentally, an in-verse evaluationfor the material constantsis investigated.Four elas-tic constants, namely, Ex, Ey, Gx y, and ºx y are determined, and
satisfactory results are obtained. Finally, nite element calculation is used to construct the mode shapes, and the results are compared with the experimental measurements. It is suggested that the exper-imental method based on the optical AF-ESPI setup and the inverse technique proposed in this study might become an applicable way to evaluate material constants for composite materials.
Theory of AF-ESPI Method for Out-of-Plane Vibration Measurement
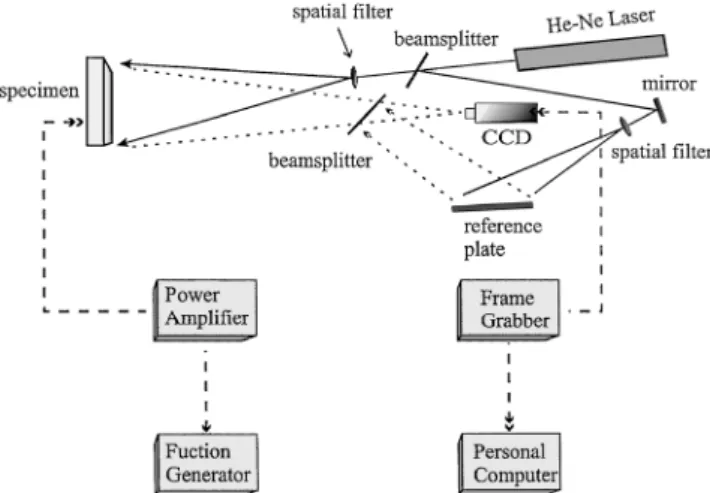
The optical arrangementof ESPI method for out-of-planevibrat-ing measurement is shown schematically in Fig. 1. If the image of the specimen is taken at the stress free state, the light intensity de-tected by a charge-coupleddevice (CCD) camera can be expressed by the time-averaged method as
I0D 1 ¿ ¿ 0 IAC IBC 2 IAIBcos Á dt D IAC IBC 2 IAIBcos Á (1)
Assuming the specimen vibrates at a resonant frequency,then the light intensity taken by a CCD camera can be represented as
Fig. 1 Schematic of ESPI setup for out-of-plane measurement.
I1D 1 ¿ ¿ 0 IAC IBC 2 IAIB £ cos Á C2¼
¸ .1C cos µ/A cos !t dt (2)
Let 0D .2¼=¸/.1C cosµ/ and assume ¿ D 2m¼=!, where m is an integer; then Eq. (2) can be expressed as
I1D IAC IBC 2 IAIB.cos Á/ J0.0 A/ .3/ When these two images (I0and I1) are subtracted and recti ed by the image processingsystem, i.e., Eq. (1) is subtractedfrom Eq. (3), the resulting image intensity can be expressed as
I D I1¡ I0D 2 IAIBj.cosÁ/[J0.0 A/¡ 1]j .4/ The light intensity of the image shown in Eq. (4) is called the
sub-traction method, and the reference image is recorded before loading
is applied.
Instead of using subtraction method, the AF-ESPI method is em-ployedin this studyby taking two imagesafter the specimenvibrates and assuming that the vibration amplitude of the second image has changed from A to AC 1A due to the instability of the apparatus. The light intensity of the second image will be
I2D 1 ¿
¿ 0
IAC IBC 2 IAIBcos[ÁC 0.A C 1A/ cos!t] dt
(5) Expand Eq. (5) by using a Taylor series and neglect higher-order terms; we then have
I2D IAC IBC 2 IAIB.cos Á/ 1¡1402.1 A/2 J0.0 A/ .6/ When these two images (I1and I2) are subtracted and recti ed by the image processingsystem, i.e., Eq. (3) is subtractedfrom Eq. (6), the resulting image intensity can be expressed as
I D I2¡ I1D p IAIB 2 .cos Á/0 2.1 A/2J 0.0 A/ .7/ Compared with the subtraction method where the reference im-age is taken at stress free state, the reference imim-age is recorded and subtracted at the vibrating state by the AF-ESPI method. From Eqs. (4) and (7), the dominant function of the AF-ESPI method is jJ0.0 A/j, and that of the subtraction method is jJ0.0 A/¡ 1j. Be-cause of the discrepancybetween the dominant functions,the nodal lines of vibrating interferometric patterns obtained by AF-ESPI method are the brightness lines and those by subtraction method are the darkness lines. This characteristic of the AF-ESPI method can be used as a qualitative observation or quantitative analysis for
the fringe patterns. Furthermore, the sensitivity and the fringe visi-bility of the AF-ESPI method are better than those of the subtraction method. It can be veri ed that the number of fringes presented by the AF- ESPI method is about twice that by the subtraction method under the assumption of the same vibration amplitude. In addition to the theory of out-of-plane measurement already mentioned, the in-plane vibration measurement by AF-ESPI method also can be derived in a similar way.8
Vibration of Composite Plates
For a symmetric laminate plate subjected to bending only, the laminate moment–curvature relationships are given by
Mx My Mx y D D11 D12 D16 D12 D22 D26 D16 D26 D66 kx ky kx y .8/
It is sometimes more convenient to use effective laminate engineer-ing constants rather than the laminate stiffnesses. These effective laminate engineering constants can be derived by using laminate compliances. The results are expressed by the following equations:
Ex D 12 det.D/ D22D66¡ D262 h3 (9) EyD 12 det.D/ D11D66¡ D216 h3 (10) Gx yD 12 det.D/ D11D22¡ D122 h3 (11) ºx yD D12D66¡ D16D26 D22D66¡ D226 (12)
where h is the laminate thickness and det.D/ is the determinant of the bending stiffness matrix. Although the laminate stiffness are meaningfulparametersfor all laminate con gurations,the engineer-ing constantsmay not be. The use of effectiveengineerengineer-ingconstants must be restricted to those cases where the deformationsare similar to the deformations associated with the engineering constant being used.
The partial differentialequation governing the transverse motion of a symmetrically laminated thin plate is
D11@ 4w @ x4 C 4D16 @4w @ x3@ y C 2.D12C D66/ @4w @ x2@ y2 C 4D26 @ 4w @ x@ y3 C D22 @4w @ y4 D ¡½h @2w @t2 (13)
For the orthotropicplate, we have D16D D26D 0: For free harmonic vibrations at frequency !, we can assume that
w.x; y; t/D W .x; y/ sin !t .14/ where W .x; y/ is the maximum de ection and can be represented as a linear series of assumed functions:
W .x; y/ D p m D 1 q n D 1 AmnXm.x/Yn.y/ .15/
The assumed functions Xm.x/ and Yn.y/ must be admissible, such
that they satisfy the essential boundary conditions of the plate. The characteristic equations of vibrating beams are used as the as-sumed functions Xmand Yn. The characteristicequations of
vibrat-ing beams are chosen so that the boundary conditions of the beam matches those of the plate, guaranteeingsatisfactionof the essential boundary conditions. The method of determining the set of charac-teristic functions and a summary of the propertiesof these functions were given by Young.14The characteristic functions X
m.x/ for the
free–free beam used in this study are given as follows:
Table 1 Material constants of the tested plates
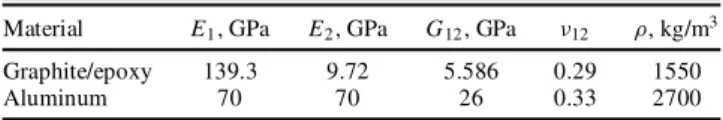
Material E1, GPa E2, GPa G12, GPa º12 ½, kg/m3
Graphite/epoxy 139.3 9.72 5.586 0.29 1550
Aluminum 70 70 26 0.33 2700
Table 2 Dimensions of the tested plates
Tested plate a, mm b, mm h, mm
Aluminum square plate 80 80 1
[0]16Square plate 99 99 2 [0]16Rectangular plate 99 52 2 [0=45=90=¡45]2s 102 102 2 Square plate [0=45=90=¡45]2s 102 51 2 Rectangular plate X1.x/D 1 X2.x/D p 3[1¡ .2x=`/] Xm.x/D cosh.cmx=`/C cos.cmx=`/ ¡ ®m[sinh.cmx=`/C sin.cmx=`/]; m D 3; 4; 5; : : :
where ` is the length of the beam. The numericalvaluesof cmand ®m
are given by Young.14The functions X
1.x/ and X2.x/ represent a rigid-bodytranslationand rotationand are included to obtain a com-plete orthogonalset. Similar expressionsalso are used for Yn.y/. By
using the stationarypotentialenergy theory, the Rayleigh–Ritz tech-nique will provide a discrete number of stationary values !s, which
are the lowest upper bounds of the actual natural frequencies.15 A T300/976 graphite/epoxy composite plate with stacking se-quence[0=45=90=¡45]2sand [0]16and an isotropicaluminum6061-T6 plate are used in this study. The material properties of the graphite/epoxy lamina and the aluminum are indicated in Table 1, where E1and E2are Young’s moduli in the longitudinaland trans-verse directions, respectively; G12is in-plane shear modulus; and º12is the Poisson’s ratio of the lamina. The averagingprocessis per-formed as follows: 1) Form the stiffness coef cients for the lamina; 2) use tensor transformation for each lamina to obtain transformed lamina stiffness matrice for different ber orientations;3) construct the laminate bending stiffness;and 4) nally determinethe effective laminate engineeringconstantsfrom Eqs. (9–12). The effectivelam-inate engineeringconstants for [0]16and [0=45=90=¡45]2slaminate plates are obtained from the material properties of lamina shown in Table 1, and the results for [0]16are
Ex D 139:3; EyD 9:72; Gx yD 5:586; ºx yD 0:29
and for [0=45=90=¡45]2sare
ExD 70:79; EyD 44:749
Gx yD 17:195; ºxyD 0:288
where Ex, Ey, and Gxy are in gigapascals. The dimensions of the
tested plates are shown in Table 2.
Experimental Setup and Inverse Evaluation of Material Constants
To increase the intensity of light re ection of the specimens and the contrast of fringe patterns, the surfaces of plates are coated with white paint, which is mixed with ne powder. The self-arranged AF-ESPI system, as shown in Fig. 1, is employed to perform the out-of-plane vibration measurement. A He–Ne laser with 30 mW and wavelength ¸D 632:8 nm is used as the coherent light source. The laser beam is divided into two parts, the reference and object beams, by a beamsplitter. The object beam travels to the specimen and then re ects to the CCD camera. The reference beam is directed to the CCD camera via the mirror and reference plate. Note that the optical path and light intensity of these two beams remain identical in the experimental setup. The plate is excited by the piezostack actuator (Physik Instrumente; 5£ 5 £ 10 mm), which is attachedto the specimen. The piezoelectric actuator is usually attached in the
center of the opposite face of the specimen. However, if the nodal lines pass the center of the specimen,then the piezoelectricactuator will be moved to other location. To achieve the sinusoidal output, a function generator HP33120A (Hewlett Packard) connected to a 4005 power ampli er (NF Electronic Instruments) is used.
A plate with all edges free is used to have the ideal boundary con-ditions for theoretical and experimental simulations. The resonant frequency and the correspondentmode shape for the vibrating plate are determined experimentally by using the noncontacting optical method of AF-FSPI. The rst few resonant frequencies determined experimentallyare used for inverse evaluation of the material prop-erties of the tested plate by the Rayleigh–Ritz technique and the Simplex method16for error function minimization. An error func-tion is introduced to quantify the difference between the inversed value and the experimental result:
E D N i D 1 !i¡ !expi !expi 2
where N is the total number of the resonant frequencies to be used for inversed calculation, !i is the reconstructed resonant frequency
obtained from the inversed value of material constants, and !expi is
the experimental measurement of resonant frequency by AF-ESPI. The material constants optimally searched must be such that the error function E is the global minimum value. The convergence criterion used for the Simplex algorithm is that the difference of the material constants obtained in the two iterations is less than 0.01%. After the material constants have been determined, a direct numerical calculation is performed by the nite element method to obtain the vibrating mode shapes. The numerical calculations are carried out by using the nite element packageABAQUS17in which a nine-node,two-dimensionalshell element (S9R5) and ve degrees of freedom at each node are selected to analyze the problem.
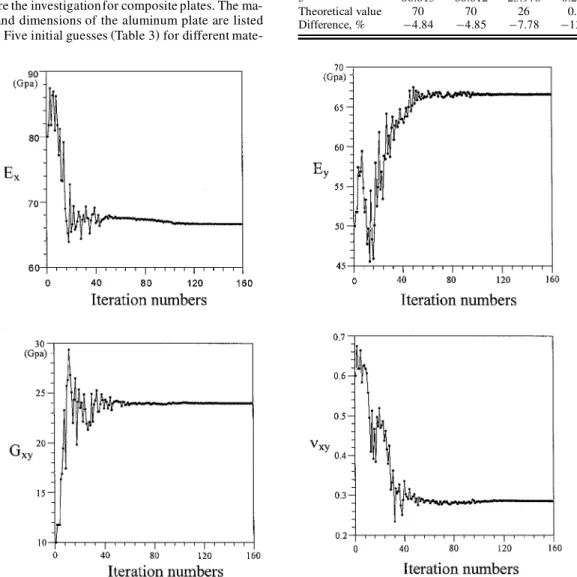
To test the analyzed procedure, an isotropic aluminum square plate is used before the investigationfor composite plates. The ma-terial properties and dimensions of the aluminum plate are listed in Tables 1 and 2. Five initial guesses (Table 3) for different
mate-Fig. 2 Iteration and convergence of material constants for the fth initial guess of the aluminum plate.
rial combinations are performed for the inverse calculations.These values are used in a Fortran program in which equations derived by the Rayleigh–Ritz technique are used to determine the reso-nant frequencies. The iteration procedure is performed by using the Simplex algorithms until convergence values of the material constants are obtained. The ve different initial guesses are con-verged to almost the same result, as indicated in Table 4. This shows the good convergence characteristics using the Simplex algorithm. The iteration numbers are from 90 to 175, which depend on the value of initial guess and the convergence criterion, and the CPU times are all within 10 s using a personal computer (Intel Pentium 133 MHz). The iteration and convergence of the material con-stants for the fth initial guess are shown in Fig. 2. The resonant
Table 3 Initial guesses of material constants for the aluminum plate
Initial guess E1, E2, G12,
number GPa GPa GPa º12
1 70 70 26 0.33
2 30 30 12 0.2
3 95 95 34 0.4
4 40 40 40 0.5
5 80 50 10 0.6
Table 4 Inverse evaluations of material constants for ve different initial guesses in Table 3 and the iteration number
E1, E2, G12, Iteration
Converge value GPa GPa GPa º12 number
1 66.614 66.605 23.979 0.2852 90 2 66.608 66.601 23.979 0.2854 129 3 66.620 66.613 23.977 0.2852 175 4 66.614 66.602 23.979 0.2854 121 5 66.613 66.612 23.978 0.2852 158 Theoretical value 70 70 26 0.33 —— Difference, % ¡4.84 ¡4.85 ¡7.78 ¡13.52 ——
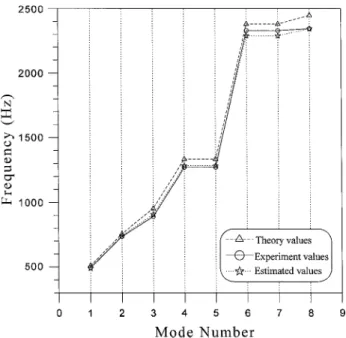
Fig. 3 First eight resonant frequencies from the experimental mea-surement and the calculated value for the aluminum plate.
Fig. 4 Plot of error functions for material constants Ex, Ey, Gxy, and ºxyfor [0]16composite plate.
frequencies for the experimental measurement and the calculated value from the inverse evaluation material constants are shown in Fig. 3. We can see that the inverse estimated values of the resonant frequencies agree very well with the experimental mea-sured results for the eight modes. This also shows the excel-lent reliability and convergence of the Simplex algorithms for inverse evaluations of the material constants by using resonant frequencies.
Before inverse evaluating the material constants for composite plates, we will discuss qualitatively the error of the resonant fre-quencies that are induced by each individualinversed material con-stant. The results for the [0]16composite plate are shown in Fig. 4, in which the nondimensionalparameter equal to 1 is the exact value. We can see clearly that a large variation of ºx yfrom the exact value
will cause only a very small error of resonant frequencies. This indicates that the parameter ºx y is insensitive to the resonant
fre-quencies, and we will expect that the inverse value of ºx y will not
have accuracy similar to Ex, Ey, and Gx y.
Finally, the composite square and rectangular plates with stack-ing sequence [0]16and [0=45=90=¡45]2s are investigated, and the
Table 5 Inverse evaluations of material constants for [0]16square
and rectangular composite plates
[0]16 Ex, GPa Ey, GPa Gx y, GPa ºx y
Theoretical value 139.3 9.72 5.586 0.29 Inverse value 134.58 9.322 5.454 0.334 (square plate) Difference, % ¡3.39 ¡4.09 ¡2.37 15.10 Inverse value 137.04 9.909 5.241 0.248 (rectangular plate) Difference, % ¡1.63 ¡1.94 ¡6.17 ¡14.6
Table 6 Inverse evaluations of material constants for [0/45/90/¡ 45]2ssquare and rectangular composite plates
[0=45=90=¡45]2s Ex, GPa Ey, GPa Gx y, GPa ºx y
Theoretical value 70.79 44.749 17.195 0.288 Inverse value 66.387 41.057 16.125 0.245 (square plate) Difference, % ¡6.22 ¡8.25 ¡6.22 ¡14.86 Inverse value 65.928 43.103 15.875 0.332 (rectangular plate) Difference, % 6.87 3.68 7.68 15.28
inverse evaluation of material constants based on the resonant fre-quencies obtained from experimental measurements are shown in Tables 5 and 6. The procedure for inverse evaluation of composite plates is the same as that used for the isotropic aluminum plate. The iteration and convergence characteristics are very similar to that of aluminum plate, and the CPU time for the inverse calculation is about 10 s using a personal computer. The difference of Ex, Ey,
and Gxy is below 6% for the [0]16plate and is below 8% for the [0=45=90=¡45]2splate, but the difference of ºx yis about 15% for
both the [0]16and [0=45=90=¡45]2s plates. The difference of ºx y
for the inverse value and the theoretical result is the largest one, as expected. The larger error in the ºx ymeasurement than that in Ex,
Ey, and Gxyis consistentwith the sensitivityof ºx ybeing the
small-est one. Note that the theoretical values are the effective laminate engineeringconstants,as discussedin the precedingsection.Hence, the differencebetween the inverse value and the theoretical result is mainly due to the errors inducedby measuringthe resonantfrequen-cies from the AF-ESPI technique,the accuracyof the Rayleigh–Ritz method, and the suitabilityof the methodfor determinationof the ef-fective laminate engineering constants from the material properties of the lamina. From the obtained inverse evaluation of the material constants, the rst eight mode shapes are computed by ABAQUS, and the resultsare comparedwith the experimentalobservationfrom AF-ESPI, as shown in Fig. 5. The vibratingdisplacementof the com-posite plate (solid lines) given by the numerical analysis is in the opposite direction to that with the dotted lines. The transition from solid lines to dotted lines corresponds to a zero displacement line, or a nodal line. The brightest fringes of the experimentalresults rep-resent the nodal lines of the vibrating plate at resonant frequencies. The rest of the fringes are contours of constant displacement. It can be seen that the mode shapes obtained experimentally are in good agreement with those obtained numerically.We can see from Fig. 5 that there is no mismatch or incorrect correlation of the experimen-tal and numerical mode shapes; hence, we have the con dence that the resonant frequencies determined in the experimental measure-ment are correct. Note that, if there are resonant frequencies that are either missing or are not in order in the experimental measure-ment, then large errors will be induced in evaluating the material constants. However, because we can obtain the resonant frequency and mode shape experimentally at the same time, the resonant fre-quency is used for the inversed evaluation of the material constants, and the correspondent mode shape can be used as a check of the result to ensure that the missing or the mismatch of the resonantfre-quency will not occur. The optical AF-ESPI measuring system and the inversed algorithms used provide a reliable and self-consistent methodology for evaluating the material constants of composite plates.
Fig. 5 First eight mode shapes for [0]16composite square plate obtained from the experimental observation and numerical calculation.
Conclusions
Investigation of the vibration problem by employing the ESPI method has the advantages of real-time and noncontact measurement, submicrometer sensitivity, digital image processing, etc. In this paper, a self-arranged AF-ESPI optical setup with good visibility and noise reduction has been established to obtain ex-perimentally the resonant frequencies and the corresponding mode shapes of plates at the same time. A computer program in which equations derived by the Rayleigh–Ritz technique is developed to determine the resonant frequencies of vibrations for composite plates with a tractionfree boundarycondition.The Simplex iteration algorithms are incorporated into the computer program for the in-verse evaluationof two Young’s moduli,the in-planeshear modulus, and a Poisson ratio for composite plates. The difference of Ex, Ey,
and Gx yis below 8%, and that of ºx yis below 15% when compared
with the predictedresults for the effectivelaminate engineeringcon-stants that are evaluated from the material properties of lamina. The differencebetween the inversevalue and the theoreticalpredictedre-sultsis mainly due to the errorsthatareinducedby measuringthe res-onant frequencies from the AF-ESPI technique,the accuracy of the Rayleigh–Ritz method,and the suitabilityof the method for determi-nation of the effective laminate engineeringconstants.The potential time savings and versatilityof the technique,combined with several promising results, indicate that the method warrants further
consid-eration. With continued development, this technique for obtaining material constants will become a valuable nondestructivetest.
Acknowledgment
The authors gratefully acknowledge the nancial support of this researchby the National Science Council (Republic of China) under Grant NSC 87-2212-E002-036.
References
1Rastogi, P. K., Holographic Interferometry, Springer–Verlag, Berlin
1994.
2Butters, J. N., and Leendertz, J. A., “Speckle Pattern and Holographic
Techniques in Engineering Metrology,” Optics Laser Technology, Vol. 3, No. 1, 1971, pp. 26–30.
3Jones, R., and Wykes, C., Holographicand Speckle Interferometry,
Cam-bridge Univ. Press, CamCam-bridge, England, UK, 1989, pp. 165–196.
4Løkberg, O. J., and Hogmoen, K., “Use of Modulated Reference Wave in
Electronic Speckle Pattern Interferometry,” Journal of Physics E: Scienti c
Instruments, Vol. 9, 1976, pp. 847–851.
5Creath, K., and Slettemoen, G. A., “Vibration-Observation Techniques
for Digital Speckle-Pattern Interferometry,” Journal of the Optical Society
of America A, Vol. 2, No. 10, 1985, pp. 1629–1636.
6Pouet, B., Chatters, T., and Krishnaswamy, S., “Synchronized
Refer-ence Updating Technique for Electronic Speckle Interferometry,” Journal of
7Wang, W. C., Hwang, C. H., and Lin, S. Y., “Vibration Measurement
by the Time-Averaged Electronic Speckle Pattern Interferometry Methods,”
Applied Optics, Vol. 35, No. 22, 1996, pp. 4502–4509.
8Ma, C. C., and Huang, C. H., “The Investigation of Three-Dimensional
Vibration for Piezoelectric Rectangular Parallelepipeds by Using the AF-ESPI Method,” International Journal of Solids and Structures (submit-ted for publication).
9Huang, C. H., and Ma, C. C., “Vibration Characteristics for Piezoelectric
Cylinders Using Amplitude-FluctuationElectronic Speckle Pattern Interfer-ometry,” AIAA Journal, Vol. 36, No. 12, 1998, pp. 2262–2268.
10Zelenev, Y. V., and Electrova, L. M., “Determination of the Dynamic
Parameters of Polymer Plates,” Soviet Physics—Acoustics, Vol. 18, No. 3, 1973, pp. 339–341.
11Wolf, J. A., and Carne, T. G., “Identi cation of the Elastic Constants for
Composites Using Modal Analysis,” Society for Experimental Stress Ana-lysis, Paper A-48, San Francisco, CA, 1979.
12Caldersmith, G., and Rossing,T. D., “Determination of Modal Coupling
in Vibrating Rectangular Plates,” Applied Acoustics, Vol. 17, No. 1, 1984, pp. 33–44.
13Deobald, L. R., and Gibson, R. F., “Determination of Elastic Constants
of Orthotropic Plates by a Modal Analysis/Rayleigh–Ritz Technique,”
Jour-nal of Sound and Vibration, Vol. 124, No. 2, 1988, pp. 269–283.
14Young, D., “Vibration of Rectangular Plates by the Ritz Method,” Jour-nal of Applied Mechanics, Vol. 17, No. 4, 1950, pp. 448–453.
15Leissa, A. W., “The Free Vibration of Rectangular Plates,” Journal of Sound and Vibration, Vol. 31, No. 3, 1973, pp. 257–293.
16Nelder, J. A., and Mead, R., “A Simplex Method for Function
Mini-mization,” Computer Journal, Vol. 7, 1965, pp. 308–313.
17“ABAQUS User’s Manual,” Version 5.5, Hibbit, Karlsson, and
Soren-sen, Inc., Pawtucket, RI, 1995.
A. Berman
![Fig. 5 First eight mode shapes for [0] 16 composite square plate obtained from the experimental observation and numerical calculation.](https://thumb-ap.123doks.com/thumbv2/9libinfo/8849447.241592/6.837.137.710.68.754/shapes-composite-square-obtained-experimental-observation-numerical-calculation.webp)
