行政院國家科學委員會補助專題研究計畫成果報告
※ ※※※※※※※※※※※※※※※※※※※※※※※
※
※
※
※ 高階主管酬勞的經濟性決定因素: ※
※ 台灣與美國的實證分析
※
※
※
※ ※※※※※※※※※※※※※※※※※※※※※※※
※
計畫類別:■個別型計畫
□整合型計畫
計畫編號:NSC 89-2416-H-004-100-
執行期間: 89 年 08 月 01 日至 90 年 07 月 31 日
計畫主持人:張清福 助理教授
共同主持人:歐進士 教授
李佳玲 助理教授
本成果報告包括以下應繳交之附件:
□赴國外出差或研習心得報告一份
□赴大陸地區出差或研習心得報告一份
□出席國際學術會議心得報告及發表之論文各一份
□國際合作研究計畫國外研究報告書一份
執行單位:國立政治大學會計學系
國立中正大學會計學系
3
行政院國家科學委員會專題研究計畫成果報告
高階主管酬勞的經濟性決定因素:台灣與美國的實證分析
Economic Deter minants of Executive Compensation:
Evidence fr om Taiwan and USA
計畫編號:NSC 89-2416-H-004-100-
執行期限:89 年 0801 日至 90 年 07 月 31 日
主持人:張清福 助理教授 國立政治大學會計學系
共同主持人:歐進士 教授 國立中正大學會計學系
李佳玲 助理教授 國立中正大學會計學系
計畫參與人員:王婉茲、江佳明、綦小霈、韓幸紋
1、中文摘要 高階主管(CEO)獎酬的決定因素有 很多,包括經濟性及非經濟性決定因素, 諸如經營績效、公司規模、公司成長、企 業風險、董監持股、以及股權結構等。本 研究採用 Partial Least Squares(PLS)方法 來探討高階主管獎酬的經濟性決定因素, 以克服傳統迴歸方法在本文所面臨的限 制:1.同時存在兩個以上的因變數;2.自變 數間有複共線性;3.模型含方程組而非單 一方程式 4.變數為抽象性的隱變數(latent variable ) 而 非 顯 變 數 ( observable variable);5. 資料分佈不符合迴歸殘差項 的假設要求;6. 樣本小變數多。 “高階主管”一詞在國外文獻中大都 指負責決策的執行長(CEO),然而在台 灣企業中並無執行長一職,而總經理也未 必握有實際決策之權。唯一可以確認的是 企業必然有“董事長”與“總經理”兩種 職稱,而兩者之一應負有決策之權。本文 據此進行研究,在控制公司成長、公司規 模、企業風險、董監持股、股權結構及產 業競爭因素之後,發現同時有“董事長” 及“常董兼總經理”兩種職位的公司與同 時有“董事長”及“總經理”兩種職位的 公司,高階主管的獎酬並不受企業經營績 效的影響;然而,同時有“董事長”及“常 董兼總經理”兩種職位的公司,高階主管 的獎酬則顯著地受到企業經營績效的影 響。美國企業高階主管的獎酬亦充分反應 了企業經營的績效。這項發現與過去的文 獻有很大不同,但卻強烈支持代理理論的 論點。 關鍵詞:高階主管獎酬、公司績效、公司規 模、公司成長、企業風險、產業競爭、董 監持股、股權結構 Abstr actThis study investigates the economic determinants of executive compensation with the control of other factors including firm size, growth, business risk, board ownership, and ownership structure. The partial least squares (PLS) approach, as an alternative method specified in the proposal, is applied to address the issue, which overcomes the problems in this study faced by the traditional regression approach: (1) two dependent variables (2) multicollinearity (3) a set of equations in the model (4) latent variables (5) small sample and large number of variables and (6) free of distribution assumption.
The issue of executive compensation concerns with the CEO as a focus but it couldn’t be easily identified in Taiwan’s enterprises. By applying PLS approach this study found that the executive compensation of firms with both titles of president and managing director and firms with titles of president and manager is not linked to firm
performance while firms with titles of president and managing director is significantly associated with firm performance. As for US firms, the executive compensation is significantly correlated with firm performance though all other control variables are insignificant. This finding provides strong evidence supporting the argument of agency theory.
The PLS approach applied in this study is quite unique in executive compensation research. It would contribute to the field as an application illustration.
Keywor ds: Partial Least Squares, Executive
Compensation, Performance, Firm Size, Growth, Risk, Board, Ownership
2、Intr oduction
Agency theory contends that optimal compensation contracts reduce potential agency problem in firm organization. The theory in turn implies that firms will design contracts to reward and induce managers’ incentive to achieve firm performance. In such a circumstance, the firm performance measures such as net income, sales, roa, roe, and ret can be regarded as economic determinants of executive compensation. If the agency theory holds, a positive relationship between firm performance and executive compensation should be evidenced. However, since 1980 researchers have found weak evidence of agency theory while several control variables are significantly correlated with compensation, Ciscel and Carroll (1980) and Jensen and Murphy (1990) are noteworthy among others.
The proceeding findings are primarily based on traditional regression analysis. The regression analysis deals with only the observable variables other than latent concepts or constructs. A construct is measured by several observable indicators. On the contrary, an observable indicator cannot be a sufficient measure of a latent construct. The relationship among constructs is the primary interest of research other than that among observable variables. The relationship among observable variables cannot be sufficient description for the relationship among latent constructs. To articulate the preceding arguments, let’s look at an example. Financial analysts performing financial statement analysis usually crossly refer to several ratios to come to a conclusion, say, on a firm’s profitability or solvency. How can we just pick up one observable variable such as sales or net income to conclude a firm’s performance? Both of them should be important information for measuring the firm’s performance. This argument leads to the superiority of latent construct model such as partial least squares approach over traditional regression analysis. Based on this concept, this study applies an alternative method, partial least squares approach, to address this issue. Based on both evidences from Taiwan and the US shows that executive compensation is significantly correlated with firm performance though all other control variables are insignificant. This finding provides strong evidence supporting the argument of agency theory.
5
3. Liter atur e Review
Researchers investigating the relationship between compensation and the economic determinants or firm performance usually control other factors which will be considered in this study are firm size, growth, business, board ownership, and ownership structure. The relationship between executive compensation and these constructs the will be elaborated below.
3.1 Per for mance and Compensation
Agency theory argues that managers are self-interested and compensation serves as a incentive mechanism to align the interest of executive and shareholders (Fama and Jensen 1983; Jensen and Meckling 1976). However, since 1980 researchers using a variety of datasets, variables, methods, and models have found weak or even insignificant evidence of agency theory (Ciscel and Carroll 1980; Jensen and Murphy 1990; Boyd 1994) are noteworthy among others. This would be the focus of this study by applying an partial least squares approach.
3.2 Industr y Competition and Compensation
Agrawal and Knoeber (1998) shows that industry competition reduces managers’ compensation. The competition effect reduces CEO's salary and bonus on average by $22,800 - 211,600 as an increase in the threat of takeover from the first to the third quartile of the sample. Aggarwal and Samwick (1999) show that compensation is
positively sensitive to rival firm performance that is a increasing function of industry competition.
3.3 Boar d Owner ship, Owner ship Str uctur e and Compensation
Core, Holthausen and Larcker (1999) contend that the board and ownership structure signaling the effectiveness of governance structure and therefore related to the compensation. After controlling for standard economic determinants of pay, they show that measures of board and ownership structure significantly correlated with CEO compensation.
3.4 Gr owth and Compensation
Smith and Watts (1992) show that high growth firms tends to adopt stock-based compensation plan while Gaver and Gaver (1992) find that high growth firms pay higher cash compensation and adopt more stock options incentive plan than lower growth firms. Using proprietary compensation data, Bushman, Indjejikian, and Smith (1996) shows that individual performance evaluation increases with growth opportunities and product time horizon. Smith and Watts (1992) document that firms with more growth options, i.e., greater access to positive net present value projects, have higher executive compensation, and greater use of stock-option and bonus plans.
3.5 Fir m Size and Compensation
Ciscel and Carroll (1980) argue that the size effect dominates the relationship between executive compensation and performance. Jensen and Murphy (1990) find that the size effect is inversely related to the pay-performance sensitivity. Schaefer (1998)
document the dependence of
pay-performance sensitivity on the size of the firm. Banker and Hall (1998) also find the size effect on the relationship between compensation and performance.
3.6 Business Risk and Compensation
Agrawal and Knoeber (1998) show that the risk effect makes managers' implicitly deferred compensation and firm-specific human capital less secure and in turn induces increase in compensation.
4. Sample
This study contains two samples. The Taiwan sample is drawn from Executive Compensation database and Financial Report database of Taiwan Economic Journal (TEJ). The US sample comes from ExecuComp and Research Insight database of Standard & Poor’s. The listwise deletion is applied to sampling procedure. That is, the firms in each sample should have nonmissing data for all variables. All subsamples exclude financial industry, the year-observations with the president or manager turnover, and the sum of salary and bonus equal zero. As shown in Table 3, Table 4 and Table 5, the Taiwan sample is composed of three
subsamples grouped by executive titles. These three subsamples contain 17, 90, and 17 firms, separately. The US sample has 213 firms.
5. Methodology
As with Ittner, Larcker and Rajan (1997), this study uses partial least squares (PLS) approach to address the issue. Partial Least Squares (PLS) can be a powerful method of analysis because of the minimal demands on measurement scales, sample size, and residual distributions. Sample size can be very small. An extreme example is given by Wold (1989) who analyzed 27 variables using two latent constructs with a data set consisting of ten cases. The description of PLS can be found in Chin and Newsted (1999).
The models specifying the relationship between constructs are depicted in Figure 1 and Figure 2 for Taiwan sample and US sample, respectively. The indicators (or measures) of each construct are summarized in Table 1 for Taiwan sample and Table 2 for US sample. Since the sample sizes are small the bootstrap resampling method is used.
6. Results
This study uses partial least squares approach to examine the economic determinants of executive compensation. The issue of executive compensation concerns with the CEO as a focus but it couldn’t be easily identified in Taiwan’s enterprises. Table 6A, Table 7A, Table 8A, and Table 9A relate the endogenous and exogenous
7
constructs. Table 6B, Table 7B, Table 8B, and Table 9B describe the correlations of latent constructs. Table 6C, Table 7C, Table 8C, and Table 9C depict the relationship between latent constructs and observable variables. As shown in Table 6A, Table 7A, and Table 8A, with the control of industry competition, board ownership, ownership structure, firm size, business risk, and growth for Taiwan subsamples, the latent construct of economic determinants, i.e., firm performance, is insignificantly correlated with executive compensation for firms having both titles of president and managing director and firms having titles of president and general manager, but significant with compensation for firms with both titles of president and director-manager. As for US firms, shown in Table 9A, the executive compensation is significantly correlated with firm performance though all other control variables are insignificant. This evidence strongly supports the wisdom of agency theory that executive compensation serves as a mechanism reducing agency problem.
7. Self-Evaluation
As mentioned in the proposal, structural equation modeling like LISREL will be the first choice to apply in this study while the partial least squares (PLS) approach as a backup since the latter is not popular in Taiwan. However, a study with large number of variables and very small sample doesn’t fulfill the assumption of LISREL. This study therefore uses the distribution-free and small sample research technique of PLS. It seems an introduction of partial least squares
approach to our academic community.
This study tries to apply an approach alternative to the traditional regression to address the economic determinants of executive compensation. The results are different from previous research but confirm with the wisdom of agency theory. Therefore this study would be very interesting to the field and journal editors if the results can be carefully articulated before article submission.
8. Refer ences
[1] Agrawal, A. and C. R. Knoeber, 1998.
Managerial compensation and the threat of takeover. Journal of Financial Economics 47 (2): 219-239.
[2] Aggarwal, R. K. and A. A. Samwick,
1999. Executive compensation, strategic competition, and relative performance evaluation: Theory and evidence.
Journal of Finance 54 (6): 1999-2043.
[3] Baker, G. P. and B. J. Hall, 1998. CEO Incentives and Firm Size, NBER Working Paper, National Bureau of Economic Research.
[4] Boyd, B. K., 1994. Board control and
CEO compensation. Strategic
Management Journal 15: 335-344.
[5] Bushman, R. M., R. J. Indjejikian, and A. Smith, 1996. CEO compensation: The role of individual performance evaluation. Journal of Accounting and Economics 21 (3): 161-193.
[6] Chin, W. W. and P. R. Newsted, 1999. Structural equation modeling analysis with small samples using partial least squares. In Statistical Strategy for Small Sample Research, edited by R. H. Hoyle,
Thousand Oaks, CA: Sage Publications.
[7] Ciscel, D. H. and T. M. Carroll, 1980.
The Determinants of Executive Salaries: An Econometric Survey. Review of Economics and Statistics 62 (1): 7-13.
[8] Core, J. E., R. W. Holthausen, and D. F. Larcker, 1999. Corporate governance, chief executive officer compensation, and firm performance. Journal of Financial Economics 51: 371-406.
[9] Fama, E. F. and M. C. Jensen, 1983. Separation of ownership and control. Journal of Law and Economic 26: 301-325.
[10] Gaver, J. J. and K. M. Gaver, 1992. Additional evidence on the association between the investment opportunity set and corporate financing, dividend and compensation policies. Journal of Accounting and Economics 16: 125-60.
[11] Hemmer, T., 1993. Risk-free incentive
contracts: Eliminating agency cost using option-based compensation schemes.
Journal of Accounting and Economics
16 (4): 447-473.
[12] Ittner, C. D., D. F. Larcker, and M. V. Rajan, 1997. The choice of performance measure in annual bonus contracts.
Accounting Review 72 (2): 231-155.
[13] Jensen, M. C. and W. H. Meckling, 1976. Theory of the firm: Managerial behavior-agency cost and ownership structure. Journal of Financial and Economic 3: 305-60.
[14] Jensen, M. C. and K. J. Murphy, 1990. Performance Pay and Top-Management Incentives. Journal of Political Economy
98 (2): 225-264.
[15] Lohmoller, J. B. 1989. Latent Variable
Path Modeling with Partial Least
Squares. New York: NY:
Springer-Verlag.
[16] Schaefer, S., 1998. The dependence of
pay-performance sensitivity on the size of the firm. The Review of Economics and Statistics 80(3): 436-443.
[17] Smith, C. W. Jr. and R. L. Watts, 1992.
The investment opportunity set and corporate financing, dividend, and compensation policies. Journal of Financial Economics 32 (3): 263-292.
Table 1
Constructs and Indicators for Taiwan Firms Compensation
C_TCC2: total cash compensation for the title of “president” (董事長)
C_TCC3: total cash compensation for the title of “managing director” (常董兼總經理) C_TCC4: total cash compensation for the title of ““director-manager” (董事兼總經
理)
C_TCC5: total cash compensation for the title of “general manager” (總經理) C_TCCC2: change in total cash compensation for the title of “president” (董事長) C_TCCC3: change in total cash compensation for the title “managing director” (常董
兼總經理)
C_TCCC4: change in total cash compensation for the title “director-manager” (董事兼 總經理)
C_TCCC5: change in total cash compensation for the title of “general manager” (總經 理)
Performance
P_NI: net income
P_NIBEX: income before extraordinary items P_sales: sales
Competition
A5_hhiavg: Herfindahl-Hirschman Index (HHI) average over 5 years A5_hhisqrtavg: square root of Herfindahl-Hirschman Index (HHI) average over 5
years
A5_top3avg: sum of top three sales divided by total industry sales A5_top4avg: sum of top four sales divided by total industry sales Board Ownership
A2_BLOCK: ownership of blockholders A2_DRCTR: ownership of directors A2_MANAG: ownership of managers Ownership Structure
A3_CORPO: ownership of corporate-investors A3_FINAN: ownership of financial-institute-investors A3_GOVER: ownership of government-investors A3_INDIV: ownership of individual-investors A3_MUTUA: ownership of mutual-fund-investors
11
Table 1 (cont’d)
Constructs and Indicators for Taiwan Firms Growth
G_MBE: market to book ratio G_SALES: growth of net sales G_TA: growth of total assets Firm Size
S_LNS: natural logarithm of sales
S_LNTA: natural logarithm of total assets Business Risk
R_RETCV: coefficient of variation of the change in stock return R_RETSTD: standard deviation of the change in stock return R_ROACV: coefficient of variation of return on assets
R_ROASTD: standard deviation of return on assets R_ROECV: coefficient of variation of return on equity R_ROESTD: standard deviation of return on equity
Table 2
Constructs and Indicators for US Firms Compensation
C_SALARY: salary C_BONUS: bonus
C_LTIP: long term incentive plan C_ALLOTH: all other compensation C_RSKTHL: restricted stock holdings value C_OTHANN: all other annual compensation C_BLKV: stock options granted total value C_RSTKGR: restricted stock value granted C_SOPTVA: stock options value granted C_SALARY: change in salary
C_TCCCH: change in total cash compensation C_TDC1CH: change in total compensation
C_ALLOTHTOCH: change in all other compensation C_SALARYPCT: percentage change in salary
C_TCCPCT: percentage change in total cash compensation C_TDC1PCT: percentage change in total compensation
C_ALLOTHTOPCT: percentage change in all other compensation Performance
P_SALES: sales P_NI: net income
P_NIBEX: income before extraordinary items P_SALESCH: change in sales
P_NICH: change in net income
P_NIBEXCH: percentage change in income before extraordinary items P_ROA: return on assets
P_ROE: return on equity P_RET: stock return
P_ROACH: change in return on assets P_ROECH: change in return on equity P_RETCH: change in stock return
P_ROAPCT: percentage change in return on assets P_ROEPCT: percentage change in return on equity P_RETPCT: percentage change in stock return
13
Table 2 (cont’d)
Constructs and Indicators for US Firms Growth
G_ASSETS: growth in assets G_SALES: growth in sales G_MBE: market to book ratio Firm Size
S_LNASSETS: log of assets S_LNSALES: log of sales Business Risk
R_ROASTD: Standard Deviation of ROA R_ROESTD: Standard Deviation of ROE R_RETSTD: Standard Deviation of RET R_ROACV: Coefficient of Variation of ROA R_ROECV: Coefficient of Variation of ROE R_RETCV: Coefficient of Variation of RET
Table 3
Taiwan Subsample 1: Firms with Both Title of President and Managing Director
Four-Digit SIC Code Industry Firm Number
1100 Cement 2
1300 Plastics 1
1400 Textiles 6
1600 Elec. Appliance & Cable 2
1900 Paper & Pulp 2
2100 Rubber 1
2300 Electronics 2
2600 Transportation 1
Total 17
Table 4
Taiwan Subsample 2: Firms with Both Title of President and Director-Manager
Four-Digit SIC Code Industry Firm Number
1100 Cement 2
1200 Foods 7
1300 Plastics 8
1400 Textiles 15
1500 Electric & Machinery 5
1600 Elec. Appliance & Cable 4
1700 Chemicals 6
1800 Glass & Ceramics 2
1900 Paper & Pulp 1
2000 Steel & Iron 7
2100 Rubber 3 2200 Automobie 1 2300 Electronics 19 2400 Electronics 1 2500 Construction 8 2600 Transportation 1 Total 90
15
Table 5
Taiwan Subsample 3: Firms with Both Title of President and General Manager
Four-Digit SIC Code Industry Firm Number
1100 Cement 1
1300 Plastics 1
1400 Textiles 2
1500 Electric & Machinery 1
1600 Elec. Appliance & Cable 1
1700 Chemicals 3
1800 Glass & Ceramics 1
2300 Electronics 2
2500 Construction 5
Total 17
Table 6A
Path Coefficients (N=17)
Taiwan Subsample 1: Firms with Both Title of President and Managing Director Compete Perf Board Ownershi Size Risk Growth Comp -0.0540 0.8250 -0.0040 0.7420 -0.7430 -0.1910 0.2640
(0.4616) (1.1582) (0.6482) (0.7562) (0.8143) (0.6010) (0.7106) Standard errors are in parenthesis.
Table 6B
Correlations of latent variables
Taiwan Subsample 1: Firms with Both Title of President and Managing Director
Compete Perf Board Ownershi Size Risk Growth Comp Compete 1.000 Perf -0.233 1.000 Board 0.309 -0.065 1.000 Ownershi -0.209 0.500 -0.039 1.000 Size -0.304 0.679 0.146 0.706 1.000 Risk -0.118 0.639 0.129 0.568 0.451 1.000 Growth -0.134 0.755 0.111 0.264 0.474 0.632 1.000 Comp -0.189 0.782 -0.207 0.603 0.396 0.595 0.617 1.000 Table 6C Outer Model Loadings
Taiwan Subsample 1: Firms with Both Title of President and Managing Director Entire Mean of Standard t-Statistic
Sample Subsamples Error Estimate Compete : A5_hhiav 0.9359 0.7529 0.6063 1.5436 A5_hhisq 0.9847 0.7702 0.6158 1.5989 A5_top3a 0.9901 0.7742 0.6148 1.6104 A5_top4a 0.9734 0.7685 0.6094 1.5974 Perf : P_NI 0.9800 0.8959 0.3155 3.1057 P_NIBEX 0.8881 0.7712 0.3652 2.4318 P_SALES 0.8525 0.8045 0.2855 2.9856
17
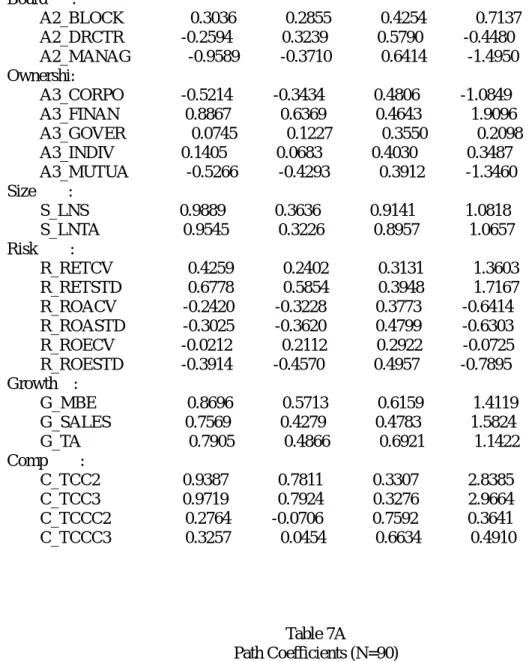
Table 6C (cont’d) Outer Model Loadings
Taiwan Subsample 1: Firms with Both Title of President and Managing Director Board : A2_BLOCK 0.3036 0.2855 0.4254 0.7137 A2_DRCTR -0.2594 0.3239 0.5790 -0.4480 A2_MANAG -0.9589 -0.3710 0.6414 -1.4950 Ownershi: A3_CORPO -0.5214 -0.3434 0.4806 -1.0849 A3_FINAN 0.8867 0.6369 0.4643 1.9096 A3_GOVER 0.0745 0.1227 0.3550 0.2098 A3_INDIV 0.1405 0.0683 0.4030 0.3487 A3_MUTUA -0.5266 -0.4293 0.3912 -1.3460 Size : S_LNS 0.9889 0.3636 0.9141 1.0818 S_LNTA 0.9545 0.3226 0.8957 1.0657 Risk : R_RETCV 0.4259 0.2402 0.3131 1.3603 R_RETSTD 0.6778 0.5854 0.3948 1.7167 R_ROACV -0.2420 -0.3228 0.3773 -0.6414 R_ROASTD -0.3025 -0.3620 0.4799 -0.6303 R_ROECV -0.0212 0.2112 0.2922 -0.0725 R_ROESTD -0.3914 -0.4570 0.4957 -0.7895 Growth : G_MBE 0.8696 0.5713 0.6159 1.4119 G_SALES 0.7569 0.4279 0.4783 1.5824 G_TA 0.7905 0.4866 0.6921 1.1422 Comp : C_TCC2 0.9387 0.7811 0.3307 2.8385 C_TCC3 0.9719 0.7924 0.3276 2.9664 C_TCCC2 0.2764 -0.0706 0.7592 0.3641 C_TCCC3 0.3257 0.0454 0.6634 0.4910 Table 7A Path Coefficients (N=90)
Taiwan Subsample 2: Firms with Both Title of President and Director-Manager Compete Perf Board Ownershi Size Risk Growth Comp 0.0670 1.1110*** 0.1150 -0.3740 0.1290 0.1750 -0.1680
(0.0872) (0.5449) (0.1531) (0.3487) (0.2437) (0.1481) (0.1823) Standard errors are in parenthesis.
Table 7B
Correlations of Latent Variables
Taiwan Subsample 2: Firms with Both Title of President and Director-Manager Compete Comp Perf Board Ownershi Size Risk Growth Compete 1.000 Comp -0.155 1.000 Perf -0.256 0.734 1.000 Board -0.036 0.308 0.415 1.000 Ownershi -0.063 0.397 0.712 0.605 1.000 Size 0.277 -0.432 -0.717 -0.248 -0.495 1.000 Risk -0.258 0.350 0.267 0.187 0.058 -0.175 1.000 Growth -0.311 0.413 0.567 0.232 0.184 -0.542 0.482 1.000 Table 7C Outer Model Loadings
Taiwan Subsample 2: Firms with Both Title of President and Director-Manager Entire Mean of Standard T-Statistic
sample subsamples error estimate Compete : A5_hhiav 0.9533 0.7890 0.5648 1.6880 A5_hhisq 0.9916 0.8056 0.5791 1.7124 A5_top3a 0.9905 0.8038 0.5809 1.7051 A5_top4a 0.9836 0.7995 0.5784 1.7006 Comp : C_TCC2 0.9014 0.7753 0.2592 3.4778 C_TCC4 0.8255 0.7684 0.2599 3.1760 C_TCCC2 -0.8708 -0.5675 0.5670 -1.5358 C_TCCC4 -0.3678 -0.1869 0.4787 -0.7683 Perf : P_NI 0.9940 0.8784 0.4312 2.3050 P_NIBEX 0.9734 0.8728 0.4088 2.3810 P_SALES 0.7816 0.6956 0.3990 1.9589 Board : A2_BLOCK -0.0230 0.3032 0.3749 -0.0613 A2_DRCTR 0.9879 0.5730 0.6361 1.5531 A2_MANAG -0.2298 -0.0945 0.2595 -0.8855 Ownershi: A3_CORPO 0.0365 -0.1279 0.4201 0.0869 A3_FINAN 0.3524 0.2425 0.3189 1.1050 A3_GOVER 0.9286 0.5622 0.5547 1.6740 A3_INDIV -0.5395 -0.1526 0.5796 -0.9309 A3_MUTUA 0.0943 0.0198 0.2380 0.3962
19
Table 7C (cont’d) Outer Model Loadings
Taiwan Subsample 2: Firms with Both Title of President and Director-Manager Size : S_LNS -0.9466 -0.1267 0.9337 -1.0138 S_LNTA -0.9590 -0.1421 0.9386 -1.0218 Risk : R_RETCV 0.0094 0.0546 0.1861 0.0505 R_RETSTD 0.7774 0.5242 0.4868 1.5968 R_ROACV 0.0737 0.1550 0.2858 0.2579 R_ROASTD 0.8117 0.5663 0.5389 1.5063 R_ROECV 0.1930 0.1703 0.2671 0.7227 R_ROESTD 0.8185 0.5616 0.5517 1.4836 Growth : G_MBE 0.9323 0.4437 0.7277 1.2812 G_SALES 0.5864 0.2772 0.5406 1.0848 G_TA 0.5075 0.1635 0.6497 0.7811 Table 8A Path Coefficients (N=17)
Taiwan Subsample 3: Firms with Both Title of President and General Manager Compete Perf Board Ownershi Size Risk Growth Comp -0.0750 0.8830 -0.1000 -0.1330 -0.2640 0.2800 -0.0640 (0.4321)
(0.8957) (0.5134) (0.5135) (0.5215) (0.5292) (0.4344) Standard errors are in parenthesis.
Table 8B
Correlations of Latent Variables
Taiwan Subsample 3: Firms with Both Title of President and General Manager
Compete Perf Board Ownershi Size Risk Growth Comp Compete 1.000 Perf -0.067 1.000 Board -0.155 -0.269 1.000 Ownershi 0.133 -0.601 0.214 1.000 Size 0.114 0.801 -0.459 -0.482 1.000 Risk -0.175 0.161 0.154 -0.433 0.042 1.000 Growth 0.274 -0.754 -0.116 0.589 -0.449 -0.437 1.000 Comp -0.233 0.876 -0.183 -0.726 0.584 0.494 -0.821 1.000 Table 8C Outer Model Loadings
Taiwan Subsample 3: Firms with Both Title of President and General Manager Entire Mean of Standard t-Statistic
Sample Subsamples Error Estimate Compete : A5_hhiav 0.9820 0.8474 0.5058 1.9415 A5_hhisq 0.9932 0.8536 0.5099 1.9477 A5_top3a 0.9974 0.8553 0.5115 1.9501 A5_top4a 0.9925 0.8514 0.5097 1.9473 Perf : P_NI 0.9290 0.9316 0.1527 6.0844 P_NIBEX 0.9546 0.9388 0.1391 6.8618 P_SALES 0.9056 0.8631 0.1492 6.0717 Board : A2_BLOCK 0.8759 0.3324 0.5418 1.6166
21
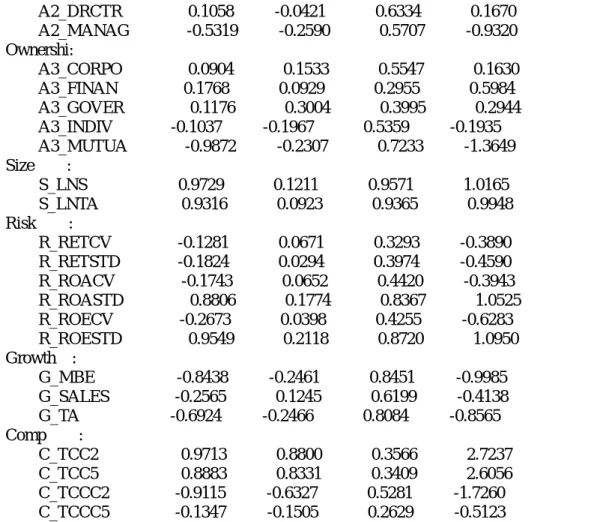
Table 8C (cont’d) Outer Model Loadings
Taiwan Subsample 3: Firms with Both Title of President and General Manager A2_DRCTR 0.1058 -0.0421 0.6334 0.1670 A2_MANAG -0.5319 -0.2590 0.5707 -0.9320 Ownershi: A3_CORPO 0.0904 0.1533 0.5547 0.1630 A3_FINAN 0.1768 0.0929 0.2955 0.5984 A3_GOVER 0.1176 0.3004 0.3995 0.2944 A3_INDIV -0.1037 -0.1967 0.5359 -0.1935 A3_MUTUA -0.9872 -0.2307 0.7233 -1.3649 Size : S_LNS 0.9729 0.1211 0.9571 1.0165 S_LNTA 0.9316 0.0923 0.9365 0.9948 Risk : R_RETCV -0.1281 0.0671 0.3293 -0.3890 R_RETSTD -0.1824 0.0294 0.3974 -0.4590 R_ROACV -0.1743 0.0652 0.4420 -0.3943 R_ROASTD 0.8806 0.1774 0.8367 1.0525 R_ROECV -0.2673 0.0398 0.4255 -0.6283 R_ROESTD 0.9549 0.2118 0.8720 1.0950 Growth : G_MBE -0.8438 -0.2461 0.8451 -0.9985 G_SALES -0.2565 0.1245 0.6199 -0.4138 G_TA -0.6924 -0.2466 0.8084 -0.8565 Comp : C_TCC2 0.9713 0.8800 0.3566 2.7237 C_TCC5 0.8883 0.8331 0.3409 2.6056 C_TCCC2 -0.9115 -0.6327 0.5281 -1.7260 C_TCCC5 -0.1347 -0.1505 0.2629 -0.5123 Table 9A
Path Coefficients: US Sample (N=231)
Perf Growth Risk Size Comp 0.5880*** -0.0160 0.0190 -0.2980
(0.0842) (0.0743) (0.0656) 0.1697 Standard errors are in parenthesis.
Table 9B
Correlations of Latent Variables: US Sample Comp Perf Growth Risk Size
Comp 1.000 Perf 0.797 1.000 Growth -0.265 -0.322 1.000 Risk -0.106 -0.134 0.004 1.000 Size -0.704 -0.690 0.199 0.155 1.000 Table 9C
Outer Model Loadings: US Sample
Entire Mean of Standard t-Statistic Sample Subsamples Error
Estimate Comp : C_SALARY 0.7686 0.7602 0.0419 18.3589 C_BONUS 0.8379 0.8437 0.0339 24.7167 C_LTIP 0.5597 0.5605 0.1061 5.2743 C_ALLOTH 0.3533 0.3397 0.1203 2.9362 C_RSTKHL 0.5463 0.5261 0.1162 4.7014 C_OTHANN 0.4411 0.4713 0.1052 4.1935 C_BLKV 0.6594 0.6509 0.0673 9.8020 C_RSTKGR 0.4515 0.4394 0.1348 3.3488 C_SOPTVA 0.6858 0.6674 0.0888 7.7187 C_SALARY 0.0751 0.0679 0.2234 0.3362 C_TCCCH 0.4408 0.3762 0.2567 1.7169 C_TDC1CH 0.5524 0.5293 0.1322 4.1773 C_TDC2CH 0.3549 0.3266 0.1921 1.8475 C_ALLOTH -0.1763 -0.1606 0.1474 -1.1958 C_SALARY -0.1044 -0.0928 0.0518 -2.0164 C_TCCPCT -0.0104 0.0087 0.1064 -0.0977 C_TDC1PC 0.4781 0.4527 0.1144 4.1775 C_TDC2PC 0.4432 0.4179 0.1115 3.9758 C_ALLOTH -0.0264 -0.0185 0.0498 -0.5302 Perf : P_SALES 0.8706 0.8586 0.0553 15.7435 P_NI 0.9664 0.9422 0.0238 40.5234 P_NIBEX 0.9703 0.9473 0.0224 43.2996 P_SALESC 0.3891 0.4726 0.1787 2.1769 P_NICH 0.1332 0.1952 0.4407 0.3022
23
Table 9C (cont’d) Outer Model Loadings: US Sample P_NIBEXC 0.1126 0.1877 0.4497 0.2504 P_ROA 0.2127 0.1918 0.1022 2.0819 P_ROE 0.3041 0.2881 0.0844 3.6038 P_RET 0.1511 0.1374 0.0967 1.5620 P_ROACH 0.0273 0.0326 0.1478 0.1847 P_ROECH -0.0068 -0.0121 0.1748 -0.0389 P_RETCH -0.0553 -0.0638 0.1193 -0.4637 P_ROAPCT -0.1097 -0.0386 0.1464 -0.7495 P_ROEPCT -0.1248 -0.0671 0.1193 -1.0462 P_RETPCT -0.0001 0.0317 0.0654 -0.0015 Growth : G_ASSETS -0.3254 -0.0229 0.4101 -0.7935 G_SALESP -0.3246 -0.0497 0.4303 -0.7544 G_MBE -0.9517 -0.4849 0.7681 -1.2390 Risk : R_ROASTD 0.1889 0.2709 0.3958 0.4773 R_ROESTD -0.0017 0.2314 0.4363 -0.0039 R_RETSTD 0.7105 0.2359 0.4815 1.4756 R_ROACV 0.5136 0.1225 0.4478 1.1468 R_ROECV -0.5491 -0.1265 0.4631 -1.1856 R_RETCV 0.5141 0.0101 0.5022 1.0236 Size : S_LNASSE -0.9509 -0.8298 0.4633 -2.0525 S_LNSALE -0.9604 -0.8393 0.4666 -2.0582