* Corresponding author. Tel.: #886-2-2462-9707; fax: #886-2-2462-0330. E-mail address: [email protected] (G.-C. Gong)
Spatial and temporal variation of chlorophyll a,
primary productivity and chemical hydrography
in the southern East China Sea
Gwo-Ching Gong
!,*, Fuh-Kwo Shiah", Kon-Kee Liu",
Yun-Ho Wen
!, Ming-Hsin Liang!
!Department of Oceanography, National Taiwan Ocean University, Keelung 202-24, Taiwan, Republic of China "Institute of Oceanography, National Taiwan University, Taipei, Taiwan, Republic of China
Abstract
Chemical hydrography, chlorophyll a distribution and primary productivity in the southern East China Sea from the inner shelf to the o!shore region were examined for their temporal and spatial variability based on observations along a cross-shelf transect during 1991}1995. In summer, all surface waters were depleted in nutrients and low in chlorophyll, resulting in widespread subsurface chlorophyll a maxima. In other seasons, shelf waters were usually nutrient-laden, but phytoplankton biomass was limited by light availability in the turbid inner shelf water and the short exposure time of the upwelled water in the outer shelf. The main nitrogen source in the inner shelf was from river runo!. Nitrate de"cit, de"ned as the negative deviation from the conservative mixing line, was well correlated with phytoplankton biomass. In spite of the seasonal and spatial variability of chlorophyll a distribution, the euphotic zone integrated value of chlorophyll a was correlated well with that of primary production in shelf waters. This relationship was used to convert chlorophyll a data from 28 cruises to primary production. The results showed that the lowest productivity on the shelf was in summer with little spatial variation. The elevated primary productivity in the inner shelves in spring was due to a mild spring bloom. On the other hand, the elevated primary productivity in the middle and outer shelves in autumn was due to the intensi"cation of upwelling during the transition of the monsoon. The annual mean values of the euphotic zone integrated primary production in the shelf waters were quite uniform (513}576 mgC m~2 d~1) with an overall mean of 549$84 mgC m~2 d~1. The o!shore Kuroshio Water showed a weak seasonal variation
0278-4343/00/$ - see front matter ( 2000 Elsevier Science Ltd. All rights reserved. PII: S 0 2 7 8 - 4 3 4 3 ( 9 9 ) 0 0 0 7 9 - 5
Fig. 1. Station locations for the KEEP-Box (h), KEEP-Key (m) cruises and Cruise 414 (]).
(276}309 mgC m~2 d~1) with an annual mean of 292$15 mgC m~2 d~1. ( 2000 Elsevier Science Ltd. All rights reserved.
Keywords: Chlorophyll a; Primary productivity; Chemical hydrography; Nitrate de"cit; Southern East
China Sea
1. Introduction
The southern East China Sea (ECS) extending from the mainland coast of China to the o!shore region northeast of Taiwan (Fig. 1) is a highly dynamic region because of the interaction of di!erent water types (Gong et al., 1996): the China Coastal Water (CCW), the Taiwan Current Warm Water (TCWW), the Upwelled Water (UW) and the Kuroshio Water (KW). The four types of water usually occupy the inner-, middle-, outer-shelf and o!shore region, respectively (Liu et al., 1992a; Gong et al., 1996). The hydrographic and nutrient conditions (denoted as chemical hydrography hereafter) have been demonstrated to regulate the phytoplankton biomass and primary produc-tivity in the southern ECS in spring (Liu et al., 1995).
The chemical hydrography is in turn controlled by physical forcing. For example, Gong et al. (1997) reported that retreat of the Kuroshio intrusion from the shelf northeast of Taiwan restored the upwelling center, which resulted in a doubling of the
phytoplankton biomass around the cyclonic eddy within two weeks. This illustrates that temporal variation of primary productivity cannot be properly interpreted, if only data on local primary productivity are examined without understanding of regional processes. On the other hand, the overall phytoplankton biomass might not have increased as much, because the event seemed to have involved only redistribu-tion of nutrients instead of net increase of nutrient supply. A synoptic regional survey would be essential to tackle this kind of problems. Fortunately, the large-scale synoptic near surface chlorophyll a (Chl a) data are now available from the satellite ocean color sensors, such as the recently launched SeaWiFS (Sea-viewing Wide Field-of-view Sensor). Increasing availability of the satellite-derived Chl a data will undoubtedly provide us with more accurate assessment of global primary productiv-ity. However, regionally speci"c algorithm is needed for the conversion of Chl a data into primary productivity. Bio-optical models, such as the semi-analytical photosyn-thesis-irradiance (PB-E) model or the analytical absorption model (Morel, 1991), are widely used, but photosynthetic parameters may not be easy to come by. Alterna-tively, the euphotic zone integrated primary production (IP) has been successfully estimated simply from the regional empirical relationship between Chl a and primary production (e.g., Ryther and Yentsch, 1957; Lorenzen, 1970; Smith and Baker, 1978; Hayward and Venrick, 1982; Eppley et al., 1985; Yoder et al., 1993; Mantyla et al., 1995).
In the present paper, spatial and temporal variations of chemical hydrographic conditions and Chl a distributions in the southern ECS observed along a cross-shelf transect on 13 cruises between 1990 and 1995 are systematically examined. The control of phytoplankton biomass by nutrient, light and other factors is addressed. Primary productivity data are available on some of the more recent cruises. In order to better assess primary productivity in the study region, we established relationships between Chl a and primary productivity, which in turn enabled us to estimate the missing primary productivity data. Thus, we obtained a temporally and spatially comprehensive data set of primary productivity for the southern ECS covering four seasons and four regions of di!erent water characteristics.
2. Materials and methods
2.1. Study area and data collections
The data collected from October 1991 to September 1995 along a long transect, named as KEEP-Key transect, were used to study the seasonal variability of chemical hydrography, Chl a and primary productivity in di!erent water masses of the southern ECS. The KEEP-Key transect (Fig. 1) extends from the inner shelf near the mainland China coast to the o!shore region where the Kuroshio #ows. A total of 13 cruises were conducted. Detailed information about the dates of the cruises, sampling stations and variables measured are listed in Table 1. Extracted Chl a samples were "rst collected in May 1993. Before that, Chl a concentrations were estimated from calibrated #uorescence data (Gong et al., 1993, 1995b). Primary productivity (PP)
Table 1
Cruise information Cruise no. R/V Date
(mm/dd, yyyy)
Season Stations visited Variables measured 297 OR1 10/05}07, 1991 Autumn 1}10 ¹, S, N, F 304 OR1 12/09}11, 1991 Winter 10}15 ¹, S, F 307 OR1 01/05}08, 1992 Winter 8}12, 14, 16, 17 ¹, S, N, O, F 314 OR1 04/16}22, 1992 Spring 1}12, 14, 16, 17 ¹, S, N, O 323 OR1 07/10}15, 1992 Summer 1}17 ¹, S, N, O, F 373 OR1 11/01}07, 1993 Autumn 1, 3, 5, 7, 8, 10}17 ¹, S, N, O, F, C 386 OR1 05/04}10, 1994 Spring 1!, 2}7, 8!, 10, 11!, 12}16, 17 ¹, S, N, O, F, C, P 405C OR1 11/06}12, 1994 Autumn 1!, 2, 5!, 6}10, 11!, 14, 17! ¹, S, N, O, F, C, P 414 OR1 03/22}28, 1995 Spring 1a!, 3a!, 9a!, 10a, 11a, 14a! ¹, S, N, O, F, C, P 034 OR2 09/13}15, 1994 Autumn 6}8, 9!, 10!, 11}13 ¹, S, N, O, F, C, P 111 OR2 05/01}04, 1995 Spring 11!, 12}16, 17! ¹, S, N, O, F, C, P 131 OR2 07/01}04, 1995 Summer 8}10, 11!, 13, 15, 17! ¹, S, N, O, F, C, P 149 OR2 09/01}04, 1995 Autumn 8, 9, 11!, 13, 15, 17! ¹, S, N, O, F, C, P KEEP-Box OR1 08, 1990}07, 1991 Monthly See Fig. 1 ¹, S, N, O, F KEEP-IOP OR1 09}10, 1992 and
04}05, 1993
Autumn and Spring
See Fig. 9 ¹, S, N, O, F, C
!Primary productivity experiments were performed.
¹: temperature, S: salinity, N: nutrients, O: dissolved oxygen, F: #uorescence, C: chlorophyll, P: primary productivity
measurements were conducted on Cruises 386, 405C and 414 onboard R/V Ocean
Researcher I, and on Cruises 034, 111, 131 and 149 onboard R/V Ocean Researcher II.
The calibrated #uorescence data collected from the KEEP-Box cruises during the period of August 1989 to July 1990 and the KEEP-IOP (Intensive Observation Period) cruises during the period of September 1992 to May 1993 (Fig. 1; Table 1) were used to calculate primary production with the empirical relationship between Chl a and PP established in this study.
2.2. Sampling Instruments and analytical methods
Pro"les of temperature (¹) and salinity (S) were measured by a SeaBird CTD (SBE9/11plus, SeaBird Inc., USA). Light transmission (LT), #uorescence (F) and total downwelling scalar irradiance (PAR) pro"les were measured, respectively, with a transmissometer (25 cm light path at 660 nm, Sea Tech Inc.), a #uorometer (Sea Tech Inc.) and a quantum scalar irradiance meter (4p collector; Biospheric Inc., USA) attached to the CTD. Seawater samples were collected using the Rosette sampler (General Oceanic Inc., USA) with Te#on-coated Go-Flo bottles (General Oceanic Inc., USA) mounted on the CTD assembly. The depth of the euphotic zone was de"ned as the depth of 1% surface light penetration. The CTD salinity data were double-checked with manually determined salinity by the Autosal (8400B; Guildline Inc., Canada) after each cruise.
Water samples for nutrient measurements were placed in a 100 ml polypropylene bottles and frozen immediately with liquid nitrogen. Nitrate was analyzed with a self-designed #ow injection analyzer and was reduced to nitrite with a cadmium wire which was activated with a copper sulfate solution (Gong, 1992). The precision for the nitrate analysis was 0.3lM for concentrations of 10 lM or higher. Dissolved oxygen was measured by spectrophotometry (Pai et al., 1993). Water samples for Chl a analy-sis were immediately "ltered through a GF/F "lter paper (Whatman, 47 mm) and stored at !203C. Chl a retained on GF/F "lters were determined #uorometrically (Strickland and Parsons, 1972; Gong et al., 1993, 1995b). The GF/F "lters were ground in 10 ml 90% acetone followed by extraction in a 43C shaking incubator for at least 2 h. After centrifugation (1000]g; 5 min), the Chl a concentration in the supernatant was measured with a #uorometer (Turner; 10-AU-005).
Primary productivity (PP) was measured by the14C assimilation method (Parsons et al., 1984; Shiah et al., 1995). Acid-cleaned polycarbonate bottles (250 ml, Nalgene) were "lled with seawater prescreened through 200lm mesh, and then inoculated with 10lCi NaH14CO3. Samples were incubated in situ from dawn to dusk on the three cruises in 1995. On Cruises 405C and 034, samples were incubated on deck using sunlight as the light source, and incubators were cooled with running surface sea-water. Following retrieval, the samples were "ltered through GF/F "lters (Whatman, 25 mm) under low vacuum ((100 mmHg). The "lters then were placed in scintillation vials and stored in dark. Upon returning to the laboratory, 0.5 ml of 2 N HCl was added and the vials were left open overnight in a hood at room temperature. Next, 10 ml of scintillation cocktail (Ultima Gold LLT) was added, and total activity on "lters was counted in a liquid scintillation counter (Packard 2700TR). Euphotic zone integrated Chl a (IB) and primary production (IP) was calculated by trapezoid rule.
3. Results
Hydrographic data and pro"les of Chl a and PP obtained during 1990}1995 (Table 1) are presented in four groups, representing the inner, middle and outer shelves and the o!shore region. The corresponding localities are represented by Stations 1}3, 5}7, 9}11 and 15}17 along the cross-shelf KEEP-Key transect (Fig. 1). The data collected during periods of March}May, June}August, September}November and Decem-ber}February are designated as spring, summer, autumn and winter, respectively. In general, the summer condition is distinctively di!erent from those of other seasons. Therefore, summer and non-summer conditions are presented separately in two sets of plots for each region.
3.1. The inner shelf
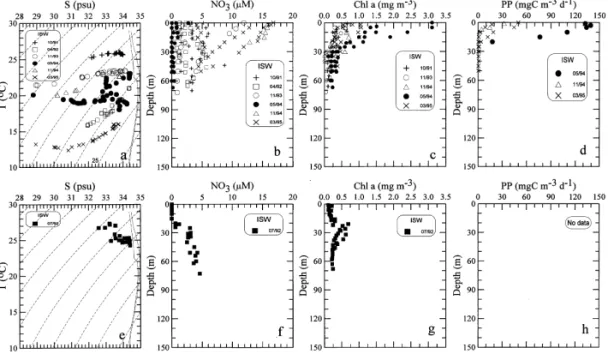
The scatter diagram of ¹}S and the vertical distributions of NO3, Chl a, and PP concentrations obtained in September}May are shown in the top panels of Fig. 2, and those in June}August are in the bottom panels. All inner shelf waters showed wide ranges of salinity ((29 to 34 psu) with the lowest salinities observed from November
Fig. 2. The ¹}S diagram, and the vertical pro"les of nitrate (NO3), Chl a and primary productivity (PP) in the inner shelf waters (ISW) in various seasons. The top panels are for non-summer seasons and the bottom ones are for summer.
to May. Since occurrences of very low salinity waters were during the dry period of low riverine discharge, apparently, the salinity change in this region was not directly controlled by changes in river runo! as suggested by Chen (1996), but by coastal circulation. The riverine discharges, most notably from Changjiang, starts to #ow southward along the coast after the onset of the northeast monsoon in mid September (Beardsley et al., 1985; Chao, 1991). It is usually in November that the very low salinity water reaches the southern ECS according to our records (Liu et al., 1993).
By contrast, the water temperatures were usually in a narrow range on a single cruise but changed from cruise to cruise, spanning from 123C in March to 273C in July. Strong salt gradient existed both vertically and horizontally with fresher water on top and usually hugging to the coast. Although no data were obtained for winter due to the rough sea conditions, the hydrographic conditions in winter should be similar to those found in spring and autumn in light of previous observations (Wang and Chern, 1988).
Vertical distributions of NO3 in the inner shelf are shown in Fig. 2(b). One of the most striking features is the seemingly inverse pro"le with maximum concentration at the surface and decreasing with depth. The highest concentration in the surface water reached as high as 17lM. Such pro"les all occurred in November and March, when very low salinity water was prevalent. Apparently, the low salinity water received ample supply of nitrate from riverine discharges (Zhang, 1996). However, very low salinity water was still observed in May, but nitrate concentrations dropped to nearly zero throughout the water column.
Table 2
The variation of daily averaged irradiance, mean light transmission, nitrate concentration, seawater temperature depth-integrated Chl a (IB) and primary production (IP) in the euphotic zone at Station 1 observed on three cruises
Season Early spring Late spring Late autumn
Date March 1995 May 1994 November 1994
(Cruise) (Cruise 414) (Cruise 386) (Cruse 405C)
IB (mg m~2) 4.8 46.0 5.6 IP (mgC m~2 d~1) 76 1900 120 Mean NO3 (lM) 15.4 0.8 15.7 Solar irradiance (lE m~2 s~1) 450 1500 1400 Light transmission (%) 55 (2.05 m~1)! 75 (0.79 m~1) 48 (2.57 m~1) Temperature (3C) 15 17 19
!Beam attenuation coe$cient of suspended particles.
The vertical distributions of Chl a concentrations were generally high in the surface layer and decreased rapidly with depth (Fig. 2(c)). The values of Chl a concentrations in surface water varied in a wide range from about 0.5 to above 3 mg m~3. The highest values of Chl a concentration were observed in late spring (May), suggesting a spring bloom. The values of IB in the euphotic zone were between 5 and 46 mg m~2.
Only three pro"les of PP data were obtained in the inner shelf (Fig. 2(d)). They are similar to those of Chl a with higher values in the surface and decreasing rapidly with depth. The values of PP in surface waters ranged from 20 to 140 mgC m~3 d~1. The highest PP corresponded to the highest Chl a concentrations observed in May 1994. PP essentially vanished below the top 25 m. The values of IP ranged from 76 to 1900 mgC m~2 d~1.
In summer, the observed salinity ranges (32.5 to 34.4 psu) were smaller than those of other seasons (Fig. 2(e)). NO3 concentrations were almost non-detectable in the top 20 m and increased with depth to about 5lM at the bottom (Fig. 2(f)). The vertical distributions of Chl a showed an eminent subsurface maximum centered around 30 m with concentration up to about 0.7 mg m~3 (Fig. 2(g)). The values of IB were about 17 mg m~2. No PP data were available for summer.
The percentage of light transmission in the surface layer was high in summer ('70%) and low in late autumn ((50%). Typical values observed at Sta 1 on three di!erent cruises are listed in Table 2. Vertically, a minimum usually existed in the bottom layer ((25%), apparently due to sediment resuspension (Hung et al., this volume). The generally lower light transmission observed in late autumn implied a higher intensity of sediment resuspension under the action of persistent northeast monsoon, which even reduced the light penetration in the surface water. The euphotic zone depth in late autumn was only 10 m on average.
3.2. The middle shelf
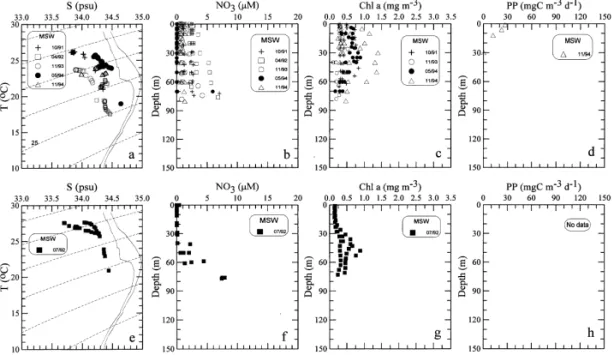
Hydrographic conditions and Chl a distributions in the middle shelf resembled those in the inner shelf in summer, but not in other seasons (Fig. 3). The salinity values
Fig. 3. Same as Fig. 2 except for the middle shelf waters (MSW).
were considerably higher, ranging from 33.7 to 34.4 psu (Fig. 3(a)). Highly enriched nitrate concentrations in the surface layer were not observed. Instead, nitrate concen-trations fell to 3lM in the surface water and 7 lM in the bottom water (Fig. 3(b)). Total depletion of nitrate in the top 40 m occurred in late spring and summer (Figs. 3(b) and (f)).
The vertical distribution of Chl a showed a distinctive subsurface maximum in summer (Fig. 3(g)) like that in the inner shelf (Fig. 2(g)). In other seasons, Chl
a concentrations were fairly uniform in the top 40 m at any given station and
decreased with depth beneath (Fig. 3(c)). The average Chl a concentrations in the upper 40 m ranged from 0.3 to 1.2 mg m~3. The depth of the euphotic zone was about 50 m on the average. The values of IB ranged from 11 to 56 mg m~2. Only one PP data was obtained in the November 1994 cruise (Fig. 3(d)). The value of IP was 340 mgC m~2 d~1.
Contrary to the inner shelf where the highest values of salinity were observed in summer, the salinity in the middle shelf showed its lowest values (33.7 psu) in summer (Fig. 3(e)). The low salinity and low nitrate water in the middle shelf probably originated from the South China Sea, where waters with similar characteristics have been observed (Gong et al., 1992). The northward #ow through the Taiwan Strait from the South China Sea is supposedly the strongest in summer feeding the TCWW in the ECS shelf (Chuang, 1986; Shaw, 1989). Consequently, this northward #ow causes wide-spread two-layer structure in the water column of the southern ECS with relatively fresh, warm, nutrient-depleted water in the surface layer and colder, more saline, nutrient-laden water in the bottom layer. Nutrients in the bottom water apparently originated from the Kuroshio upwelling (Gong et al., 1995a).
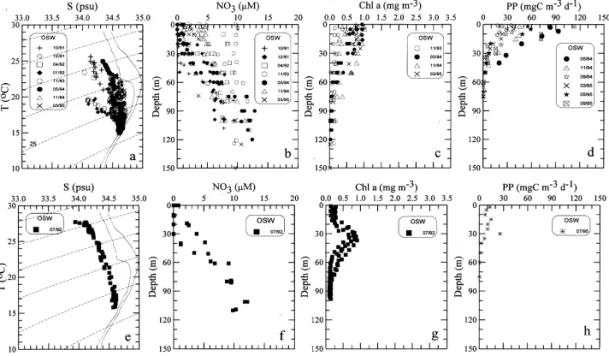
Fig. 4. Same as Fig. 2 except for the outer shelf waters (OSW).
The vertical distribution of Chl a in summer was similar to that in the inner shelf, but the depth of the subsurface Chl a maximum (ca. 50 m) was deeper (cf. Figs. 2(g) and 3(g)) obviously due to a deeper nitracline (cf. Figs. 2(f) and 3(f)). The depth of euphotic zone was about 55 m on the average. The values of IB were about 19 mg m~2. No PP data in summer were available.
3.3. The outer shelf
Throughout the year, ¹}S curves (Figs. 4(a) and (e)) of the outer shelf water converge to the region around 153C and 34.6 psu withph"25.6, representing the upwelling source water (Wong et al., 1991; Liu et al., 1992b; Gong et al., 1995a). Such a ¹}S feature indicates the persistence of the upwelling process (Liu et al., 1992a). In the upper water column, the ¹}S properties fall into two trends (Fig. 4(a)): one resembling the Kuroshio Water and the other more in#uenced by the shelf water. The two separate trends indicated the existence of di!erent types of end members in the surface layer. One type was warmer and more saline, obviously originating from the Kuroshio surface water. The other had lower temperature and salinity, most likely containing some CCW which made excursion eastward from the middle shelf (Gong et al., 1995a).
The vertical distributions of NO3 usually showed enrichment throughout the water column with the maximum value consistently approaching 10lM or higher near the bottom (Fig. 4(b)). However, the surface concentration varied greatly, ranging from almost undetectable to about 10lM. The highest surface NO3 concentration was observed at Station 11 on the November 1993 cruise. The lowest surface
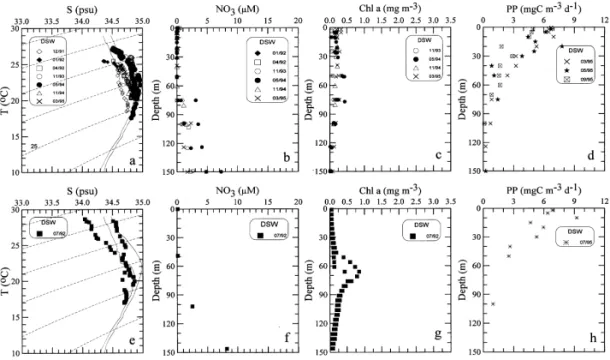
Fig. 5. Same as Fig. 2 except for the o!shore deep sea waters (DSW). Solid curves represent the mean ¹}S characteristics of the Kuroshio (Gong et al., 1995a).
concentration was observed on the December 1991 cruise (Fig. 4(b)), while the bottom nitrate concentration was also the lowest (8lM), suggesting that the strength of the upwelling could be lower during a strong intrusion of the Kuroshio surface layer. This is consistent with direct observations of the upwelling #uxes (Liu et al., this volume). In seasons other than summer, the vertical distributions of Chl a in the upper 30 m showed little variation with depth but changed from cruise to cruise ranging between 0.1 and 1.0 mg m~3 (Fig. 4(c)). Below the top 30 m, Chl a decreased with depth. The depth of the euphotic zone ranged from 50 to 70 m with a mean about 60 m. The values of IB ranged from 12 to 39 mg m~2. The measured values of PP were high in the surface and decreased rapidly with depth (Fig. 4(d)). The values of PP in the surface waters were also highly variable, ranging from 20 to 110 mgC m~3 d~1. The values of IP ranged from 430 to 1520 mgC m~2 d~1.
In summer, a rather strong subsurface maximum of Chl a was repeatedly observed (Fig. 4(g)). The maximum was centered at depth between 30 and 40 m with concentra-tions between 0.6 and 0.8 mg m~3. The depths of the euphotic zone were about 65 m on the average. The values of IB were around 22 mg m~2. The vertical distribution of PP showed little variation with depth in the upper 25 m (Fig. 4(h)). The value of IP was 460 mgC m~2 d~1.
3.4. The owshore water
The o!shore water was usually dominated by the Kuroshio Water as indicated by the ¹}S diagram (Fig. 5(a)), but, in summer, low salinity was observed in the surface
layer (Fig. 5(e)). The less saline water was probably an out#ow of the shelf water (Chern et al., 1990; Liu et al., this volume). The surface temperatures were always higher than 253C for all seasons of the year. The vertical distributions of NO3 showed that the upper 60 m were always impoverished and concentration increased gradually with depth thereunder (Figs. 5(b) and (f)).
The vertical distributions of Chl a showed a strong subsurface maximum centered at depth between 60 and 70 m with concentration up to 0.8 mg m~3 in summer (Fig. 5(g)). In other seasons, Chl a pro"les showed a broadened subsurface maximum with concentration always lower than 0.5 mg m~3 (Fig. 5(c)). The depths of euphotic zone were about 100 m on the average. The values of IB ranged between 17 and 22 mg m~2. The vertical distributions of PP show highest value at surface and a gradual decrease with depth and vanishing to null for depth below 100 m (Fig. 5(d)), but a local maximum existed at 10 m below the surface in summer (Fig. 5(h)). The values of IP ranged between 180 and 335 mgC m~2 d~1.
4. Discussion
We attempt to "nd the correlation between Chl a abundance and primary produc-tivity. However, the relationships are dependent on the vertical distribution of Chl a, which in turn was controlled by nutrient supply and other hydrographic conditions.
4.1. Nitrogen supply, light penetration and Chl a distribution
The vertical distributions of Chl a in the southern ECS showed an interesting dichotomy. In summer, all regions showed the same pattern of a distinctive subsurface maximum of Chl a with a similar concentrations (0.5}0.8 mg m~3), which were centered at the nitracline (Figs. 2(g)}5(g)). In other seasons, Chl a distribution varied markedly from region to region but most pro"les showed relatively high concentra-tion at the surface (Figs. 2(c)}5(c)). Di!erent controlling factors must have governed the two distinct types of Chl a distribution.
Nutrient limiting conditions prevailed in strongly strati"ed water columns, which prevented upward supply of nutrients from the subsurface layer. The best developed subsurface Chl a maximum was found in the o!shore water in summer. The surface water reached temperatures above 283C withpHless than 21.5 (Figs. 2(e)}5(e)). Besides high sea surface temperature, the strati"cation was further enhanced by a reduced salinity at the surface, which could have resulted from local precipitation and summer runo! or come from the South China Sea via the northward #ow in the Taiwan Strait. This warm, less saline and nutrient-depleted water, under the forcing of the prevailing southwest monsoon (Gong et al., 1992), widely spread on the shelf with the maximum thickness in the middle shelf (Fig. 3(f)). The Chl a build-up corresponded exactly to the gradual increase of nitrate below the surface mixed layer (Figs. 5(f) and (g)). Besides nutrient limitation, other causes may also contribute to the formation of secondary chlorophyll maximum (e.g. Longhurst and Harrison, 1989), but they are beyond the scope of this discussion.
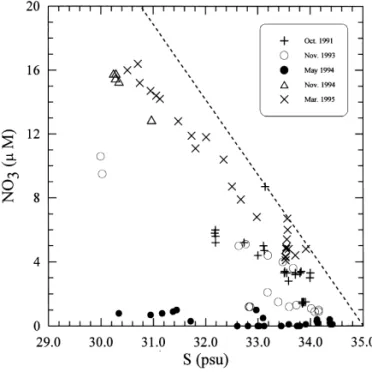
Fig. 6. The relationship between salinity (S) and nitrate concentration (NO3) in the inner shelf waters observed on various cruises. The dashed line is the hypothetical mixing line for two end members: a nitrate-devoid one with salinity at 35 psu and a nitrate-laden brackish water. (See text for detailed explanation.)
Aside from summer, inner shelf waters almost never lacked nitrate, but the Chl
a concentrations in the surface water varied in a wide range: 0.4}3.2 mg m~3 (Fig. 2).
Three observations at Station 1 in di!erent seasons are compared in Table 2. The low Chl a and PP observed on Cruise 414 (March 1995) may be attributed to the low solar irradiance and high turbidity in water column as shown by the low light transmission (Table 2). The rather low temperature might have also limited the phytoplankton growth. Similarly low Chl a and PP were observed on Cruise 405C in late autumn. Although solar irradiance was normal on that cruise, the light transmission in the euphotic zone was the lowest (Table 2). A high loading of total suspended matter in the water column was observed and attributed to sediment resuspension induced by strong wind during northeast monsoon (Hung et al., this volume). Limited light penetration was probably responsible for the low phytoplankton biomass. Of course, one might suspect that availability of micronutrients, such as iron, could be the limiting factors for the high-nitrate low-chlorophyll conditions (e.g., Martin, 1991). This is unlikely because the coastal sediments are rich in reactive iron ('10 mg g~1; Huang and Lin, 1995) and the estimated #ux of total iron from the atmosphere to the ECS is also quite high (more than 1000 mg m~2 yr~1; Duce and Tindale, 1991).
The nutrient loading in the CCW seemed to follow mixing trend between nutrient-laden river runo! and nutrient-depleted saline o!shore water (Fig. 6). The negative correlation between nitrate and salinity appeared to result from conservative mixing, but the mixing trends changed from cruise to cruise and signi"cant deviations from
a linear mixing line also occurred during the same cruise. Inverse trends were also shown by nitrate and Chl a (Table 2), which implied nitrate loading in the CCW was also a!ected by nitrate uptake by phytoplankton besides mixing.
Conservative mixing for nitrate has been demonstrated for estuarine waters on the ECS coast (Edmond et al., 1985; Zhang, 1996). A hypothetical conservative mixing line is assumed for the CCW with two end members: a nutrient-devoid o!shore water with salinity of 35 psu and a nutrient-laden brackish water. The slope of the mixing line is so chosen that it appears as an upper bound for nitrate concentration at any given salinity (Fig. 6). The slope of the line (!4.7lM/psu) is similar to that (!4.6lM/psu) observed in the Changjiang estuary (Zhang, 1996). Deviation of any data point in the y-direction from the mixing line gives the nitrate de"cit, which presumably has been caused by phytoplankton uptake.
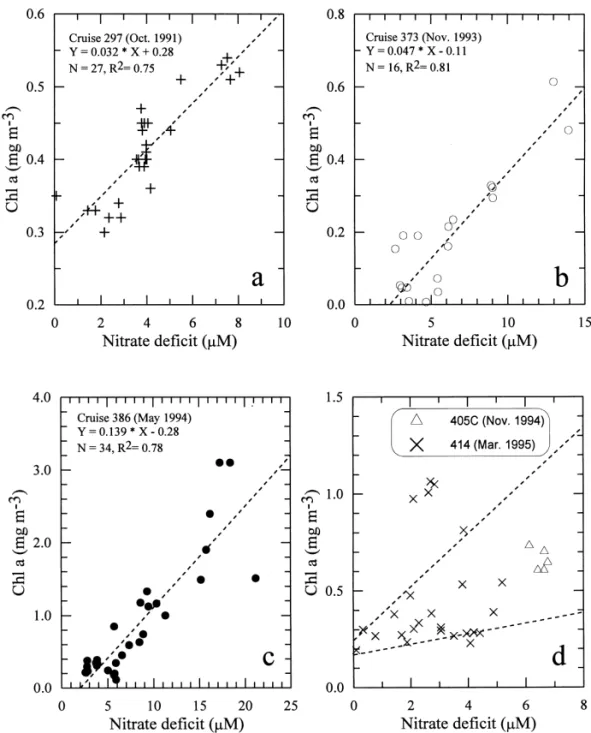
As expected, positive trends existed between nitrate de"cit and Chl a concentration for most samples from the inner shelf (Fig. 7), suggesting an increase in phytoplankton biomass associated with nitrate uptake. High correlation was found on Cruises 297 (October 1991), 373 (November 1993) and 386 (May 1994). On Cruises 405C (Novem-ber 1994) and 414 (March 1995), most data points fell between two positive trend lines (Fig. 7(d)), but four data points from Cruise 414 lied considerably above the upper trend line. The two trend lines have slopes of 0.027 and 0.137 mg Chl (mmol N)~1, respectively, which are similar to those observed on other cruises. The anomalously high Chl a concentrations belonged to surface waters at Station 3a, which had exceptionally high temperature (0.33C above the normal trend). The elevated temper-ature probably stabilized the water column and induced a spurt of rapid phytoplan-kton growth.
The slope of the trend lines for Chl a vs. nitrate de"cit varied between 0.03 and 0.14 mgChl (mmol N)~1. By comparison, the Chl a to nitrogen ratio in phytoplankton is usually in the range of 1}3 mgChl (mmol N)~1 (Geider, 1987), which makes it clear that the increase in phytoplankton biomass could not have accounted for the loss in nitrate. The missing nitrogen, to a larger extent, must have been removed from the water column by grazing and sinking of coagulated phytodetritus and, to a less extent, converted into dissolved organic nitrogen. Moreover, the largest nitrate de"cit (up to 21lM) was observed in May 1994, when the Chl a concentrations also reached the highest level (up to 3.2 mg m~3), but the smallest nitrate de"cit in March 1995 did not correspond to the lowest Chl a level (0.2}1.1 mg m~3). Instead, the lowest Chl a level (mostly less than 0.6 mg m~3) was found in autumn (October and November), suggesting a faster removal presumably by grazing in autumn than in spring.
A high-nitrate low-chlorophyll condition was found on the November 1993 cruise. NO3 concentration was about 9.5 lM throughout the water column at Station 11 of the KEEP-Key transect (Fig. 4(b)), but Chl a concentration was only 0.13 mg m~3 on the average (Fig. 4(c)). The highest NO3 concentration ever observed in the upwelling area indicated Kuroshio upwelling at its maximum strength. It was accompanied by the very low temperature (17.13C) and low degree of oxygen saturation (76%) at the surface. These evidences all indicate that the surface water was freshly upwelled from depths.
Fig. 7. The relationship between nitrate de"cit and Chl a concentration on various cruises in the inner shelf waters onboard R/V Ocean Researcher I. (a) Cruise 297 (b) Cruise 373. (c) Cruise 386. (d) Cruises 405C and 414. The two trend lines have slopes of 0.027 and 0.137 mg Chl (mmol N)~1 respectively.
Relatively low growth rate of phytoplankton in the freshly upwelled waters has been reported by Chang (1996). The high-nitrate low-chlorophyll conditions in the upwelling area must have been subject to physiological adaptation of phytoplankton. Of course, grazing might also have contributed to the low phytoplankton biomass,
but Chang (1996) reported low grazing rate in the freshly upwelled water. Moreover, the horizontal advection associated with the upwelling divergence continuously removed phytoplankton away from the upwelling center and kept the biomass low. Away from the upwelling center, Chl a increased with decreasing nitrate, increasing temperature and saturation of dissolved oxygen in the surface water within 50}80 km from the upwelling center (Liu et al., 1995). The aging e!ect of the upwelled water on phytoplankton growth is apparent (Chen, 1994, 1995) and very high growth rate has been reported for the upwelling area (Shiah et al., 1996). Fig. 3(b) showed that high concentration of NO3 were occasionally observed in the middle shelves in spring and autumn. Intrusion of the Kuroshio surface layer, which usually occurs from mid-October (Tang and Yang, 1993) to mid-April (Chuang and Liang, 1994), must have pushed the upwelled water inward to the middle shelf where elevated Chl a was observed (Gong et al., 1997).
4.2. Estimation of primary production from Chl a
4.2.1. Relationship between Chl a and primary productivity
In the present study, a total of 22 PP data sets were obtained on seven di!erent cruises which covered various seasons and stations in the southern ECS. Data from all four regions were pooled into analysis to delineate relationships among surface Chl
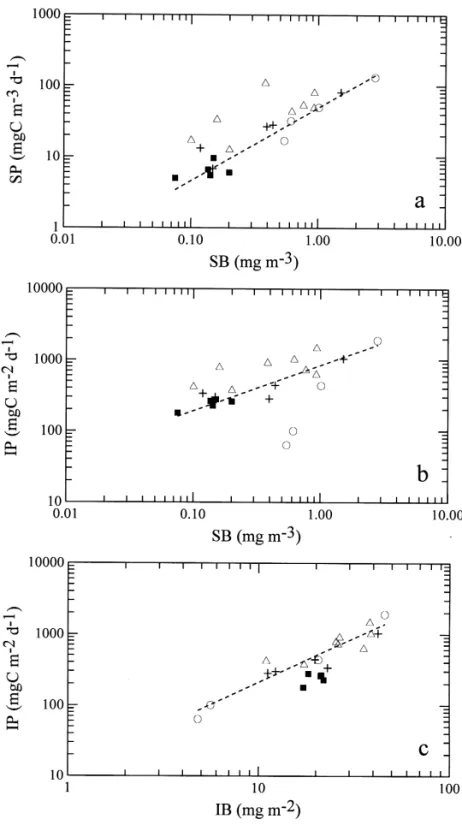
a concentration (SB), surface primary productivity (SP), IB and IP (Fig. 8). The Chl a concentration and primary productivity in surface waters are well correlated with
three points falling considerably above the general trend (Fig. 8(a)). The exceptionally high SP values were measured at Stations 9 and 10 on the July 1994 cruise (OR2-034) and at Station 11 on the September 1995 cruise (OR2-149), respectively. In fact, all sites from the upwelling area were higher in SP compared to other sites with the same surface Chl a concentration. The values of the three exceptionally high primary productivity to Chl a ratios (PB) ranged from 177 to 293 mgC (mgChl)~1 d~1, suggesting that rapid phytoplankton growth was induced by upwelled nutrients and high solar radiation in July and early September, which is consistent with the previous "ndings of high PB.!9 value in the upwelling area by Shiah et al. (1996). For all data besides the three exceptions, the log-linear regression equation is
log[SP]"0.985($0.079) log[SB]#4.016($0.336), R2"0.90. (1a) In the plot of SB vs. IP (Fig. 8(b)), the three sites with exceptionally high SP values followed the general trend more closely, but two data points from the inner shelf fall well below the trend line, which were not included in the regression analysis. For all other data points, the regression equation is
log[IP]"0.597($0.085) log[SB]#6.85($0.36), R2"0.77. (1b) The two outliers were both obtained at Station 1 from two di!erent cruises: the November 1994 cruise (OR1-405C) and the March 1995 cruise (OR1-414). The especially low IP observed at Station 1 re#ected the very limited light penetration in the coastal zone discussed above.
Fig. 8. The relationships between (a) surface Chl a concentration (SB) and primary productivity (SP), (b) surface Chl a concentration (SB) and euphotic zone integrated primary production (IP) and (c) euphotic zone integrated Chl a (IB) and primary production (IP) in the southern East China Sea. Inner shelf waters (L); Middle shelf waters including Station 8 (#); Outer shelf waters (n); O!shore deep sea waters (j).
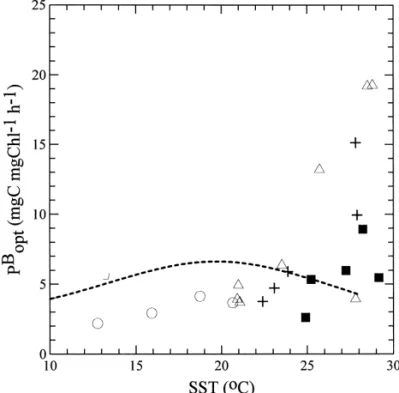
Fig. 9. The relationship between sea surface temperature (SST) and photoadaptive variable (Pbopt) in the southern East China Sea. The symbols are the same as those in Fig. 8.
Finally, the relationship between IB and IP was examined (Fig. 8(c)). The data points representing the o!shore waters (solid squares) all fall below the points for the shelf waters. The log-linear regression equation of the relationship between IB and IP for all sites except the o!shore waters is
log[IP]"12.1($0.11) log[IB]#2.75($0.31), R2"0.88. (1c)
The lower IP of the o!shore water, compared to shelf waters with the same IB, is attributable to the very deep Chl a maximum where much less light is available. Fortunately, the o!shore waters showed little temporal variation. Their IP to IB ratios remained fairly constant ranging between 10 and 12 mgC (mgChl)~1 d~1 with a mean of 11.3$1.0 mgC (mgChl)~1 d~1. Therefore, the value of IP for the deep sea waters could also be reasonably well estimated from the value of IB.
Recently, Behrenfeld and Falkowski (1997) proposed that IP can be estimated as the product of C463& (surface phytoplankton biomass), PB015 (photoadaptive variable),
Z%6 (the depth of the euphotic zone), F (irradiance-dependent function) and DL
(day-length). The most sensitive terms in a!ecting the accuracy of this equation are
C463& and PB015. Behrenfeld and Falkowski (1997; in their Fig. 7) argued that PB015 could
be derived from a polynomial relationship with sea surface temperature (i.e. SST), although the uncertainty of the PB015-SST relationship was quite high. We found that the PB015-SST relationship derived from our study (Fig. 9) was quite di!erent from the
data '253C. Such discrepancy and the good correlation found between IP and IB (see above) suggested that at least for the local study, our empirical approach of using of IB to estimate IP might be more appropriate than the model equation proposed by Behrenfeld and Falkowski (1997).
The relationships between SB and IP and between IB and IP can both be used to convert Chl a abundance into primary productivity. Of course, the latter would give more precise estimates than the former, and also more applicable to coastal zones. However, if only surface Chl a concentration is available, such as measurement by underway #uorometry of surface water or by satellite remote sensing, the former relationship can also provide a reasonable estimate of primary production. For a turbid environment, such as the coastal zone, correction for the limitation of light penetration is possible, if turbidity can be determined concurrently with the Chl
a measurement. For the underway monitoring system, a transmissometer in the
pumping-through system may provide the necessary data. For satellite remote sensing system, such as the SeaWiFS, turbidity can be determined by using the 490 nm waveband (Austin and Petzold, 1981).
On the other hand, if the euphotic zone integrated Chl a can be measured by hydrocasts or by a scanning device, such as the Scan-Fish or Aqua-Shuttle, or can be accurately estimated from surface Chl a concentration by modeling (e.g., Platt et al., 1988), the IP should be estimated from the IB}IP relationship. For this study, Equation (1c) was used for the calculation of IP from all Chl a data obtained on KEEP cruises conducted from 1989 to 1995 (Table 1). Depths of the euphotic zone (Z%) were either measured with a Secchi disc or PAR sensor, or calculated as (4.605/K$), where K$ is the total downwelling attenuation coe$cient. K$ is in turn calculated from the Chl a pro"les using Eq. (2), which was derived from observations in the southern ECS by Gong and Liu (1995):
K$"0.129 [AB]0.43, R2"0.67, (2)
where AB is the averaged Chl a concentration in the euphotic zone.
During the calculation, iteration method was employed to "nd Z% that satisfy the above relationships. For the slope sea waters, the observed average euphotic zone depth of 100 m was assumed for the calculation (Gong et al., 1999).
4.2.2. Change of PP during monsoonal transitions
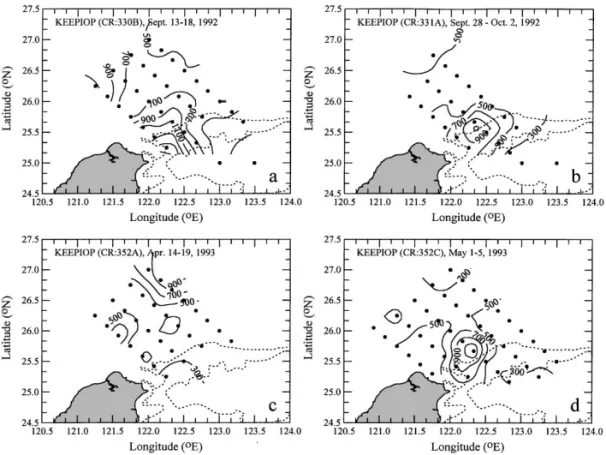
In order to understand responses of sea conditions o! northeastern Taiwan during transitions of the prevailing monsoon, closely scheduled cruises were conducted during the KEEP intensive observation periods. Two cruises conducted on board the R/V Ocean Researcher I during 13 September } 2 October 1992 and another two during 14 April } 5 May 1993 produced areal coverage of Chl a distributions (Gong et al., 1997), which were transformed into IP maps (Fig. 10). In general, the highest values of IP occurred around the upwelling region at the shelf break northeast of Taiwan, except on the April 1993 cruise (Fig. 10(c)). The highest values of IP estimated on various cruises were 900}1500 mgC m~2 d~1. The lowest values of IP estimated were observed in the o!shore water with values lower than 300 mgC m~2 d~1.
Fig. 10. The spatial distribution of the euphotic zone integrated primary production (IP) in the sea o! northeastern Taiwan calculated from Chl a data obtained on four cruises during intensive observation periods (KEEP-IOP). The dashed curves are the isobath of 200 m and 500 m.
During the onset of the northeast monsoon in mid September 1992, a very intense primary productivity (up to 1500 mgC m~2 d~1), which was the highest among all data (Fig. 10(a)), was observed over the upper slope just o! northeastern coast of Taiwan. The high primary productivity might have been a response to the short-term intensi"cation of upwelling at the onset of the northeast monsoon as reported by Liu et al. (1992b). Two weeks later, the high productivity center moved northeastward over the shelf edge and the PP intensity was subdued, which probably indicated a transition leading to the shelfward intrusion of the Kuroshio main stream after prolonged forcing of the northeasterly (Chao, 1991; Tang and Yang, 1993). Such intrusion appeared to suppress the upwelling moderately (Liu et al., this volume). The average IP for the area with bottom depth shallower than 1000 m changed from 750 to 550 mgC m~2 d~1.
The very low values of IP in the outer shelf observed on the April 1993 cruise (Fig. 10(c)) was because the region was occupied by the intruding Kuroshio surface water, which is usually depleted in nutrients (Gong et al., 1997). The upwelling was still active except that the upwelled water was pushed inward on the shelf. Rather high productivity was found in the middle shelf owing to the repletion of nutrients from the upwelled water. Two weeks later, the Kuroshio retreated from the shelf and the
Fig. 11. The seasonal averages of the euphotic zone integrated primary production (IP) calculated from measured PP or estimated from Chl a data obtained at stations on the KEEP-Box and KEEP-Key transects.
upwelling center was reestablished at the shelf edge with a well developed patch of intense primary productivity. The average IP also rebounded from 450 to 540 mgC m~2 d~1.
4.2.3. Seasonal variation of PP
Eleven monthly cruises from August 1989 to July 1990 were conducted along two KEEP-Box transects (Fig. 1) from the middle shelf to the o!shore region in the southern ECS (Fig. 1). Thirteen cruises (Table 1) were conducted onboard R/V Ocean
Researcher I and II from October 1991 to September 1995 along the cross-shelf
KEEP-Key transect. These data provided good coverage for seasonal variation of primary productivity. The seasonal average IP values for all stations along these transects are shown in Fig. 11. In general, IP seemed to decrease slightly from the inner shelf to the middle shelf and increased again in the outer shelf and decreased abruptly further o!shore (Fig. 11(c)). Seasonally, the lowest values always appeared in summer, whereas highest values occurred more often in spring or autumn. A closer examination revealed more variability. The inner shelf had very low values in autumn after intensi"cation of the northeasterly, apparently due to increasing turbidity from sediment resuspension (Hung et al., this volume) that limited light penetration. The middle shelf enjoyed high productivity in spring and autumn, when upwelled nutrients were probably pushed shelfward by the intruding Kuroshio.
The mean IP values with standard deviations for the four regions across the shelf in the southern ECS in four seasons are listed in Table 3. The mean seasonal IP values
Table 3
The mean values of euphotic zone integrated primary production (mgC m~2 d~1) with standard deviations for the four regions in the southern East China Sea in four seasons. Numbers in brackets are the numbers of observations
Region! Spring Summer Autumn Winter Annual Mean
O!shore 309$38(18) 276$30(10) 287$36(10) 296$6(4) 292$15 Inner 977$563(8) 330$16(2) 363$172(3) 363" 513$332 Shelf Middle 631$214(10) 341$25(4) 778$478(16) 507(1) 564$175 Outer 611$98(24) 358$49(14) 733$219(27) 601$134(11) 576$70 Seasonal Mean 740$203 343$19 625$184 490$134 549$84
!The four regions are represented by stations on the KEEP-Key (KK) transect and the KEEP-Box (KB) transects (see Fig. 1) as follows: Inner shelf (Sta. 1}3 of KK), middle shelf: (Sta. 5}7 of KK and Sta. 5513 and 6115 of KB), outer shelf (Sta. 9}11 of KK and Sta. 5315, 5220, 5121, 5323, 5422 and 542A of KB), and o!shore region (Sta. 15}17 of KK and Sta 4523, 4424, 5125, 5030 and 4531 of KB).
"No observation was done for inner shelf in winter, for which the value of autumn is assumed.
for all shelf waters and the mean annual IP values for the four regions are also listed. The o!shore water showed the least seasonal variability in primary productivity with a mean annual productivity of 292$15 mgC m~2 d~1, which is quite close to the recent estimate (285 mgC m~2 d~1) based on a photosynthesis-irradiance model (Gong et al., 1999).
For the shelf waters, the highest mean IP occurred in spring, suggesting a mild spring bloom of phytoplankton, especially in the inner and middle shelf where very high IP values above 1000 mgC m~2 d~1 were found (Fig. 11(c)). The very high standard deviations for the inner and middle shelves in spring (Table 3) also re#ected the drastic change of primary productivity prior and during the spring bloom. The IP values of the shelf waters were lowered considerably in summer approaching that of the o!shore water. In autumn, the inner shelf water remained in low productivity, whereas the middle and outer shelf witnessed a strong comeback, re#ecting intensi"-cation of the upwelling during the transition of the prevailing wind. The mean IP for winter was slightly lower than that for spring, but the winter value was more uncertain because of scarcity of data for the inner and middle shelf.
The mean annual IP values of the three regions on the shelf were surprisingly close, ranging from 513 to 576 mgC m~2 d~1 (Table 3). The highest value belongs to the outer shelf, where upwelling enhanced the phytoplankton growth. Note that the value for the inner shelf is less reliable due to lack of observations in winter, for which the value for autumn was assumed for the calculation of the annual mean. The overall annual mean for all shelf waters was 549$84 mgC m~2 d~1, which is about twice the value for the o!shore water. The mean annual primary production per unit area on shelves bordering western boundary currents varies in a wide range, from 80 to 960 mgC m~2 d~1, with a mean of 380 mgC m~2 d~1 (Walsh, 1988). The mean value (549$84 mgC m~2 d~1) that we obtained for the southern ECS is above average
among similar environments, but close to the median value. Compared to the South Atlantic Bight (SAB), where the annual mean is 390 mgC m~2 d~1 (Menzel et al., 1993), our study area is more productive. Broken down into the inner, middle and outer shelves, the mean values are 620, 248 and 360 mgC m~2 d~1, respectively, for the SAB. For our study area, the middle and outer shelves were both considerably more productive, while the inner shelf was slightly less productive (Table 2). In fact, very high productivity, with an average of 2000 mgC m~2 d~1, also occurs in the SAB during upwelling events, but under non-upwelling conditions the primary production is less than 200 mgC m~2 d~1 (Yoder et al., 1985). The higher productivity at the middle and outer shelves of our study is apparently attributable to the more persist-ently Kuroshio upwelling, which provides a greater nutrient supply to the shelf than the upwelling events in the SAB (Liu et al., this issue).
5. Summary and conclusion
The spatial and temporal variation of Chl a and primary productivity in the southern East China Sea was closely related with the chemical hydrographic condi-tions as observed in the KEEP program from 1989 to 1995. The lowest surface Chl
a concentrations were found in the o!shore water, where the surface mixed layer
remained oligotrophic throughout the year due to strong strati"cation. However, the euphotic zone integrated Chl a abundance in the o!shore water was usually higher than those in some shelf regions owing to a notable subsurface Chl a maximum around the depth of 70 m. Strati"cation of water column also occurred on the shelf in summer due to high sea surface temperature and spread-out of a low salinity water, which originated probably mainly from the South China Sea and was fed through the Taiwan Strait. As a result of strati"cation, the surface layer was depleted in nutrients and a subsurface Chl a maximum was developed at the depths of 30}50 m across the shelf in summer.
In other seasons, the shelf waters were usually enriched in nutrients throughout the water column due to more vigorous vertical mixing as well as a rich supply of nutrients from river runo! for the inner shelf and from the Kuroshio upwelling for the outer shelf. High-nutrient low-chlorophyll conditions often occurred in the upwelling center and the inner shelf. In the former area, phytoplankton grew gradually in the freshly upwelled water, which was low in Chl a to begin with. In the latter area, high turbidity caused by wind-induced sediment resuspension limited light penetration, and, thus, limited phytoplankton growth. Nitrate removal in the inner shelf water was usually accompanied by increase in Chl a concentration, but the resultant phytoplank-ton biomass may have likely been controlled by grazing and other removal processes, which were higher in autumn than in spring.
Despite complicated controlling factors for Chl a distribution in the shelf environ-ment, the euphotic zone integrated Chl a abundance was well correlated with the euphotic zone integrated primary production. This relationship was used to estimate the primary production in the shelf waters from observed vertical pro"les of Chl a, which had a better spatial and temporal coverage than the measurements of primary
productivity. However, the o!shore water showed a consistent negative deviation from the above relationship, implying it was less productive, for the same amount of Chl a, than the shelf water due to its rather deep Chl a maximum. Fortunately, the seasonal variability of the o!shore water was the lowest. A constant primary produc-tivity to Chl a ratio of 11.3$1.1 mgC (mgChl)~1 d~1 was used for the conversion. A reasonably good correlation was also found between the euphotic zone integrated primary production (IP) and the surface Chl a concentration for shelf waters and the o!shore waters except the inner shelf water with high turbidity. Such relationship provides a means for estimation of IP from satellite remotely sensed data of sea surface Chl a.
The average primary productivity in the shelf waters was the lowest in summer. The mean IP was 343$19 mgC m~2 d~1 for the shelf water with little variation across the shelf. In other seasons, there was a strong spatial variability. The outer shelf enjoyed a persistent supply of upwelled nutrients, which sustained a stable IP ranging from 601 to 733 mgC m~2 d~1. The inner shelves showed the highest IP in spring, suggesting a mild spring bloom. After summer, the IP in the middle and outer shelf bounced back to about 733}778 mgC m~2 d~1, but that in the inner shelf remained low (363 mgC m~2 d~1) probably owing to light-limitation in the turbid water col-umn. In spite of the spatial variability in various seasons, the annual mean IP values across the shelf were surprisingly uniform, 513}576 mgCm~2 d~1 with an overall mean IP of 549$84 mgC m~2 d~1 for the whole shelf in the southern ECS. The IP in the o!shore water showed a slight seasonal variation, ranging between 276 and 309 mgC m~2 d~1 with a mean annual IP of 292$15 mgC m~2 d~1.
Acknowledgements
The authors wish to thank Mr. B.-W. Wang and K.-J. Liu for assistance with nutrient and chlorophyll analyses. We are also grateful to the captain and crews of the R/V Ocean Research I and II for technical assistance on board. This research was supported by the National Science Council grants of NSC 85-2611-M-019-014 K2, NSC86-2611-M-019-008 K2 (to GCG) and NSC88-2611-M-002-001 (to KKL). This is National Center for Ocean Researche (NCOR) Contribution Number 13. The sugges-tions and comments from Dr. R. Sombrotto and Dr. L. Tupas are very appreciated.
References
Austin, R.W., Petzold, T.J., 1981. The determination of the di!use attenuation coe$cient of sea water using the coastal zone color scanner. In: Gower, J.F.R. (Ed.), Oceangraphy from Space. Plenum Press, New york, pp. 239}256.
Beardsley, R.C., Limeburner, R., Yu, H., Cannon, G.A., 1985. Discharge of the Changjiang (Yangtze River) into the East China Sea. Continental Shelf Research 4, 57}76.
Behrenfeld, M.J., Falkowski, P.G., 1997. Photosynthetic rates derived from satellite-based chlorophyll concentration. Limnology and Oceanography 42, 1}20.
Chang, J., 1996. The estimation of phytoplankton growth rate and its roles in the carbon cycle in the southern East China Sea using the dilution culture method (2). In: Proceeding of 1996 Workshop for Oceanographic Research Programs. Taichung, Taiwan, pp. 140}144.
Chao, S.-Y., 1991. Circulation of the East China Sea, a numerical study. Journal of Oceanographic Society of Japan 46, 273}295.
Chen, Y.-L.L., 1994. The importance of temperature and nitrate to the distribution of phytoplankton in the Kuroshio-induced upwelling northeast of Taiwan. Proceedings of the National Science Council (ROC), Part B 18, 44}51.
Chen, Y.-L.L., 1995. Phytoplankton composition and productivity in response to the upwelling o! northeastern Taiwan. Proceedings of the National Science Council (ROC), Part B 19, 66}72. Chen, A.C.T., 1996. The Kuroshio intermediate water is the major source of nutrients on the East China Sea
continental shelf. Oceanologica Acta 5, 523}527.
Chern, C.-S., Wang, J., Wang, D.-P., 1990. The exchange of Kuroshio and East China Sea shelf water. Journal of Geophysical Research 95, 16 017}16 023.
Chuang, W.-S., 1986. A note on the driving mechanism of current in the Taiwan Strait. Journal of Oceanographic Society Japan 43, 355}361.
Chuang, W.-S., Liang, W.-D., 1994. Seasonal variability of intrusion of the Kuroshio water across the continental shelf northeast of Taiwan. Journal of Oceanography 50, 531}542.
Duce, R.A., Tindale, N.W., 1991. Atmospheric transport of iron and its deposition in the ocean. Limnology and Oceanography 36, 1715}1726.
Edmond, J.M., Spivack, A., Grant, B.C., Hu, M.-H., Chen, Z., Chen, S., Zeng, X., 1985. Chemical dynamics of the Changjiang estuary. Continental Shelf Research 4, 17}36.
Eppley, R.W., Stewart, E., Abbott, M.R., Heyman, U., 1985. Estimating ocean primary production from satellite chlorophyll. Introduction to regional di!erences and statistics for the southern California Bight. Journal of Plankton Research 7, 57}70.
Geider, R.J., 1987. Light and temperature dependence of the carbon to chlorophyll a ratio in microalgae and cyanobacteria: implications for physiology and growth of phytoplankton. New Phytology 106, 1}34.
Gong, G.-C. (1992) Chemical hydrography of the Kuroshio front in the sea northeast of Taiwan. Ph.D. Thesis, Institute of Oceanography, National Taiwan University.
Gong, G.-C., Chang, J., Wen, Y.-H., 1999. Estimation of annual primary production in the Kuroshio waters northeast of Taiwan using a photosynthesis-irradiance model. Deep-Sea Research 46, 93}108.
Gong, G.-C., Chen, Y.L., Liu, K.-K., 1996. Chemical hydrography and Chl a distribution in the East China Sea in summer: implications in nutrient dynamics. Continental Shelf Research 16, 1561}1590. Gong, G.-C., Liu, K.-K. (1995). The relationship between mean chlorophyll a concentration within one
optical depth and euphotic zone integrated biogenic matters. In: Proceedings of Space Remote Sensing of Subtropical Oceans (SRSSO), Taipei, Taiwan, pp. 15A3-7-15A3-10.
Gong, G.-C., Liu, K.-K., Pai, S.-C., 1995a. Prediction of nitrate concentration from two end member mixing in the southern East China Sea. Continental Shelf Research 15, 827}842.
Gong, G.-C., Shiah, F.-K., Liu, K.-K., Chuang, W.-S., Chang, J., 1997. E!ect of the Kuroshio intrusion on the chlorophyll distribution in the southern East China Sea north of Taiwan during spring, 1993. Continental Shelf Research 17, 79}94.
Gong, G.-C., Shyu, C.-Z., Shin, W.-H., Liu, K.-K., 1992. Temperature #uctuation of the cold water o! northern Taiwan: June}December, 1990. Acta Oceanographica Taiwanica 28, 118}127.
Gong, G.-C., Yang, W.-R., Chang, J., 1995b. In vivo #uorescence-derived Chl a concentration in the southern East China Sea. Acta Oceanographica Taiwanica 34, 73}85.
Gong, G.-C., Yang, W.-R., Wen, Y.-H., 1993. Correlation of chlorophyll a concentration and Sea Tech #uorometer #uorescence in seawater. Acta Oceanographica Taiwanica 31, 117}125.
Hayward, T.L., Venrick, E.L., 1982. Relation between surface chlorophyll, integrated chlorophyll and integrated primary production. Marine Biology 69, 247}252.
Huang, K.-M., Lin, S., 1995. The carbon-sul"de-iron relationship and sulfate reduction rate in the East China Sea continental shelf sediments. Geochemical Journal 29, 301}315.
Liu, K.-K., Gong, G.-C., Lin, S., Shyu, C.-Z., Yang, C.-Y., Wei, C.-L., Pai, S.-C., Wu, C.-K., 1992a. The year-round upwelling at the shelf break near the northern tip of Taiwan as evidenced by chemical hydrography. Terrestrial, Atmospheric and Oceanic Sciences 3, 234}276.
Liu, K.-K., Gong, G.-C., Lin, S., Shyu, C.-Z., Pai, S.-C., Wei, C.-L., Chao, S.-Y., 1992b. Response of Kuroshio upwelling to the onset of northeast monsoon in the sea north of Taiwan: observations and a numerical simulation. Journal of Geophysical Research 97, 12 511}12 526.
Liu, K.-K., Pai, S.-C., Yang, C.-Y., Wei, C.-L., Gong, G.-C., 1993. Nitrate distribution in the sea north of Taiwan during period of northeastern monsoon. In: Su, J., Chuang, W.-S., Hsueh, Y. (Eds.), Proceedings Conference on Physical and Chemical Oceanography of the China Seas. China Ocean Press, Beijing, pp. 510}521.
Liu, K.-K., Lai, Z.-L., Gong, G.-C., Shiah, F.-K., 1995. Distribution of particulate organic matter in the southern East China Sea: implications in production and transport. Terrestrial, Atmospheric and Oceanic Sciences 6, 27}45.
Longhurst, A.R., Harrison, W.G., 1989. The biological pump: pro"les of plankton production and consumption in the upper ocean. Progress in Oceanography 22, 47}123.
Lorenzen, C.J., 1970. Surface chlorophyll as an index of the depth, chlorophyll content and primary productivity of the euphotic layer. Limnology and Oceanography 15, 479}480.
Mantyla, A.W., Venrick, E., Hayward, T., 1995. Primary production and chlorophyll relationships, derived from ten years of CALCOFI measurements. CALCOFI Report 36, 159}166.
Martin, J.H., 1991. Iron as a limiting factor. In: Falkowski, P. (Ed.), Primary Productivity and Bio-geochemical Cycles in the Sea. Plenum Press, New York, pp. 123}137.
Menzel, D.W., Pomeroy, L.R., Lee, T.N., Blanton, J.O., Alexander, C.R., 1993. Chapter 1 Introduction. In: Menzel, D.W. (Ed.), Ocean Processes: U.S. Southeast Continental Shelf. U.S. Department of Energy, O$ce of Scienti"c and Technological Information, Oak Ridge, TN, pp. 1}8.
Morel, A., 1991. Light and marine photosynthesis: a spectral model with geochemical and climatological implications. Progress in Oceanography 26, 263}306.
Pai, S.-C., Gong, G.-C., Liu, K.-K., 1993. Determination of Dissolved Oxygen in Seawater by Direct Spectrophotometry of Total Iodine. Marine Chemistry 41, 343}351.
Parsons, T.R., Maita, Y., Lalli, C.M., 1984. A Manual of Chemical and Biological Methods for Seawater Analysis. Pergamon Press, New York.
Platt, T., Sathyendranath, S., Caverhill, C.M., Lewis, M.R., 1988. Ocean primary production and available light: further algorithms for remote sensing. Deep Sea Research 35, 855}879.
Ryther, J.H., Yentsch, C.S., 1957. The estimation of phytoplankton production in the ocean from chloro-phyll and light data. Limnology and Oceanography 2, 281}286.
Shaw, P.T., 1989. The intrusion of water masses into the southwest of Taiwan. Journal of Geophysical Research C 12, 18 213}18 226.
Shiah, F.-K., Gong, G.-C., Liu, K.-K., 1995. A preliminary survey on primary productivity measured by the 14C assimilation method in the KEEP area. Acta Oceanographica Taiwanica 34, 1}15.
Shiah, F.-K., Gong, G.-C., Liu, K.-K., 1996. Light e!ect on phytoplankton photosynthetic performance in the southern East China Sea north of Taiwan. Botanical Bulletin of Academica Sinica 37, 133}140.
Smith, R.C., Baker, K.S., 1978. The bio-optical state of ocean waters and remote sensing. Limnology and Oceanography 23, 247}259.
Strickland, J.D.H., Parsons, T.R., 1972. A practical handbook of seawater analysis. Fisheries Research Board of Canada, Ottawa, Canada.
Tang, T.-Y., Yang, Y.-T., 1993. Low frequency current variability on the shelf break northeast of Taiwan. Journal of Oceanography 49, 193}210.
Walsh, J.J., 1988. On the Nature of Continental Shelves. Academic Press, San Diego.
Wang, J., Chern, C.-S., 1988. On the Kuroshio branch in the Taiwan strait during wintertime. Progress in Oceanography 21, 469}491.
Wong, G.T.-F., Pai, S.-C., Liu, K.-K., Liu, C.-T., Chen, C.-T.A., 1991. Variability of the chemical hydrogra-phy at the frontal region between the East China Sea and the Kuroshio northeast of Taiwan. Estuarine Coastal Shelf Science 33, 105}120.
Yoder, J.A., Atkinson, L.P., Bishop, S.S., Blanton, J.O., Lee, T.N., Pietrafesa, L.J., 1985. Phytoplankton dynamics within Gulf Stream intrusions on the southeastern United States continental shelf during summer 1981. Continental Shelf Research 4, 611}635.
Yoder, J.A., Verity, P.G., Bishop, S.S., Hoge, F.E., 1993. Phytoplankton Chl a, primary production and nutrient distributions across a coastal frontal zone o! Georgia, U.S.A.. Continental Shelf Research 2/3, 131}141.
![Fig. 1. Station locations for the KEEP-Box ( h), KEEP-Key (m) cruises and Cruise 414 (]).](https://thumb-ap.123doks.com/thumbv2/9libinfo/8774541.213444/2.699.84.621.573.970/fig-station-locations-box-h-key-cruises-cruise.webp)