Sedimentation in the Southern Okinawa Trough
— Rates,
turbidites and a sediment budget
Chih-An Huh
a,⁎
, Chih-Chieh Su
b, Chung-Ho Wang
a, Shih-Yu Lee
c,
In-Tian Lin
b aInstitute of Earth Sciences, Academia Sinica, Nankang, Taipei, Taiwan, ROC b
Institution of Oceanography, National Taiwan University, Taipei, Taiwan, ROC c
Department of Geological Sciences, University of Michigan, Ann Arbor, MI 48109, USA Received 24 November 2005; received in revised form 16 May 2006; accepted 31 May 2006
Abstract
Forty-seven box cores collected from the westernmost part of the Southern Okinawa Trough were analyzed for fallout radionuclides (210Pb and137Cs) and sedimentary properties to study sedimentation rates and dynamics. The results indicate steady hemipelagic sedimentation in the lower slope and deep basin at water depths below ca. 1000 m, with sedimentation rates generally decreasing with increasing water depth or distance offshore barring a localized depression below the 1400 m isobath where sediment deposition is enhanced by episodic inputs of turbidites. The time of deposition of various turbidite layers can be dated circa 2002, 1986, 1966, 1959, 1947 and 1922 AD, which can be correlated not only spatially among sites but also temporally with the history of major submarine earthquakes in and around the region.
Based on the distribution of sedimentation rates at 52 sites, including five with sediment trap-measured rates, a finite element approach was used to calculate the budget of sediment. Although the study area in the Southern Okinawa Trough occupies less than 10% of the Okinawa Trough's area, it receives more sediment than the rest of the Okinawa Trough. However, sediment deposited in the study area, approximately 14 MT annually, accounts for only 5% of the sediment discharged from Taiwanese rivers and barely matches the annual load discharged from the nearby Lanyang River. Thus, the Southern Okinawa Trough as a sink for sediment in the continental margin accretion wedge is not as important as generally speculated.
© 2006 Elsevier B.V. All rights reserved.
Keywords: sedimentation; Okinawa Trough; submarine earthquake; turbidite;210Pb;137Cs
1. Introduction
The westernmost part of the Southern Okinawa Trough (SOT) is located at a convergent plate margin bordered by the Ryukyu Arc to the south, the East China Sea (ECS) shelf to the north, and Taiwan to the west (Fig. 1a). Due to the advancement of the Philippine Sea
plate (PSP) toward the northwest at a mean rate of ∼7 cm yr− 1, the subduction of the PSP underneath the
Eurasian continental plate, and backarc rifting of the SOT at a mean extension rate of 1–2 cm yr− 1, this part
of the plate boundary is tectonically extremely active, with frequent seismic activities (Seno et al., 1993; Lallemand et al., 1997; Park et al., 1998).
Concerning the transport of water and particles, this area is certainly among the most dynamic in the world oceans due to the passage of Kuroshio and its interaction
⁎ Corresponding author. Tel.: +886 2 2783 9910; fax: +886 2 2783 9871. E-mail address:huh@earth.sinica.edu.tw(C.-A. Huh).
0025-3227/$ - see front matter © 2006 Elsevier B.V. All rights reserved. doi:10.1016/j.margeo.2006.05.009
with the highly rugged topography.Fig. 1b depicts that, as the northbound Kuroshio flows into the SOT over the sill between Taiwan and the Ryukyu Arc, it collides onto the ECS shelf and bifurcates, with its mainstream di-verting to the east and the western branch upwelling and swirling to form a perennial eddy northeast of Taiwan (Tang and Yang, 1993; Tang et al., 1999).
In view of the proximity of the SOT to the ECS shelf and Taiwan (as prominent sources of sediment), the to-pography of the SOT (which is a rather confined basin) and the hydrodynamic conditions induced by the inter-action of the Kuroshio with the topography (which facilitates cross-shelf and downslope transport), the basin has been speculated to be a important sink of sediments at the shelf edge (Wong et al., 2000). Previous studies have shown that sedimentation over much of the shelf, canyon, and slope regions above∼1000 m water depth and around the SOT are unsteady, with erosion and deposition taking place sporadically at highly variable rates, making it difficult or impossible to determine sedimentation rates by the 210Pb method (Chen, 1995; Lee, 2000). By contrast, at the lower slope (>1000 m) and the deep basin with gentle seafloor gradient, sedimentary profiles of 210Pb often reflect steady accumulation of sediment on decadal to centennial time scales.
It is worthwhile mentioning that sediment trap-measured fluxes at five sites away from Taiwan, roughly along the axis of SOT, decrease from∼2.5 g cm− 2yr− 1 at a water depth of ∼1000 m directly off the Lanyang River's mouth to∼0.1 g cm− 2yr− 1at water depths of ∼1600 m further to the east (at ∼123°E) (Chung and Hung, 2000; Chung et al., 2003). These trap-measured fluxes compare favorably with those determined from sediment cores byLee et al. (2004). Except in a major turbidite zone unveiled in this study (to be discussed later), both sediment core and near-bottom sediment trap data show that sedimentation rates generally decrease with increasing water depth or distance off northeastern Taiwan. It is especially important to note that sedimen-tation rates in the SOT are much higher than those previously reported further to the east and north in the Okinawa Trough, which usually fall in the range 0.01– 0.03 cm yr− 1(Lou and Chen, 1996; Shieh et al., 1997; Sawada and Handa, 1998; Ujiié and Ujiié, 1999; Jian et al., 2000; Oguri and Matsumoto, 2000; Xiong et al., 2005) and are likely less than 0.01–0.03 g cm− 2yr− 1. Thus, SOT is obviously an area of focused sedimenta-tion in the Okinawa Trough. It then follows the question: how efficient is the SOT in trapping sediment from nearby sources?
Despite all the data reported to date, the pattern of sedimentation rates in the SOT is still too fragmentary to address the question posed above. The purpose of this study is to fill the data gaps to: (1) present an overview of sedimentation dynamics in the SOT and (2) evaluate the capacity of the basin in trapping sediments in this continental margin accretion wedge. To achieve this goal, we have since 2000 surveyed the SOT and col-lected 47 box cores for the determination of sedimen-tation rates and its spatial variation.
2. Materials and methods
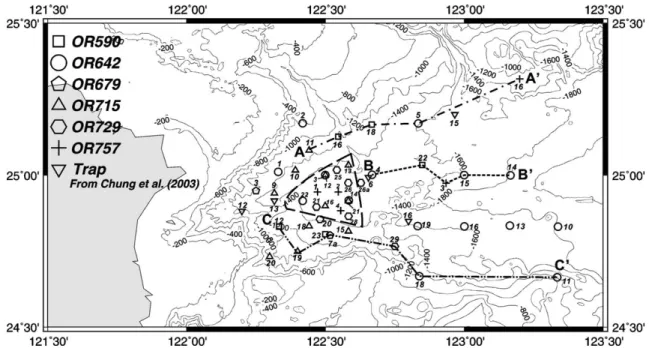
Box cores were collected in 2000–2005 during six cruises onboard R/V Ocean Researcher-I: OR590 (July 23–27, 2000), OR642 (April 24–30, 2002), OR679 (April 17–24, 2003), OR715 (April 13–18, 2004), OR729 (September 4–9, 2004) and OR757 (June 26–July 2, 2005). For this study, we have judicially selected cores recovered with the sediment–water interface undisturbed, as evidenced by fairly clear water above sediments in the box corer.Fig. 2shows locations of the selected cores.
After the overlying water was siphoned out, core barrels (11.4 cm i.d.; 60 cm in length) were pushed into the box to take subcores. In addition, slabs were taken from sides of some box cores for X-ray radiograph and particle size analysis to study sediment structure. Sediments in the
Fig. 1. (a) The upper left inset is a schematic representation of lithospheric plates and geotectonic framework around Taiwan. OT: Okinawa Trough below the 1000 m isobath; SOT: Southern Okinawa Trough; ECS: East China Sea shelf; Rar: Ryukyu arc; Rtr: Ryukyu trench; EAP: Eurasian plate; PSP: Philippine Sea plate. (b) Enlarged part showing the flow path of Kuroshio and epicenters of large (ML> 6.5) earthquakes off eastern Taiwan (stars) which are most probable triggers of seismoturbidites in the SOT. The numbers marked by the stars follow the order listed inTable 1.
subcores were then (usually within an hour) extruded on-board with a hydraulic jack and sectioned at 1-cm or 2-cm intervals for radionuclide analysis, as described in Huh et al. (2004). The sectioned samples were sealed in plastic jars (i.d., 8.5 cm; height, 7.5 cm) and kept frozen until freeze-drying in the home laboratory. Based on weight loss after freeze-drying, water contents (hence, porosity) of the wet sediments were determined. The data reported in this paper are calculated based on salt-free dry weight.
137
Cs, 210Pb and 214Pb (a precursor of 210Pb, used as an index of supported210Pb) were simultaneously mea-sured by γ-spectrometry based on photon energies at 661.62 keV, 46.52 keV and 351.99 keV, respectively. Four gamma spectrometry systems were used for this study: one 150% efficiency (relative to 3 × 3 NaI) HPGe detector (EG and G ORTEC GEM-150230) and three 100% efficiency (EG and G ORTEC GMX-100230) detectors, each interfaced to a digital gamma-ray spectrometer (DSPec Plus®). The detectors were calibrated using IAEA standards 133A, 327 and 375 for sample weight at 100 g as a reference, coupled with an in-house working standard for various masses from 10 g to 250 g.
At the earlier stage of this work when our lab had only one GMX detector, we also resorted to alpha spec-trometry for the determination of210Pb (via210Po, with
209
Po added as the yield determinant) so as to attain a desirable data output. The consistency between alpha-and gamma-spectrometry for the determination of210Pb
was insured by analysis of standards and selected samples by both methods. The detailed radiochemical and data reduction procedures are similar to those des-cribed previously (Huh et al., 1987, 1990, 1996; Huh and Su, 1999; Su and Huh, 2002).
3. Results and discussion
Space limitation does not allow us to tabulate the mas-sive data here; which can be found at the websitehttp://dmc. earth.sinica.edu.tw/Contributor/Huh/Huh_et_al2006a/. In the following discussion, we use figures to highlight the major points.
3.1. Sedimentation rates
Sedimentation rates were determined primarily by
210
Pb, with the common assumption that fluxes of sediment and the associated 210Pb are reasonably constant on decadal to centennial timescales at a given site. Thus, from the trend of decrease of 210Pb with depth in core, which represents the decay of excess
210
Pb (210Pbex=210Pb−214Pb) following burial,
sedi-mentation rates can be estimated. In a few cores near the base of the slope, some extent of sediment mixing can be noted from the distribution of210Pb near core top. When calculating sedimentation rates at such sites, the surface mixed layer was excluded.
Fig. 2. Map showing seafloor bathymetry and localities of sediment cores used for this study. Coring sites in different cruises are denoted by different symbols. The numbers marked by the coring sites represent box core numbers. The triangle outlines the“turbidite zone” discussed in the text. A–A′, B–B′ and C–C′ indicate three transects beyond the turbidite zone, which are chosen to illustrate the change of sedimentation rates with distance off Taiwan, as shown inFig. 3.
Fig. 3shows profiles of excess210Pb and spatial trend of sedimentation rates thus derived along three E–W transects marked inFig. 2. Beyond the turbidite zone (to be discussed later), sedimentation rates in the SOT generally decrease toward the east with increasing water depth or distance off northeastern Taiwan (see the
bottom plot inFig. 3). Only in the eastern edge of our study area (to the east of 123°E) are the measured rates close to, but still higher than, those reported elsewhere in the Okinawa Trough.
In addition to 210Pb, it is often possible to measure
137
Cs, another potential sediment chronometer,
simulta-Fig. 3. Profiles of excess210Pb along three transects (A–A′, B–B′, and C–C′, as marked inFig. 2). The plot at the bottom shows decrease of sedimentation rates toward the east along A–A′ (
▪
), B–B′ (+), and C–C′ (▴).neously by gamma spectrometry. 137Cs is a transient tracer produced by human activities since the early 1950s. The global fallout of137Cs peaked in 1963 AD, one year following the most intense atmospheric nuclear tests in 1962 AD. This fallout maximum caused a pronounced subsurface peak of 137Cs commonly seen in sediment cores, which may be taken as a time marker of 1963 AD, thus providing an independent check on 210Pb-derived chronology in the past four to five decades. We have reported previously that sedimentation rates in the SOT estimated by both methods agree reasonably well (Huh et al., 2004), although 137Cs-derived rates tend to be slightly lower than210Pb-derived rates in the deep basin due to different affinity for particles, hence different residence times in the water column, between these two nuclides (Lee et al., 2004).
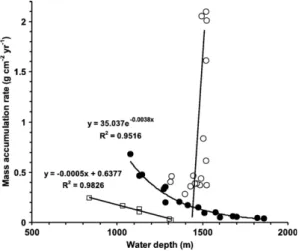
By plotting210Pb-based mass accumulation rate versus water depth (Fig. 4), we can differentiate three groups of data representing distinct sedimentation regimes, which we term “slope”, “hemipelagic” and “turbidite” in the fol-lowing discussion. Profiles of210Pbexin the slope and the
hemipelagic regimes regularly show exponential decrease with depth, indicating fairly constant sedimentation at each site. However, at equivalent water depths, sedimentation rates over the slope are consistently lower than those in the hemipelagic regime, probably suggesting that certain frac-tions of sediment falling on the slope region must have been lost to the basin floor constantly either by downslope winnowing or by advective transport. It is interesting to note that the decrease of sedimentation rates with water depth follows an exponential-like trend (R2= 0.952, n = 16) in the vast hemipelagic regime but it is linear (R2= 0.983, n = 6) in the narrow slope regime (Fig. 4).
Profiles of210Pb in the turbidite regime are charac-terized by a zigzag pattern superimposed on an overall decrease of210Pb with depth, which is caused by layers of turbidites intercalating hemipelagic sediments within the length of the box cores. Because of episodic inputs of turbidites, sedimentation rates in the turbidite zone are substantially enhanced (Fig. 4). More details about the spatial and temporal distribution of turbidites in the SOT, as well as the use of turbidites to help constrain sediment chronology, will be discussed later.
Between the sedimentation regimes mentioned above and the coast are Lanyang River's estuary, subaqueous delta and submarine canyon. These areas are influenced not only by fluvial processes, but also by strong tides and the passage of Kuroshio (Hong and Chen, 2000). Sediments in these environments are coarse-grained and often disturbed by storm activities. Our data (not reported here) suggest that there is probably no net sedimentation in this dynamic region.
3.2. Temporal and spatial distribution of turbidites in the Southern Okinawa Trough
Since our initial recovery in 2002 of SOT sediment cores containing turbidites, we have continuously surveyed the SOT in subsequent years and delineated a major turbidite zone occupying a localized area of ∼300 km2
. The area emerged as a triangle-shaped depression below the 1400 m isobath in the western part of SOT, surrounded by topographic highs in the east and by slopes of the SOT at other sides (Fig. 2). Conceivably, the seafloor morphology renders this semi-enclosed area an efficient receptacle for sediments transported downslope from the north, the west, and the south, with further transport to deeper waters hindered by localized topographic highs in the east.
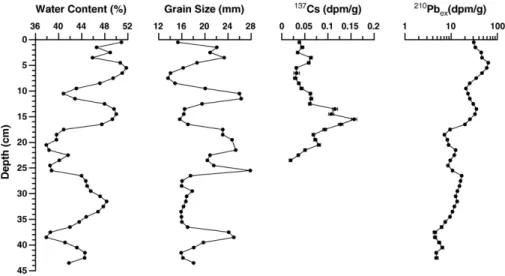
Fig. 5 shows downcore profiles of water content, grain size, 137Cs and 210Pbex in core OR757 BC1 as
an example (more data and profiles throughout the SOT can be seen at http://dmc.earth.sinica.edu.tw/ Contributor/Huh/Huh_et_al2006a/). Turbidite layers are characterized by coarser particle size, lower water content, and lower 210Pbex relative to
fine-grained ambient sediments. Based on 210Pb chronol-ogy and137Cs stratigraphy in the ambient hemipelagic sediments, the deposition time of each turbidite layer was estimated.
3.2.1. Spatial distribution of various turbidite sequences
Through correlation of the turbidite layers among the core sites, the turbidite zone can be further divided into
Fig. 4. Plot of210Pb-based mass accumulation rate versus water depth showing three distinct sedimentation regimes described in the text: slope (□), hemipelagic (
•
), and turbidite (○).three regions showing different sequences of episodic deposits. These are described below.
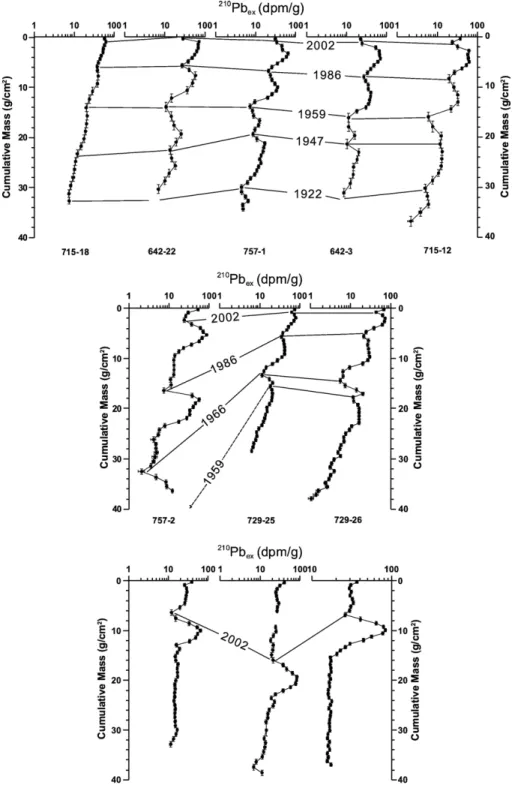
The first region is represented by cores in the western side of the turbidite zone (i.e., 715-18, 642-22, 757-1, 642-3, 715-12). This group of cores show a common sequence of turbidites deposited circa 2002, 1986, 1959 and 1947 AD, sometimes further back in 1922 AD (Fig. 6, top row). Note that 210Pbex profile in 715-18, the
westernmost core in this group, shows much weaker “kinks” which completely diminish in cores to its west. This suggests a lenticular structure of each turbidite unit which pinches out at the margins of the turbidite zone. Such a gradational shift from hemipelagic-dominated area toward the interior of the turbidite zone can guide our correlation of turbidite layers in a very important way. From the“tie lines” connecting the turbidite layers between cores, a framework is constructed to help constrain sediment chronology.
The second region is in the northeastern part of the turbidite zone, represented by cores 757-2, 729-25 and 729-26. In this region, the 1959 and 1947 events are absent (or are very vague) while another event circa 1966 AD (which existed above the 137Cs fallout maximum circa 1963 AD) caused a very pronounced turbidite deposit (Fig. 6, 2nd row). The third region falls in the southern part of the turbidite zone, exemplified by cores 729-21, 757-4 and 729-28. There is a relatively thin layer of hemipelagic sediment with high 210Pbex
sandwiched between thicker turbidite layers caused by the 2002 event near the top and the 1986 event at the bottom of the cores (Fig. 6, 3rd row). The impact of the 1986 event is especially significant; it caused a rather massive (> 20 cm in thickness) and well-mixed turbidite layer, with fairly constant210Pb.
Actually, there are no sharp boundaries between the three regions described above. For example, a transi-tion zone exists between the second and the third regions where cores 715-14, 715-16 and 642-21 show a mixed pattern, with features similar to that of the third region in the upper parts and more like that of the second region in the lower parts of the cores (profiles not shown).
In fact, we have previously reported the data for two of the twelve cores mentioned above, namely 642-22 and 642-3, and ascribed submarine earthquakes to be the cause for the turbidites (Huh et al., 2004). Now, with a much expanded dataset, we have not only substantiated the existence of these episodic deposits but also outlined their distribution in the SOT.
3.2.2. Spatial and temporal relationship between turbidites in the SOT and submarine earthquakes off eastern Taiwan
Summarized inTable 1are the precise dates, location and magnitudes of major submarine earthquakes off eastern Taiwan recorded since 1920 AD. A brief account of all observed turbidites in relation to their causative earthquakes is given below in reverse chronological order (i.e., from core tops downward).
3.2.2.1. 2002. This event, due to its recency in time, can be clearly identified at or near the tops of all cores collected in the turbidite zone from all cruises except OR-590, the only one conducted prior to 2002. The first cruise following this event, OR-642, was so close in timing (within a month) that this event produced a clear turbidite layer with much reduced210Pb activities at the core top. In subsequent years, this turbidite layer was
gradually covered by and mixed with more freshly de-posited hemipelagic sediments enriched in210Pb, result-ing in reduced near-surface depletion or a gradually deepened subsurface low of 210Pb.
3.2.2.2. 1986. This event resembles the 2002 event in many respects, with similar magnitudes and close epicenter locations. Although these two events are more distant and their magnitudes are relatively low
Fig. 6. Profiles of excess210Pb in the west (top), northeast (middle) and south (bottom) of the turbidite zone showing three distinct turbidite sequences discussed in the text.
(ML6.8) compared with other events listed in Table 1,
they had profound impact to the SOT and to the Taipei Basin. In this regard, it is relevant to point out that no turbidites in the SOT can be related to the 1999 ML
7.3 Chi–Chi earthquake in central Taiwan. Thus, besides an earthquake's magnitude, its source, path and site effects may be important factors controlling ground motions (Chen, 2003).
Depths of the 1986 turbidite layer varied from < 10 cm to 20 cm below core tops in the studied cores, in proportion to either the rate of hemipelagic sedimentation (mainly in the northern part of the turbidite zone) or the massiveness of the turbidite deposits (as in the third region mentioned above). This event was the culprit of the breakage on Nov. 15, 1986 of two submarine cables, one between Taiwan and the Guam Island and the other between Taiwan and the Ryukyu Island.
3.2.2.3. 1966. This event was first discovered in the Ho-Ping Basin (Huh et al., 2004). The epicenter of this event is located on the Ryukyu Arc between the SOT in the north and a series of forearc basins in the south. Among the earthquake events identified in cores studied thus far, this nearby event is of the highest magnitude (ML= 7.8). The resulting turbidite is very pronounced in
the northeastern part but is vague or not found in the northwestern part of the SOT turbidite zone. The
absence of this signal may be explained either by a longer distance from the source, hence weakened ground motion, or by the short separation in time between the 1959 and 1966 events. It could be that, following the 1959 turbidite, which had a greater impact to the northwestern part of the SOT, a state of transient stability was attained in that region. Probably it would require a longer time from then to build up a condition for the next mass failure to be triggered.
3.2.2.4. 1959. The epicenter of the 1959 earthquake is within 40 m from the site of core 642-3. This event can be demarcated from the 1966 event using the subsurface
137
Cs peak as a time marker (of 1963 AD) in the cores. Although the turbidite triggered by this event is also widespread in the SOT turbidite zone, it is less distinct in the northeastern corner for reasons given above. 3.2.2.5. 1947. As with the 1959 earthquake, the epicenter of this event is also located in the SOT and the signal is more obvious in the northwestern part of the turbidite zone. Although this event was fairly close in time to a series of earthquakes of the same magnitude (ML= 7.1–7.4) happened in 1951 off Hualien, we
consider the 1951 events too close in time to account for the separation between this and the 1959 turbidite layer in the cores.
3.2.2.6. 1922. The epicenter of this event was located near the western end of the Ryukyu Arc, between the SOT and the Ho-Ping Basin. The turbidite layer resulting from this event is the oldest one that can be reliably dated by210Pb chronology.
3.2.3. Other isolated turbidites
Besides sequence of turbidites systematically con-centrated in the aforementioned area, there are also discrete turbidites scattered elsewhere around the SOT. For example, in the east of the turbidite zone, isolated signatures of the 2002, 1986, 1966, 1959 and 1922 events can be noted at various sites (e.g., 642-13, 14, 15, 16 and 19) on both sides of the Okinawa Trough rift valley. In the north, at the site of core 715-13, only the 1922 event is evident. At the sites of core 715-15 in the south and core 715-9 in the west of the turbidite zone, the signature of the 1947 event is rather conspicuous. 3.3. Flux of sediment in the deep SOT and its significance
As mentioned earlier, a primary goal of this study is to estimate sediment flux in the SOT. We made the attempt
Table 1
Historical record of large (ML> 6.5) submarine earthquakes off eastern Taiwana
Event No.
Time (y/m/d)
Epicenter latitude, longitude; depth (km) ML 1 2002/03/31 24.1398°N, 122.1915°E; 13.8 6.8 2 1986/11/14 23.992°N, 121.833°E; 15.0 6.8 3 1978/12/23 23.297°N, 122.0047°E; 4.1 7.0 4 1972/04/24 23.5118°N, 121.5325°E; 15.4 6.7 5 1966/03/12 24.24°N, 122.67°E; 42 7.8 6 1963/02/13 24.4°N, 122.1°E; 47 7.4 7 1959/04/26 25.0°N, 122.5°E; 150 7.5 8 1951/11/24 23.275°N, 121.35°E; 36 7.3 9a 1951/10/22 23.8°N, 121.9°E; 20 7.1 9b 1951/10/22 24.1°N, 121.7°E; 30 7.2 9c 1951/10/22 23.925°N, 121.725°E; 9 7.4 10 1947/09/26 24.8°N, 123.0°E; 110 7.2 11 1946/12/19 24.70°N, 122.5°E; 100 6.5 12 1922/09/14 24.6°N, 122.3°E; 20 7.2 13 1922/09/01 24.6°N, 122.2°E; 20 7.6 14 1920/06/05 24.0°N, 122.0°E; 20 8.0
Events typed in bold-face (i.e., #1, 2, 5, 10, 12 and 13) are those most probably causing seismoturbidites observed in the Southern Okinawa Trough.
aData source: Taiwan Central Weather Bureau's earthquake catalog (in Chinese) at:http://scman.cwb.gov.tw/eqv3/eq_report/seismisity.html.
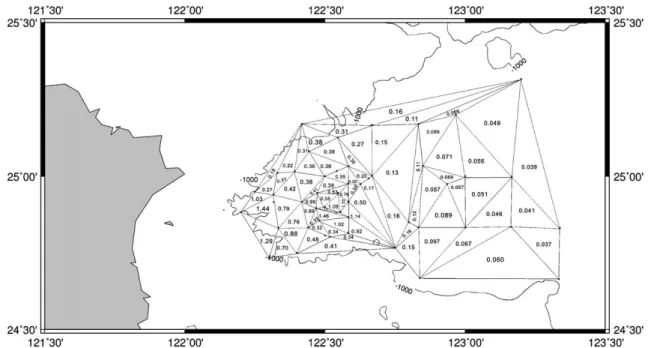
using a finite-element approach based on sedimentation rates from all (47) sediment cores summarized here and sediment trap-measured fluxes at five additional sites reported previously by others (Chung and Hung, 2000; Chung et al., 2003). Except two sediment core sites in the slope region, all other sites are located below the 1000-m isobath, which is the approximate depth below which the storage of sediment appears to be more steady and permanent. With a total of 52 geographic points laid out, a framework consisting of 75 triangular grids and covering 5700 km2is configured (Fig. 7). This area is considered to be the ultimate sink in the SOT receiving sediments exported from the nearby ECS shelf and Taiwan.
A mean sedimentation rate is calculated for each triangular area by averaging sedimentation rates at three apices of each triangle. Multiplying the area of each triangle by the mean sedimentation rate within it yields the flux of sediment within each grid area. The total flux of sediment from all 75 triangular elements thus cal-culated is approximately 1.4 × 10⁷ton/yr. With the area and sediment flux calculated for our study area, it is then pertinent to evaluate the role of the SOT in the entire Okinawa Trough.
The total area of the Okinawa Trough below the 1000 m isobath is 73,600 km2. Reported sedimentation rates elsewhere in the Okinawa Trough are 0.023 cm yr− 1 on average (Xiong et al., 2005), which is likely less than 0.02 g cm− 2 yr− 1 and at least one order of magnitude
lower than the mean flux of sediment to the SOT covered in this study (0.25 g cm− 2yr− 1). Thus, although our study area in the SOT occupies merely∼8% of the area of the Okinawa Trough, it traps as much sediment as, if not more than, the rest 92% of the Okinawa Trough.
From the perspective of ocean circulation and geomorphology, the SOT has been speculated to be an important sink for sediment exported from the ECS shelf and the island of Taiwan. Indeed, the SOT is not only a setting of enhanced particle scavenging and sedimentation, its sedimentary record also reveals recurrence of seismoturbidites and teleconnection between the equatorial Pacific and the western Pacific margin (Huh et al., 2004; Lee et al., 2004). However, the annual accumulation of 14 MT of sediment in our study area accounts for only 3.7–5.4% of the annual mean discharge from 21 Taiwan rivers, which is reported to be 260 MT/yr by Taiwan's Water Resources Agency (WRA, 1997) for the period 1949–1990, and 380 MT/yr by Dadson et al. (2003)
for the period 1979–1999. Among the 21 rivers, only the Lanyang River in the northeast of Taiwan empties its suspended load directly toward the SOT. According to different reports, Lanyang River's annual sediment discharge varies from 8 MT (WRA, 1997) to 17 MT (Dadson et al., 2003), more or less comparable to the amount of sediment delivered to our study area annually. From the above calculation and comparison,
Fig. 7. A framework configured to calculate sediment budget in the Southern Okinawa Trough covered by this study. Numbers shown are mean sedimentation rates (in g cm− 2yr−1) within individual triangular grids. The area-weighted mean sedimentation rate for the entire covered area is 0.25 g cm− 2yr− 1. See text for details.
we conclude that the SOT as a sink for sediment exported from Taiwan and the ECS shelf is not as important as previously thought.
4. Conclusions
Based on profiles of210Pb and137Cs in 47 box cores collected from the SOT, we have delineated spatial distribution of sedimentation rates and calculated sediment budget in the study area. In conjunction with sedimentary features, we have also outlined a major turbidite zone in the SOT. Detailed analyses of the results lead us to the following conclusions:
(1) Three distinct sedimentation regimes exist in the SOT: the slope and hemipelagic areas with nearly constant sedimentation and a turbidite zone with episodic deposition of turbidites in addition to hemipelagic sedimentation. With the turbidite zone excluded, sedimentation rates decrease with increas-ing distance (and water depth) toward the east. (2) Six turbidite events dated circa 2002, 1986, 1966,
1959, 1947 and 1922 AD are found in the SOT turbidite zone, but not all of them can be identified at any individual site. From the occurrence and timing of turbidites, the turbidite zone can be envisioned as a localized depression consisting of three“end-member” regions. The good agreement between our estimated deposition time of the turbidites and the history of major submarine earthquakes within or in the proximity of the SOT strongly argues that the observed turbidites represent earthquake-triggered events.
(3) Our data suggest that the western part of the SOT below the 1000 m isobath is by far the most important sink of sediment in the entire Okinawa Trough. However, the flux of sediment to that area, estimated to be 14 MT/yr, can account for only ∼5% of the total riverine discharge from Taiwan. Thus, the SOT is unlikely a major sink for sediment from Taiwan. Likewise, the entire Okinawa Trough is but a trivial repository for sediment from the ECS shelf.
Acknowledgements
We are thankful to S.-F. Lu, S.-T. Ho, Y.-S. Tong, C.-Y. Ling, L.-J. Shiao, C.-T. Hsieh, J.-Y. Chu, J.-Y. Cheng and W.-T. Liang for assistance at sea and/or in the laboratory. This work is supported by National Science Council Grants NSC90-2611-M-001-003, 91-2611-M-001-002, 92-2611-M-001-001, and 93-2611-M-001-001.
Appendix A. Supplementary data
Supplementary data associated with this article can be found, in the online version, atdoi:10.1016/j.margeo. 2006.05.009.
References
Chen, S.-K., 1995. Sediment accumulation rates and organic carbon deposition in the East China Sea Continental Margin sediments. M. S. Thesis, National Taiwan University, Taipei, Taiwan, 80 pp. Chen, K.-C., 2003. Strong ground motion and damage in the Taipei
basin from the Moho reflected seismic waves during the March 31, 2002, Hualien, Taiwan earthquake. Geophys. Res. Lett. 30 (11),
doi:10.1029/2003GL017193.
Chung, Y.-C., Hung, G.-W., 2000. Particle fluxes and transports on the slope between the southern East China Sea and the South Okinawa Trough. Cont. Shelf Res. 20, 571–597.
Chung, Y.-C., Chung, K., Chang, H.-C., Wang, L.-W., Yu, C.-M., Hung, G.-W., 2003. Variabilities of particulate flux and210Pb in the southern East China Sea and western South Okinawa Trough. Deep-Sea Res. II (50), 1163–1178.
Dadson, S.J., Hovius, N., Chen, Y.G., Dade, W.B., Hsieh, M.-L., Wilett, S.D., Hu, J.-C., et al., 2003. Links between erosion, runoff variability and seismicity in the Taiwan orogen. Nature 426, 648–651.
Hong, I., Chen, I.-S., 2000. Echo characters and sedimentary processes along a rifting continental margin, northeast of Taiwan. Cont. Shelf Res. 20, 599–617.
Huh, C.-A., Su, C.-C., 1999. Sedimentation dynamics in the East China Sea elucidated from210Pb,137Cs and239,240Pu. Mar. Geol. 160, 183–196.
Huh, C.-A., Zahnle, D.L., Small, L.F., Noshkin, V.E., 1987. Budgets and behaviors of uranium and thorium series isotopes in Santa Monica Basin sediments. Geochim. Cosmochim. Acta 51, 1743–1754.
Huh, C.-A., Small, L.F., Niemnil, S., Finney, B.P., Hickey, B.M., Gorsline, D.S., Williams, P.M., 1990. Sedimentation dynamics in the Santa Monica–San Pedro Basin off Los Angeles: radiochem-ical, sediment trap and transmissometer studies. Cont. Shelf Res. 10, 137–164.
Huh, C.-A., Chu, K.-S., Wei, C.-L., Liew, P.-M., 1996. Lead-210 and plutonium fallout in Taiwan as recorded at a subalpine lake. J. Southeast Asian Earth Sci. 14, 373–376.
Huh, C.-A., Su, C.-C., Liang, W.-T., Ling, C.-Y., 2004. Linkages between turbidites in the southern Okinawa Trough and submarine earthquakes. Geophys. Res. Lett. 31 (L12304), doi:10.1029/ 2004GL019731.
Jian, Z., Wang, P., Saito, Y., Wang, J., Pflaumann, U., Oba, T., Cheng, X., 2000. Holocene variability of the Kuroshio Current in the Okinawa Trough, northwestern Pacific Ocean. Earth Planet. Sci. Lett. 2000, 305–319.
Lallemand, S., Liu, C.-S., Font, Y., 1997. A tear fault boundary between the Taiwan orogen and the Ryukyu subduction zone. Tectonophysics 274, 171–190.
Lee, S.-Y., 2000. Sedimentation dynamics off northeastern Taiwan elucidated from fallout nuclides. M.S. Thesis, National Taiwan University, Taipei, Taiwan, 63 pp.
Lee, S.-Y., Huh, C.-A., Su, C.-C., You, C.-F., 2004. Sedimentation in the Southern Okinawa Trough: enhanced particle scavenging and
teleconnection between the equatorial Pacific and western Pacific margins. Deep-Sea Res., Part 1, Oceanogr. Res. Pap. 51 (11), 1769–1780.
Lou, J.-Y., Chen, A.C.-T., 1996. A paleoenvironmental record during 7– 21 ka BP in the sediments off northern Taiwan. Le Mer 34, 237–245. Oguri, K., Matsumoto, E., 2000. Evidence for the offshore transport of terrestrial organic matter due to the rise of sea level: the case of the East China Sea continental shelf. Geophys. Res. Lett. 27 (23), 3893–3896. Park, J.O., Tokuyama, H., Shinohara, M., Suyehiro, K., Taira, A., 1998. Seismic record of tectonic evolution and backarc rifting in the southern Ryukyu island arc system. Tectonophysics 294 (1–2), 21–42. Sawada, K., Handa, N., 1998. Variability of the path of the Kuroshio
ocean current over the past 25,000 years. Nature 392, 592–595. Seno, T., Stein, S., Gripp, A.E., 1993. A model for the motion of the
Philippine Sea plate consistent with the NUVEL-1 and geologic data. J. Geophys. Res. 98 (B10), 17941–17948.
Shieh, Y.-T., Wang, C.-H., Chen, M.-P., Yung, Y.-L., 1997. The last glacial maximum to Holocene environmental changes in the southern Okinawa Trough. J. Asian Earth Sci. 15, 3–8.
Su, C.-C., Huh, C.-A., 2002.210Pb,137Cs and239,240Pu in East China Sea sediments: sources, pathways and budgets of sediments and radionuclides. Mar. Geol. 183, 163–178.
Tang, T.-Y., Yang, Y.-C., 1993. Low frequency current variability on the shelf break northeast of Taiwan. J. Oceanogr. 49, 193–210. Tang, T.-Y., Hsueh, Y., Yang, Y.-J., Ma, J.-C., 1999. Continental slope
flow northeast of Taiwan. J. Phys. Oceanogr. 29, 1353–1362. Ujiié, H., Ujiié, Y., 1999. Late Quaternary course changes of the
Kuroshio Current in the Ryukyu Arc ridge, northwestern Pacific Ocean. Mar. Micropaleontol. 37, 23–40.
Wong, G.T.F., Chao, S.-Y., Li, Y.-H., Shiah, F.-K., 2000. The Kuroshio edge exchange processes (KEEP) study — an introduction to hypotheses and highlights. Cont. Shelf Res. 20, 335–347. WRA (Water Resources Agency), 1997. Hydrological Year Book of
Taiwan: Republic of China, 1996. Ministry of Economic Affairs, Taiwan. 415 pp.
Xiong, Y.A., Liu, Z.X., Li, T.G., Liu, Y.G., Yu, H., 2005. The sedimentation rates in the Okinawa Trough through the Late Quaternary. Acta Oceanol. Sin. 24 (4), 146–154.