行政院國家科學委員會專題研究計畫 成果報告
一個高效率之 MPEG-7 紋理瀏覽描述子的計算法及其於紋理
瀏覽和紋理檢索之應用(2/2)
計畫類別: 個別型計畫 計畫編號: NSC93-2213-E-009-047- 執行期間: 93 年 08 月 01 日至 94 年 07 月 31 日 執行單位: 國立交通大學資訊科學學系(所) 計畫主持人: 陳玲慧 報告類型: 完整報告 報告附件: 出席國際會議研究心得報告及發表論文 處理方式: 本計畫可公開查詢中 華 民 國 94 年 8 月 4 日
中文摘要 本計畫係為二年期之計畫,其主要目的在發展一個 MPEG-7 紋理瀏覽描述 子的計算法,並將之應用於紋理瀏覽和紋理檢索。一個 MPEG-7 的紋理瀏覽描 述子主要包括三部分,即紋理之規律度,方向及紋理在兩個主要方向之大小。在 第一年的專案中,我們已提出一個紋理粗分類法,以提供計算紋理之規律度所需 之方法。在第二年的專案中,我們提出一演算法以進一步計算紋理之方向及其在 兩個主要方向之大小,以完成整個 MPEG-7 紋理瀏覽描述子的計算。在本階段 中我們已整合其他用於紋理比對之描述子(如 wavelet 特徵),以驗證所提出方法 在運用於紋理瀏覽和紋理檢索時之效能。 基於上述之紋理粗分類法,我們提出一個 MPEG-7 紋理瀏覽描述子的計算 法,包括紋理規律度,紋理方向及紋理大小的計算。我們運用上述將紋理影像分 類為週期性或隨機性的方法來計算 MPEG-7 標準中所規範的紋理規律度。對於 高規律紋理,我們利用霍夫曼轉換來算出兩個紋理影像的主要排列方向。我們也 說明如何求出在這兩個方向上的紋理大小。此外我們會利用上述紋理粗分類法中 所提到的主軸分析來求出方向性紋理中唯一的方向。 關鍵詞:紋理瀏覽 紋理分類 紋理檢索 MPEG-7 Abstract
The goal of this project is to develop a computation method of MPEG-7 texture browsing descriptor and apply it to texture browsing and texture retrieval. The MPEG-7 texture browsing descriptor primarily consists of three major components: (1) the regularity of the texture, (2) the directionality of the texture, (3) the scales corresponding to the two dominant directions of the texture. To successfully compute these three components, we have developed corresponding computation methods in two years. In the first year, we have provided a coarse classification method for textures to provide the algorithms needed to determine the regularity of textures. It has also been shown that the intermediate results of the proposed method can be used to derive a weighting scheme for texture retrieval.
We have developed an efficient computation method for the texture browsing descriptor of MPEG-7. Based on the above-mentioned coarse classification method for classifying periodic and random textures, a regularity measure is developed. For regular textures, the two dominant directions of textures are extracted by performing Hough transform on the Fourier spectrum. A scale computation method is then provided to determine the scales corresponding to the two dominant directions. In
addition, the principal component analysis is used to detect textures with only one dominant direction. The proposed methods can be used for texture browsing, texture retrieval and digital library.
Keywords: Texture Browsing Texture Classification Texture Retrieval MPEG-7
目錄 中文摘要...I 英文摘要...I 目錄...III 報告內容 研究計畫簡介...1 研究方法...3 實驗結果與討論...11 結論...17 參考文獻...18 已發表著作...19 計畫成果自評...19 可供推廣之研發成果資料表...20 附錄 已發表論文 出席國際學術會議心得報告及發表之論文
行政院國家科學委員會專題研究計畫成果報告
計畫編號:NSC 92-2213-E-009-101
NSC 93-2213-E-009-047
執行期限:2003 年 08 月 01 日至 2005 年 07 月 31 日
主持人:陳玲慧 交大資科所
1. 研究計畫簡介Texture almost presents everywhere in natural and real world images. Texture, therefore, has long been an important research topic in image processing. Successful applications of texture analysis methods have been widely found in industrial, biomedical and remote sensing areas. Thus, appropriate descriptors for textures could provide powerful means in applications of texture browsing, coarse texture classification, similarity matching and retrieval. Three texture descriptors have been specified in MEPG-7 [1]. The Homogeneous Texture Descriptor (HTD) provides quantitative characterization of texture patterns and is useful for images with homogeneous textural properties. HTD can be used for similarity based image-to-image matching. To provide descriptions for non-homogeneous textures, Edge Histogram Descriptor (EHD) is provided. The spatial distribution of edges is extracted and is useful for image-to-image matching when the underlying texture is not homogeneous. Texture Browsing Descriptor also named Texture Browsing Component (TBC) relates the perceptual characterization of texture, in terms of regularity, directionality and coarseness. The coarseness is related to image scale or resolution. This descriptor is useful for browsing type applications and coarse classification of textures.
Approaches for estimating the dominant directions of textures in spatial domain [13] or in frequency domain [14] have been proposed. Liu and Picard [15] proposed a texture model addressing the perceptual characteristics of textures mentioned above. The texture model proposed emphasizes the perceptually most salient periodic information. To determine the prominence of periodic structures in a texture, the energy distribution of image autocovariance function is examined. The image autocovariance is computed as the inverse DFT of the image power spectrum. In addition, a computation method of TBC has been recommended in [2, 12]. In this method, an image is filtered using a bank of scale and orientation selective band-pass
filters called Gabor wavelet [3]. To compute the dominant directions, directional histograms are constructed from the filtered images at different scales and then the two histogram peaks with the highest contrasts are considered as the two dominant directions. To compute the scale and regularity, the filtered images are projected along the two dominant directions to form two sets of projections. For each set of projections, the autocorrelation function is evaluated. The scale and regularity are then determined based on the peaks and valleys of the autocorrelation function. In addition, consistency checks based on the neighboring relationship of the projections are provided to make the method more robust. As it involves the computation of applying Gabor wavelet filters and autocorrelation function, the method is relatively time-consuming.
In this report, an efficient computation method of TBC will be provided. The method is based on the fact that for a directional texture image, the magnitudes of its Fourier spectrum will concentrate on a certain direction; for regular, on several directions; for irregular, not on any direction [4,5]. To compute the regularity of textures, Fourier transform is first performed. The Fourier spectrum is then smoothed to reduce noises. The smoothed Fourier spectrum is treated as an image and the Fourier transform is performed again to produce an enhanced Fourier spectrum. A regularity measure based on the variance of the radial wedge distribution is then calculated to determine the regularity of textures. For regular textures, the texture primitives are assumed to be parallelograms, the two dominant directions and their associated scales of the primitives are determined by Hough transform [6]. In addition, Principal component analysis is provided to detect textures with only one dominant direction. Experiments of texture browsing and texture retrieval are performed to test the texture images of Brodatz album [7] and Corel Gallery image database to demonstrate the effectiveness of the proposed method.
2. 研究方法
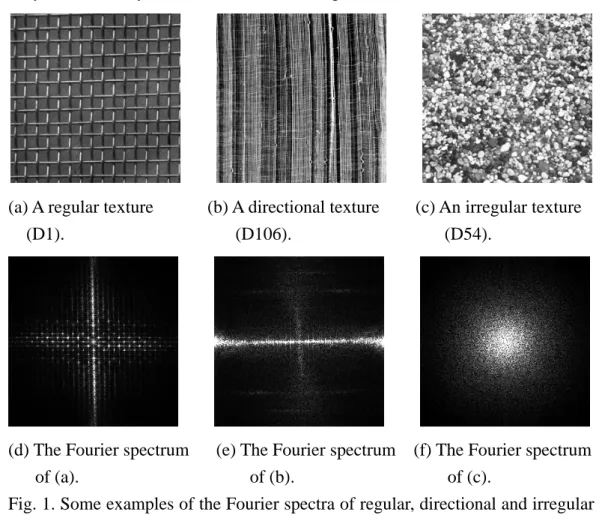
TBC characterizes perceptual attributes in terms of regularity, directionality and coarseness. We will base on the following properties of Fourier spectrum to measure these three perceptual textural attributes: (1) for regular textures, the Fourier spectrum consists of significant peaks scattering out regularly on some directions of the frequency plane, (2) for textures with strong directionality, the directionality will be preserved in the Fourier spectrum, and the high spectral values of Fourier spectrum will also tend to lie in a direction which is perpendicular to the direction of texture patterns, (3) for irregular textures, spectral values are not concentrated on any direction. One example demonstrating these properties is shown in Fig. 1. In the following sections, we will first give a brief introduction to the semantics of texture browsing descriptor. Then, the details of the proposed computation method for regularity, directionality and coarseness will be explained.
(a) A regular texture (b) A directional texture (c) An irregular texture (D1). (D106). (D54).
(d) The Fourier spectrum (e) The Fourier spectrum (f) The Fourier spectrum of (a). of (b). of (c).
Fig. 1. Some examples of the Fourier spectra of regular, directional and irregular textures.
2.1 A Brief Introduction to the Semantics of Texture Browsing Component
Texture browsing component is a 12-bits descriptor: 2 bits for representing regularity, 6 bits (3bits×2) for directionality and 4 bits (2 bits×2) for coarseness. The
descriptor allows a maximum of two directions and coarseness values. The regularity is graded on a scale of 0 to 3, with 3 indicating textures with highly structured periodic patterns, while 0 indicating irregular or random textures. The directionality is quantized into six values, ranging from 00 to 1500 in the step size of 300. Three bits are used to represent directions, with up to two directions can be specified. A coarseness component is associated with each direction. Coarseness is related to image scale or resolution, and is quantized into four values, with 3 indicating a very coarse texture and 0 indicating a fine grain texture. In addition, a separate bit called ComponentNumberFlag is used to specify the number of components in the descriptor. If it is equal to 0 then only one direction and its scale is present, otherwise two directions will be present in TBC.
In this project, we use v1 to denote the regularity, v2 and v4 the two
dominant directions, and v and 3 v the two scales associated with the two 5
dominant directions. In the following, we will present an efficient computation method for the above-mentioned descriptor components.
2.2 Computation of Regularity (v1)
It is mentioned in [5] that texture with a well-defined directionality even in the absence of a perceivable micro-pattern is considered more regular than a pattern that lacks directionality and periodicity, even if the individual micro-patterns can be clearly identified. One pictorial example of the four scales of regularity is shown in Fig. 2. From this figure, we can see that Fig. 2(b) is considered more regular than Fig. 2(c), even there are clear circular patterns in Fig. 2(c). This shows that periodicity and directionality should be more influential than other factors when determining regularity. Highly regular (regularity=3) and regular (regularity=2) textures are called as “high regularity textures”, and slightly regular (regularity=1) and irregular (regularity=0) textures as “low regularity textures” in this project.
(a) Highly regular. (b) Regular. (c) Slightly regular. (d) Irregular. Fig. 2. An example of regularity classification.
For high regularity textures, their Fourier spectra consist of significant peaks scattering out regularly on some directions; for low regularity textures, spectral values are not concentrated on certain directions. These properties can be further enhanced
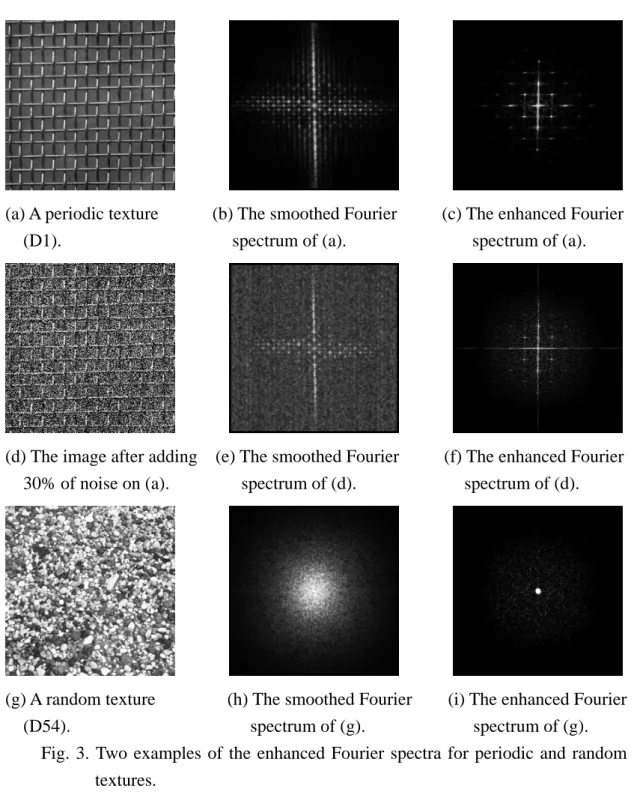
by performing Fourier transform on the Fourier spectrum. The obtained Fourier spectrum is called an enhanced Fourier spectrum. The textural features of an enhanced Fourier spectrum are more prominent than those of the original Fourier spectrum [12]. Two examples are shown in Fig. 3. Fig. 3(a) shows a regular texture from D1 of Brodatz album. Fig. 3(b) shows the Fourier spectrum of Fig. 3(a), the spectral peaks, each of which comes from the contribution of those pixels with the same period in the original image, spread out regularly along certain directions. This property is enhanced in the enhanced Fourier spectrum, the reason is that those peaks in the Fourier spectrum are periodic, through applying Fourier transform again, peaks with the same period will contribute to the same frequency, making the peaks in the enhanced Fourier spectrum more prominent. On the other hand, for those remaining pixels (not peaks) in the Fourier spectrum, since they are not periodic, by applying the Fourier transform again, they do not contribute to the same frequency. This phenomenon also enhances those peaks relatively. Fig. 3(c) shows the enhanced Fourier spectrum of Fig. 3(a). Fig. 3(d) is the image obtained by adding 30% of Gaussian noise on Fig. 3(a). Fig. 3(e) is the smoothed Fourier spectrum of Fig. 3(d), the frequencies to which the periodic patterns contribute, are mixed with noises in the Fourier spectrum. This is due to that too many non-periodic noises exist. Thus, it is difficult to extract textural features from the Fourier spectrum. By applying Fourier transform to Fig. 3(e), the spectral peaks appear more prominent on the enhanced Fourier spectrum shown in Fig. 3(f). Fig. 3(g) shows a random texture. Its Fourier spectrum is shown in Fig. 3(h). The spectral responses in the Fourier spectrum are not periodic and do not concentrate on certain frequencies but scatter around the frequency plane. This is due to that pixels of a random texture are not of certain periods, thus they will not contribute to certain frequencies and form periodic spectral peaks. This also makes the spectral responses in the enhanced Fourier spectrum (see Fig. 3(i)) spread over all directions. According to the above-mentioned properties, the enhanced Fourier spectrum is adopted to discriminate periodic from random textures.
(a) A periodic texture (b) The smoothed Fourier (c) The enhanced Fourier (D1). spectrum of (a). spectrum of (a).
(d) The image after adding (e) The smoothed Fourier (f) The enhanced Fourier 30% of noise on (a). spectrum of (d). spectrum of (d).
(g) A random texture (h) The smoothed Fourier (i) The enhanced Fourier (D54). spectrum of (g). spectrum of (g).
Fig. 3. Two examples of the enhanced Fourier spectra for periodic and random textures.
A regularity measure RWDV (Radial Wedge Distribution Variance) proposed by Lee and Chen [8] can be extracted from enhanced Fourier spectrum and used to compute texture regularity. In the following, we will explain RWDV briefly.
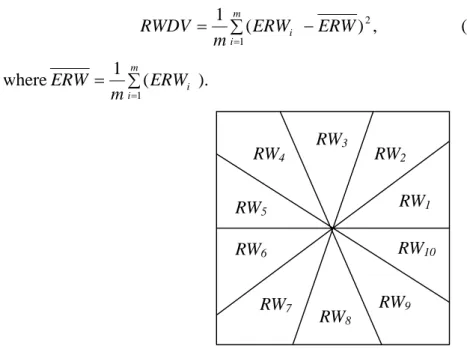
Given an enhanced Fourier spectrum, E(u,v), the radial wedge distribution is first calculated. Fig. 4 shows the radial wedges used. Let the radial wedges be denoted as RWi,i=1,...,m,m=360/∆θ , where ∆θ is the size of each wedge. For each E(u,v), we accumulate it to RW if it satisfies: i
1 1 ) ( tan− < + ≤ i i v u θ θ .
The energy of each wedge is then normalized by the total energy of all wedges. Let m
i
ERWi , =1,..., denote the normalized energy of radial wedges RW , then the i RWDV is defined as: (1) , ) ( 1 2 1 ∑ − = = m i i ERW ERW m RWDV ∑ = = m i i ERW m ERW 1 ). ( 1 where
Fig. 4. The radial wedges used in the proposed method.
For high regularity textures, as the spectral peaks spread out regularly along certain directions while the spectral values of low regularity textures spread over all directions, the variance of all radial wedge energies of a high regularity texture will be larger than that of a low regularity texture. Therefore, RWDV can be used to measure textural regularity. In our experiment, ∆θ is set as 1o. Based on the measure RWDV, the regularity of textures can be obtained.
According to the four scales of regularity mentioned above, the following quantization method is deigned to assign regularity:
. RWDV 30 if v RWDV 17 if v RWDV 5 if v 5 RWDV if v ≤ = < ≤ = < ≤ = < = 3 30 2 17 1 0 1 1 1 1 (2)
The thresholds used in Eq. (2) are empirical values determined from the training set of Brodatz album.
2.3 Computation of Dominant Directions (v2, v4)
RW1 RW2 RW3 RW4 RW5 RW6 RW7 RW8 RW9 RW10
High regularity textures can be defined by texture primitives occurring repeatedly by some placement rules. Based on the definition of Conner and Harlow [9], the texture primitive forming a texture image is assumed to be a parallelgram that can be described by two displacement vectors. The directions of these two displacement vectors correspond to the two dominant directions of high regularity textures. On the other hand, for some directional texture, there is only one dominant direction in the texture pattern. For low regularity textures, there are no dominant directions present in the texture image, thus it is impractical to extract the direction component. In the following, we will describe the method for detecting the single dominant direction for directional textures and the method for detecting the two dominant directions for high regularity textures.
2.3.1 Computation of the Dominant Directions (v2) for Directional Textures
For directional textures, the spectral peaks of the Fourier spectrum form a line-like shape. Based on this fact, a method to measure the directionality of textures is proposed. First, Fourier transform is applied to the image to obtain its Fourier spectrum, and then the Fourier spectrum is smoothed to reduce noises. Let the smoothed Fourier spectrum be denoted as F'(u,v),u=1,...N,v=1,...,N.
A thresholding method [8] is then used to extract the high spectral pixels from the Fourier spectrum. Let the set of high spectral pixels be denoted by H. We then calculate the principal components of H. To emphasize the importance of pixels with higher spectral value in the calculation of principal component, we use the spectral values of pixels as weights when calculating the principal components [8]. The co-variance matrix C of H is then evaluated by
⎥ ⎦ ⎤ ⎢ ⎣ ⎡ = vv uv vu uu c c c c C , (3) where 2 ) , ( ' ) ( ) , ( 1 − ∈ − ∑ = F u v u u W c H v u uu , 2 ) , ( ' ) ( ) , ( 1 − ∈ − ∑ = F u v v v W c H v u vv , ) )( ( ) , ( 1 ) , ( ' − − ∈ − − ∑ = F u v u u v v W c H v u uv , cuv =cvu, and = ∑ ∈H v u v u F W ) , ( ' ) , ( , = ∑ ∈ − H v u u v u F W u ) , ( ' ) , ( 1 , = ∑ ∈ − H v u v v u F W v ) , ( ' ) , ( 1 .
The two eigenvalues of C are evaluated, and let them be λ1 and λ2 with λ1 >λ2,
respectively. For directional textures, as the larger eigenvalue (λ1) will be much
greater than the smaller eigenvalue(λ2), thus the eigenvalue ratio, EV =λ1/λ2 can be
determine whether a texture is a directional one or not. For a directional texture, the angle of the principle component plus 90 degree is used to represent the dominant direction of the texture pattern. In addition, the ComponentNumberFlag is set to 0 to indicate that there is only one dominant direction in the texture. For high regularity textures, the two dominant directions are extracted by a provided method presented in the following section.
2.3.2 Computation of Dominant Directions (v2, v4) for High Regularity Textures
As mentioned previously, if a texture contains patterns oriented in some directions, then the high spectral values of Fourier spectrum will also tend to lie in some directions each of which is perpendicular to one direction of texture patterns. We will base on this property to detect the two dominant directions for regular textures.
Fourier transform is first performed on a high regularity texture image. The thresholding method mentioned in Section 2.3.1 is then performed on the Fourier spectrum to locate high spectral pixels. Hough transform is then used to extract the angles of the two dominant directions. The following equation is used to represent a line:
xcosθ + siny θ = ρ. (4) Through the Hough transform, the angles θ1 and θ2 associated with the top two accumulating values are extracted and θ1 +π/2 and θ2 +π/2 are considered as the angles of the two dominant directions of the texture. θ1 +π/2 and θ2 +π /2 are then quantized in step of 30 to obtain the values of direction component. That is,v2 =
⎣
(θ1 +π/2)/30⎦
, v4 =⎣
(θ2 +π /2)/30⎦
.2.4 Computation of Scale (v3, v5)
To compute the scale component corresponding to each dominant direction, the Fourier spectrum F( vu, )is first transformed to G(r,θ) by setting
), v , u ( F ) , r ( G θ = (5)
where u =
⎣
N/2×rcosθ⎦
, v=⎣
N/2×rsinθ⎦
, 0≤r≤1, −π<θ<π , N is the dimension of spectrum.As mentioned in Section 2.3.2, through the Hough transform, the two dominant angles θ1 and θ2 in the Fourier spectrum can be extracted. Then, for each dominant
direction,θi,i=1,2, the radial array G(r,θi)is logarithmically divided into four
frequency bins
{
Csi|s=0,1,2,3}
. That is{
}
i B r | ) , r ( G C = θ ∈ , B =(2−(s+1),2−s]. (6)For a fine texture, most of its energy will present in the high frequency portion of the spectrum, thus C0i will have larger energy than other
i s
C . On the contrary, for a very coarse texture, most of its energy will concentrate in the low frequency portion of the spectrum, therefore C3i will have larger energy than other
i s
C . Thus, the scale corresponding to θi can be determined by finding the scale index s with maximum 0
energy inCsi
3. 實驗結果與討論
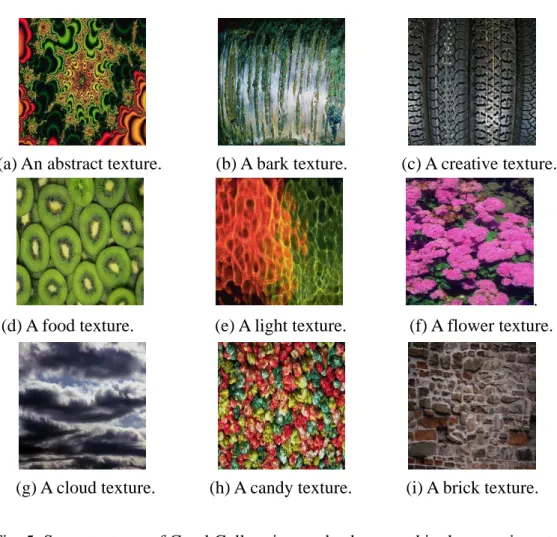
Texture images of Brodatz album and Corel Gallery image databases are used to test the proposed method. To build up the Brodatz album database, eight patches of the 112 textures in Brodatz album are scanned and 896 texture images are obtained for experiments. 4 out of the eight patches of each texture are used as training set to obtain the empirical values for thresholds used, while the remaining images are used as testing set. To build up the Corel Gallery database, 1896 natural color texture images from Corel Gallery image database are selected and used as testing set, including abstract textures, bark textures, creative textures, food textures, light textures, and other textures etc. Some examples of Corel Gallery database are shown in Fig. 5.
Three types of experiments are designed to illustrate the effectiveness and efficiency of the proposed method: (1) texture browsing, (2) coarse classification of textures, (3) similarity-based image-to-image matching. Firstly, in the experiment of texture browsing, several query conditions are used to retrieve images. The query conditions are designed to include all elements of the TBC descriptor, they are: (1) retrieving highly regular or regular textures which are not very coarse and oriented at around 30 degree, (2) retrieving irregular textures, (3) retrieving directional textures. Secondly, in the experiment of coarse classification of textures, the proposed texture browsing descriptor and the proposed method of MPEG-7 TBC are used to classify the texture images of Brodatz album into directional, high regularity (regularity=2 or 3) or low regularity (regularity=0 or 1) respectively, and the comparison of the efficiency of the proposed method and MPEG-7 TBC is illustrated. Finally, in the experiment of similarity-based image-to-image matching, the textures are retrieved by query-by-example. To demonstrate the effectiveness of the proposed method as a prescreening step of a texture retrieval system, retrieved result using the proposed method for prescreening is compared with that without using the proposed method for prescreening. To demonstrate this advantage, three experiments are conducted and similar images are retrieved given the following three types of query images: (1) a directional texture, (2) a regular texture, (3) an irregular texture.
(a) An abstract texture. (b) A bark texture. (c) A creative texture.
.
(d) A food texture. (e) A light texture. (f) A flower texture.
(g) A cloud texture. (h) A candy texture. (i) A brick texture.
Fig. 5. Some textures of Corel Gallery image database used in the experiments.
Texture Browsing
The experimental results of texture browsing are shown in Fig. 6. Fig. 6(a) shows some retrieved texture images satisfying condition 1. The retrieved images meet the regularity, scale and directional criteria set in condition 1. Fig. 6(b) shows the result of condition 2, all retrieved textures are irregular textures. Finally, Fig. 6(c) shows the result of condition 3, it verifies that the principle component analysis method proposed can locate directional textures correctly. The results shown in Fig. 6 demonstrate the effectiveness of the proposed methods for computing the regularity, directionality, scale components as well as ComponentNumberFlag.
(a) Some not very coarse textures with high regularity and are orientation around 30 degree retrieved under condition 1.
(b) Some irregular textures under condition 2.
(c) Some directional textures retrieved under condition 3. Fig. 6. Some examples of texture browsing.
Coarse Classification of Textures
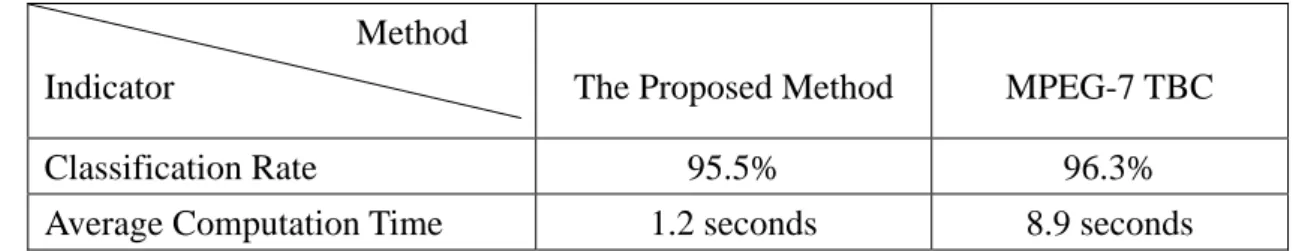
In this section, the proposed texture browsing descriptor and the proposed method of MPEG-7 TBC are used to classify the texture images of Brodatz album into directional, high regularity or low regularity respectively. Four patches for each of the 112 textures in Brodatz album are scanned and 448 texture images are obtained as the testing set. The classification rate is computed as the total number of correctly classified images divided by the total number of images in the testing set. The classification result and the average computation time required of the proposed method and the proposed method of MPEG-7 TBC are shown in Table 1. The experiment is conducted on an Intel PC with a CPU of 1.2 GHz and 120M of RAM.
Table 1: Performance comparison of the proposed method and the proposed of MPEG-7.
Indicator The Proposed Method MPEG-7 TBC
Classification Rate 95.5% 96.3%
Average Computation Time 1.2 seconds 8.9 seconds
As shown in Table 1, the classification rate is roughly comparable for both the proposed method and the proposed method of MPEG-7. However, the proposed method is more efficient than the proposed method of MPEG-7 in terms of computation time. It takes averagely 1.2 seconds to produce a texture browsing descriptor while the proposed method of MPEG-7 takes 8.9 seconds.
Similarity-based Image-to-image Matching
In this section, three examples of similarity-based image-to-image matching by combining texture browsing descriptor and MPEG-7 HTD are presented to illustrate the benefits of using the proposed method as a prescreening step of a texture retrieval system. The retrieval is achieved by query-by-example. Given a query image, the retrieval system first select textures in the database whose values of ComponentNumberFlag are the same as the query image as candidates for later comparison. If the query image is not a directional texture (ComponentNumberFlag = 1), then its regularity is determined and those images with the same regularity as the query image are extracted as candidates. On the other hand, if the query image is a directional texture, then the above-mentioned candidate filtering by regularity is not performed. The MPEG-7 HTD [5] of the query image are then extracted and compared with the HTD of candidate images. The candidate images are then sorted by the descending order of similarity and displayed to users.
The MPEG-7 HTD characterizes the texture using the mean energy and the energy deviation from a set of frequency channels. The 2-D frequency plane is partitioned into 30 channels. The frequency plane partitioning is uniform along the angular direction with step size of 30 degrees while the division along the radial direction is on an octave scale. The individual channels are modeled using Gabor functions [7]. The HTD can be represented by a 62-dimentional vector as
[
f , f ,e1,e2,...,e30,d1,d2,...,d30]
HTD = DC SD , (7)
where fDC and fSD are the mean and standard deviation of the image, respectively,
and e and i d are the mean energy and energy deviation of the corresponding ith i
channel respectively. To measure the similarity between the query image and candidate images, the distance measure between the feature vector HTDq of the
query image q and HTD of a candidate image c is defined to be c
∑
− = k c q k k HTD k HTD c q D ) ( ) ( ) ( ) , ( α (8)where α
( )
k is the standard deviation of the set of the kth feature over the entiredatabase and are used to normalize the individual feature component.
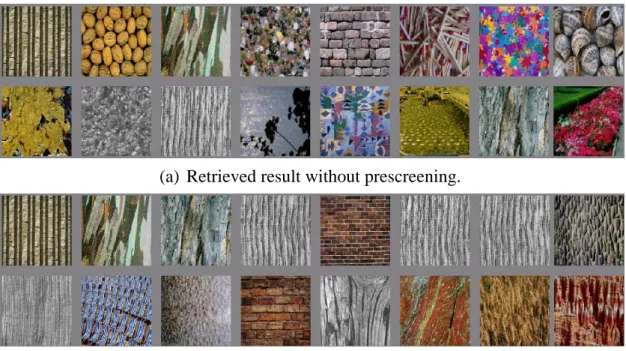
Fig. 7 shows an example of combining texture browsing descriptor and HTD feature in a texture retrieval application. The upper-left image of the displayed result is a directional texture used as a query image. Fig. 7(a) shows the result without using the proposed texture descriptor for prescreening. Most of the top 16 retrieved images are irregular textures and some are quite different from the query image. Fig. 7(b) shows the result with prescreening. Most of the top 16 retrieved images are directional textures and some look similar to the query image. This illustrates the effectiveness of the proposed method as a prescreening step of a texture retrieval system.
(a) Retrieved result without prescreening.
(b) Retrieved result with prescreening.
Fig. 7. An example of texture retrieval given a directional texture as query image using MPEG-7 HTD.
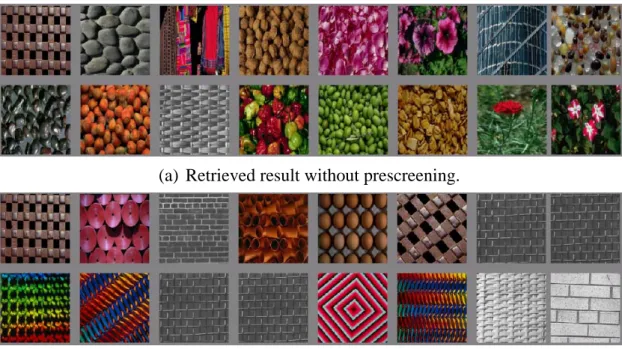
Fig. 8 shows another texture retrieval example. The query image shown in the upper-left position is a regular one with horizontally and vertically repeated primitives.
Fig. 8(a) shows the retrieved result without prescreening. Although the query image is a regular texture, some irregular textures are mistakenly retrieved in the top 16 ones. Fig. 8(b) shows the retrieved result with prescreening. All retrieved textures are regular textures and most of them have horizontally and vertically repeated primitives.
(a) Retrieved result without prescreening.
(b) Retrieved result with prescreening.
Fig. 8. A texture retrieval example given a regular texture as query image.
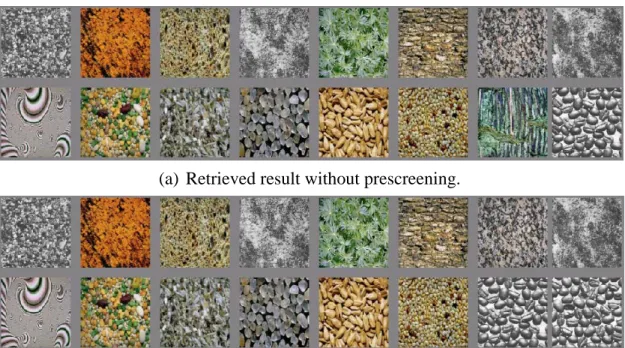
Fig. 9 shows another example of texture retrieval given an irregular query image. As shown in Fig. 9(a) and Fig. 9(b), the retrieved images with prescreening and without prescreening are basically the same. The performance of using the proposed method to prescreen candidates and that of using MPEG-7 HTD alone is comparable in this case.
(a) Retrieved result without prescreening.
(b) Retrieved result with prescreening.
Fig. 9. A texture retrieval example given an irregular query image.
4. 結論
In this project, an efficient computation method for computing the texture browsing descriptor specified in MPEG-7 is provided. The eigenvalue ratio obtained by performing principal component analysis on the Fourier spectrum of the texture image is used to detect directional textures. To compute the regularity, Fourier transform is applied to the Fourier spectrum image to produce an enhanced Fourier spectrum. A spectral measure based on the variance of the radial wedge distribution is then calculated from the enhanced Fourier spectrum and applied to compute the regularity. To compute the directionality components, Hough transform is applied on the Fourier spectrum to detect two dominant directions. A scale computation method is then provided to compute the scales corresponding to the two dominant directions. The texture browsing descriptor can be used in applications of texture browsing. In addition, a texture retrieval system can use the descriptor to find a set of candidates with similar perceptual properties and then use other similarity-based image-to-image matching descriptor such as MPEG-7 HTD to get a precise similar match among the candidate images. Experiments designed for texture browsing, coarse classification of textures and texture retrieval show the efficiency and effectiveness of the proposed method.
參考文獻
[1] Text of ISO/IEC 15938-3 Multimedia Content Description Interface-Part 3: Visual. Final Committee Draft, ISO/IEC/JTC1/SC29/WG11, Doc. N4062, Mar. 2001.
[2] MPEG-7 Visual Experimentation Model (XM), Version 10.0, ISO/IEC/JTC1/SC29/WG11, Doc. N4063, Mar. 2001.
[3] B. S. Manjunath and W. Y. Ma, “Texture Features for Browsing and Retrieval of Image Data,” IEEE Trans. On Pattern Analysis and Machine Intelligence, 18(8), pp.837-842, 1996.
[4] M. D. Levine, Vision in Man and Machine, New York: McGraw Hill, 1985. [5] C. H., Chen, “A Study of Texture Classification Using Spectral Features,”
Proceedings of the 6th International Conference on Pattern Recognition, Munich, Oct. 19-22, pp. 1074-1077, 1982.
[6] D. H. Ballard, “Generalizing the Hough transform to detect arbitrary shapes,” Pattern Recognition, vol. 13, no. 2, pp. 111-122, 1981.
[7] P. Brodatz, Textures-A photographic for Artists and Designers, Dover. New York, 1966.
[8] K. L. Lee and L. H. Chen, “A New Method for Coarse Classification of Textures and Class Weight Estimation for Texture Retrieval,” Pattern Recognition and Image Analysis for publication, vol. 12, no. 4, pp.400-410, 2002.
[9] R.W. Conners, and C.A. Harlow, “Towards a structural textural analyzer based on statistical methods,” Computer Graphics and Image Processing, vol. 12, no.3, pp. 224-256, 1980.
[10] I. Daubechies, “Ten lectures on wavelets,” CBMS series, Philadelphia: SIAM,1992.
[11] S. G. Mallat, “A theory of multiresolution signal decomposition: the wavelet transform,” IEEE Transactions on Pattern Analysis and Machine Intelligence, vol. 11, no. 7, pp. 674-693, 1989.
[12] Wu, P., et al., “ A texture descriptor for browsing and similarity retrieval,” Signal Processing: Image Communication, vol. 12, pp. 33-43, 2000.
[13] H. Tamura, S. Mori and T. Yamawaki, “Texture features corresponding to visual perception,” IEEE Trans., Syst., Man, Cyber, SMC8(6), pp. 460-473, 1978. [14] J. S. Weszka, C. R. Dyer and A. Rosenfeld, “A comparative study of texture
measures for terrain classification,” IEEE Trans., Syst., Man, Cyber, SMC-6, pp. 269-285, 1976.
[15] F. Liu and R. W. Picard, “Periodicity, Directionality and Randomness: Wold Featurbes for Image Modeling and Retrieval,” IEEE Trans. on Pattern Analysis
and Machine Intelligence, 18(7), pp. 722-733, 1996.
已發表著作(著作附於附錄)
1. K. L. Lee and L. H. Chen, "Unsupervised texture segmentation by determining the interior of texture regions based on wavelet transform," International Journal of Pattern Recognition and Artificial Intelligence, Vol. 15, No. 8, pp. 1231-1250, 2001. (SCIE, EI)
2. K. L. Lee and L. H. Chen, "A new method for extracting primitives of regular textures based on wavelet transform," International Journal of Pattern Recognition and Artificial Intelligence, Vol. 16, No.1, pp. 1-25, 2002.
3. K. L. Lee and L. H. Chen, "A New Method for Coarse Classification of Textures and Class Weight Estimation for Texture Retrieval", Pattern Recognition and Image Analysis, Vol.12, No.4, pp. 400–410, 2002.
4. K. L. Lee and L. H. Chen, "An Efficient Computation Method for the Texture Browsing Descriptor of MPEG-7", Image and Vision Computing Journal, Vol. 23, Issue 5, pp. 479-489, 2005. (SCI, EI)
計畫成果自評
本計畫的執行進度符合當初所提之計畫內容,亦完成計畫書所擬定之研究目
標。本計畫完成一高效率之 MPEG-7 紋理瀏覽描述子計算法,並完成一套紋理
瀏覽和紋理檢索之系統。在學術上可供碩博士學生參考之用。此計畫的研究成果 已寫成四篇論文,並已發表於國際期刊。
可供推廣之研發成果資料表
□ 可申請專利 □ 可技術移轉 日期:94 年 07 月 22 日國科會補助計畫
計畫名稱:一個高效率之 MPEG-7 紋理瀏覽描述子的計算法及其於 紋理瀏覽和紋理檢索之應用 計畫主持人:陳玲慧 計畫編號:NSC 93-2213-E-009-047 學門領域:影像處理技術/創作名稱
高效率之 MPEG-7 紋理瀏覽描述子計算法發明人/創作人
陳玲慧 中文:本方法藉由分析紋理影像之傅立葉頻譜具有的特性,以判斷 紋理影像之方向性及規律性,並將其分類為具方向性的、具規律性 的、及不具規律性三種類別。對紋理影像之傅立葉頻譜再次實行傅 立葉轉換,並由二次傅立葉轉換後之頻譜內取得所需之紋理影像特 徵資料。技術說明
英文:The proposed method classifies texture images into three categories: directional, regular and irregular by analyzing the Fourier spectrum of texture images. The Fourier spectrum is treated as an image and transformed by Fourier transformation again to get an enhanced Fourier spectrum. Features are extracted from enhanced Fourier spectrum.