3526 IEEE TRANSACTIONS ON MAGNETICS, VOL. 29, NO. 6, NOVEMBER 1993
Study of
Loss
Mechanisms of Mn-Zn Ferrites in the
Frequency from
1
MHz t o 10
MHz
M. J. Tung, W.C. Chang' , C.S. Liu" , T.Y. Liu" , C. J. Chen", T . Y . Tseng Institute of Electronics, National Chiao Tung University
Hsinchu, Taiwan, R.O.C.
'Department of Physics, National Chung Cheng University Ming-Hsiung,Chia-Yi 621,Tai~an~R.O.C.
"Materials Research Laboratories, Industrial Technology Research Institute Chutung,
Abstract-The core loss mechanism of low loss grade Mn-Zn ferrite in the frequency from lMHz to lOMHz was investi- gated in order to find out the possibility of developing Mn-Zn ferrites to be used at such high frequency region. under the condition of f.B=25KHz.T, it was found that di- electric loss dominated the core loss at the frequency be-
tween 1.1 and 3MHz. while eddy current loss dominated the core loss at the frequency higher than 3MHz. It is sugges- ted that decrease of grain boundary capacitance and in- crease of grain resistivity of the core may be the sui- table ways for the Mn-Zn ferrites to be used at such fre- quency region.
I.
IntroductionRecently, the operating frequency of switching mode power supplies is increased from B k H z to several
Mz
to in- crease their power density and make them more compact. Therefore, it is urgently need to reduce the power loss of core material in order to use it at higher frequencyl. Mn-Zn ferrites are suitable core material in the frequency range under lMHZ2". For the frequency higher than 1MHz.
Ni-Zn ferrites seem to be the best candidate for appli- cations',but nowadays, it
ys
reported that Mn-Zn ferrites can also be used at lMHz.
On the other hand, only a few papers have discussed possibility of using Mn-Zn ferrites in the frequency higher than 1MHz. This paper will mainly investigate the core loss phenomenon of Mn-Zn ferrites in the frequency range between lMHz and lOMHz in order tofind out the possible ways which can be approached for the Mn-Zn ferrite cores to be used in the frequency higher than 1MHz.
11. Experimental
Low loss grade Mn-Zn ferrite samples are prepared by conventional ceramic process. 'he powders containing Fez&, MnO and ZnO in molar ratio of 52.9:37.6:9.5 with
the addition of 0.2wt% of CaO and O.O2wt% of Si02 where prepared, and the powders were pressed into toroids with OOmm(O.D.1 x lOm(1.D.) x 5m(t) and disk shape with mllm
(@)x2.5mm(t). The green compacts were sintered at 12ooC
for 2hrs in air and then annealed at llWC for 2hrs in the oxygen partial pressure of 0.5%, 1% and 3%. and they are represented by sample
A, B
and C, respectively. The samples sintered in 1% oxygen partial pressure were chosen to be cooled with different times (4hrs and 8hrs) fromllOOC to 8OOC for comparison, in order to study the effect of cooling rate on the resistivity and power loss
Hsinchu 31015, Taiwan, R.O.C.
of the final cores. The impedance and permeability were measured in the frequency range from 5Hz to 13MHz with
HP
4192A impedance analyzer. Power loss was measured with Ryowa MS-0375 Iron loss measuring system at constant
B-
x f.425kHz.Tesla) value.1II.Results and discussion
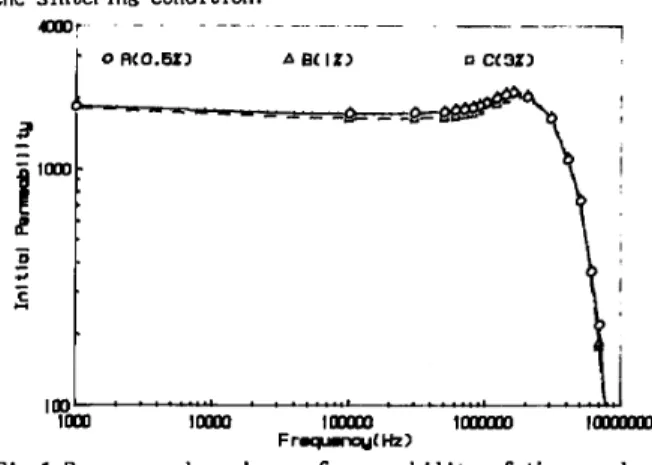
Figure 1 shows the permeability of the sample
A,B
and Cat the frequency from lKHz to 10 MHz. From the figure, it
is found that the permeability is almost the same among them at such frequency range. This suggest that the per- meability of the studied Mn-Zn Ferrites is independent of the sintering condition.
-1 lXlDr - - -- - -. - - ~ ___ A B( 1%) n C(3%1 3
\ i
1001 ' " . . . ' . I . ...' . ' *J.J1000 lazlo I" 1mMD Imma,
Fr.grmy(kh)
Fig.l.Frequency dependence of permeability of the sample
A
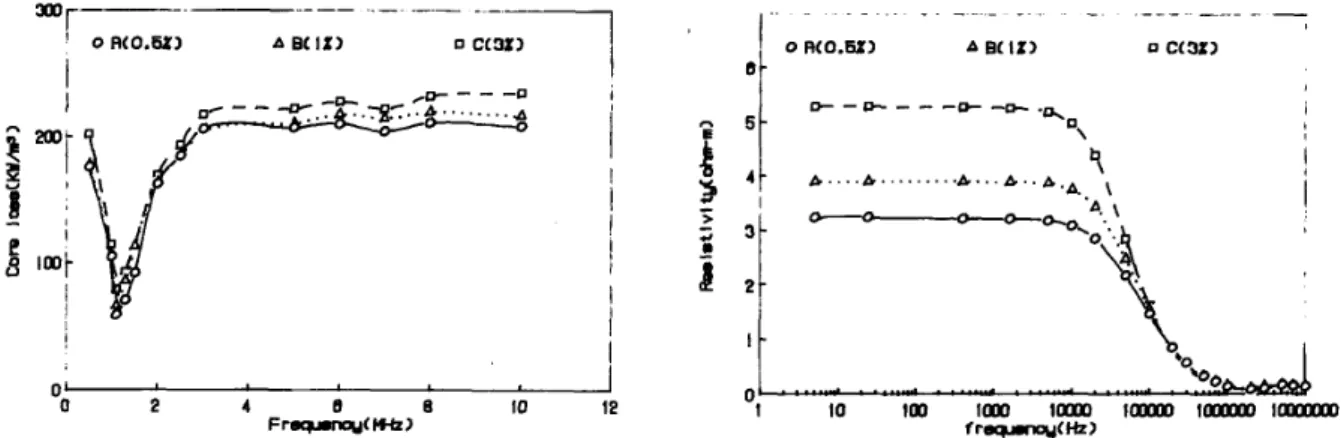
,B and CFigure 2 shows the variation of core loss with frequency of the samples sintered in various oxygen atmosphere. It is apparent that the core loss of the samples measured at f.B=BKHz.T can be divided into three parts.The first part is the loss in the frequency lower than l.lMHz, which is proportional to l/f.Second part is the loss from 1.1MHz to
around 3MHz,which is proportional t o f. 'Ihird part is the
loss from 3MHz to 1OMHz which is independent of f. The core loss of power ferrite is reported consisting of three parts, there are hysteresis loss (Ph) On7,eddy current loss (Pe) OS7 and dielectric loss (Pde) I . There are usually
defined as follows:
Ph=Kh f
B2
....
(1)Pe=Ke f2 B2/ P
. . .
.
(2) Pde=Kde f3 B2.
.
.
.
(3)3527
I
! I I -
0'
b*o
Y O2
where Kh, Ke and Kde represent the coefficient of hystere-
sis loss, eddy current loss and dielectric loss, respec- tively.
B
represents the magnetic induction, f represents the frequency and P represents the resistivity of the core. If we keep the measuring condition at constant fB.
then the equations of above can be changed to the fo- 1 lowing: a
3
Pe=Ke(f B)'/P....
(5) :....
: Ph=Kh(f @'If (4) Pde=Kde(fBIZ
f....
(6)From equation(4)to(6), it is clear that Ph is proportional to V f , Pe has no relationship with f, while Pde is pro- portional to f, if f
B
is kept constant. R a t is to say the core loss of the studied samples is dominated by hy- steresis loss in the frequency lower than 1.1 MHz, domi- nated by dielectric loss in the frequency from 1.lMHz to 3MHz and dominated by eddy current loss in the range from3MHz to 1oMHz.
Figure 3 shows the variation of the resistivity with frequency for the samples sintered in various atmospheres. It demostrates that bulk resistivity of the samples was increased with increasing the oxygen partial pressure at the frequency lower than 1MHz. However, it became iden- tical among them at frequency higher than 1MHz. From the complex impedance plot of the sample
A,B
and C, see fi- gure 4, it was found thtt the variation of impedance fo- llows the Kroops' model.
According to figure 4, the im- pedance of the sample will be dominated by the grain boun- dary resistivity (Rb) at low frequency, while it will bedominated by the grain resistivity(RJ at high frequency due to rapid decrease of Xcb(=l/OCb). From equation (51, it is known that eddy current loss will be decreased with increasing the bulk resistivity. It is presumed that in- crease of grain boundary resistivity may decrease of eddy current loss , i.e. core loss. In reality , at the fre- quency higher than 3Mz, the grain boundary impedance de- creases very rapidly, therefore, the apparent impedance of the core approaches the value of grain resistivity. This was proved by the result of small difference in
R a for the samples sintered in different oxygen partial
pressure at the frequency higher than 3Hz, as shown in figure 5. High resistivity grain boundary phase ( CaO-
110
I
.n
Fig.4.Complex impedence plot of sample
A,B
and C SiOShas no direct relationship with impedance of the core and also the core loss at such high frequency. In view of the result as above, one can conclude that increase of grain resistivity instead of grain boundary resistivityis necessary for improving the loss at the frequency hi- gher than 3MHz.At the frequency between 1.1 MHz and 3 MHz,
it is suggested that decrease of the grain boundary ca-
pacitance (Cd would decrease its core loss, that is the dielectric loss.
Table 1
Physical properties of samples
A
toD
sample
A
B
CD
p i 1841 1857 1810 1822
Ra(ohm) 6.9 8 6.6 5.3
R
b(0hm) 197 242 326 2%3528
I
O
0 2 4 0 E IO 12
Frr+wnq((W)
Fig.6.Frequenc~ dependence of core loss of
Mn-Zn
ferrites sintered at different annealing condition- 1 I , - - - A BCO. 1%) 0 C ( 3 t l
I
41
e 4 0 E IO 12 0.0 0 Freqroy(Hh)Fig.5.Frequency dependence of resistivity of Mn-Zn ferrites sintered at different oxygen partial Pressure in higher frequency (>lMHz) range
frequency region (1.1MHz-3MHz), dielectric loss dominates the core loss. At high frequency region (3MHz-lOMHz).
eddy current loss will dominate the core loss. It is sug- gested that by decreasing the grain boundary capacitance at middle high frequency or increasing the grain resis tivity at high frequency region are the appropriate ways for the
Mn-Zn
ferrites to be used at the frequency between lMHz and 10 MHz.Acknowledgment
'he authors would like to express their deep gratitute to Ministry of Economic for supporting this study under contract No.38L2210.
References
113 A.F.Goldberg, J.G.Kassakian and M.F. Schlecht, "Issues Related to 1-1OMHz Transformer Design",
IEEE
Trans on Power Electronics, Vo1.4, No.1, p.113-123. Jan. 1989 [21 T.Ochiai and K. Okutani, "Ferrite for High FrequencySwitching Power Supplies", 4th Int. Conf. on Ferrite. Vol. 16,1985
[31 E. Otsuki, S. Yamada,
T.
Otsuka, K. Shoji and T. Sato, "Microstructure and Physical Properties of Mn-Zn Fer- rites for High-Frequency Power Supplies",J.Appl.Phus., 69 (8) ,15, p. 5942-5944, 1991.[41 K.D.Ngo. M.H.Kuo, "Effects of Air Gaps On Winding Loss in High Frequency Planar Magnetics", IEEE PESC, Record
P 1112-1119, 1988.
[51 W.A.Tabisz and
M.M.
Jovanovic,"Practical Design Consi- derations for High Frequency Transformers and Resonant Inductors", VPEC Seminar, Sept. 1990.[SI E.C.Snelling and A.D.Giles, "Ferrite for Inductors and Transformers", Phi 1 ips Research Laboratories, Redhi 11, Surry, England. p.54-62.1983.
[71 J. Smit and
H.P.J.
Wijn,"Ferrites", Philips TechnicalLibrary, Eindhoven, p.134, 1959.
[81 S. Yamada, E.Otsuki and T.Otsuka,Ac Resistivity of Mn- In order to Prove the importance of grain boundary caps- Zn Ferrites", Tokin Technical Review, Vo1.18, p.16-23,
1991. citance on the core loss in the frequency from 1.1MHz to
3MHz, with different condition was applied [91 C. G.Koops. "On the Dispersion of resistivity and Di electric Constant of Some Semiconductors at Audio fr- in order to alter the thinckness of the grain boundary
phase, or the capacitance of the grain boundary. Table 1 equencies",Phys. Rev., vole 83-1, P-121-124, 1951.
lists~some physical properties of the samples studied in this experiment. It is apparent that Cb of the sample ( sample
D)
with longer cooling time (8 hrs) between llOOC and 800C is larger than that of sample (sampleB)
with shorter cooling time(4 hrs). Figure 6 shows the core loss of sample B andD
at various frequency. It is found that the core loss of sampleD
is lower than that of smaple B at the frequency between 1.lMHz and 3 MHz. Whereas, it did not hold true when the frequency is higher than 3MHz. 'his result supports the direct prove of the importance of grain boundary capacitance at the middle high frequency, i.e.1.1-3MHz in this study.
IV.
Conclusions'he core loss of low loss grade Mn-Zn ferrites is stron-
gly dependant upon the frequency under the condition of f.B= 25KHz.T. At low frequency region(<l.lMHz), hysteresis loss will mainly dominate the core loss. At middle high