1
A RETROSPECTION OF CLIMATE CHANGES AND
THEIR IMPACTS IN CHINESE HISTORY
Ts’ui-jung Liu*
This article was originally published in Nature, Environment and culture in East Asia edited by Carmen Meinert. Leiden: Brill, 2013, pp. 107-136.
Abstract
Research on climate changes in Chinese history can be dated back to the 1920s, but a study on climate fluctuations in the past 5,000 years by Zhu Kezhen was regarded as the milestone. This paper provides a retrospective review of climate changes in Chinese history with reference to selected works since the 1970s in the hope of enhancing the understanding of contemporary global climate changes. Accumulated studies have examined climate changes in Chinese history in long temporal range and wide spatial scale, studies which are, however, still provisional and need to be evaluated in greater detail. Nonetheless,it is remarkable that relationships between climate changes and dynastic rises and falls, outbreaks of wars, population migrations and fluctuations, incidences of epidemic disasters, as well as economic, social and cultural development in Chinese history have been well explored and studied, thus providing valuable insights for understanding the history from multiple perspectives.
1. Introduction
Climate is a function of time with variations, fluctuations, and histories. In general, climate can be defined in two ways: long-term local weather conditions and long-term average or statistics of atmospheric conditions. The difference between weather and climate lies mainly in the different time scales involved. Weather refers to short-term atmospheric conditions while climate denotes the atmospheric conditions for different periods of time in the long run.1
Modern meteorological theory suggests that climate is the state of the climatic system. Most of the time, climate can remain stable at an equilibrium state, however, when it changes from one equilibrium state to another, there are often abrupt changes; hence, long-term variations in climate are usually marked by enormous and sudden changes.2 In the literature of meteorology, climate is determined by three major factors, namely solar radiation, underlying surface including land, water, vegetation, desert and so forth, and atmospheric circulation. In recent centuries, human activities
*Distinguished Visiting Fellow, Institute of Taiwan History, Academia Sinica. 1
Cf. Zhang, Jiacheng 张家诚, ed., Zhongguo qihou zonglun 中国气候总论 [Climate of China] (Beijing: Meteorology Press, 1991), 1–2.
2
Cf. Zhang, Peiyuan 张丕远, ed., Zhongguo lishi qihou bianhua 中国历史气候变化 [Climate Change in Chinese History] (Jinan: Shandong Science and Technology Press, 1996), 392.
2
have become the fourth factor. Owed to a greater human impact on atmospheric components and terrestrial vegetation, this strengthening factor in the formation of climate is a link between the socioeconomic and the climatic system.3
In Western literature, it is generally accepted that short-term variations of climate and weather are relevant to short-term economic fluctuations. However, long-term climatic influences have commonly been regarded as of little or no historical interest. In the early 20th century, a small number of scholars, among whom the best known was Ellsworth Huntington, were convinced of the importance of the climate as a major independent variable affecting the development of human societies; thus they were labelled as ‘climatic determinists’. However, in the later half of the 20th century, some scholars, such as R. Pearson, J.E. Chappell, Hubert Lamb, and R. Bryson, pointed out that being a ‘climatic determinist’ did not necessarily imply believing that the entire course of history was explicable in terms of climate, but that climate history must be central to our understanding of human history. Since the 1970s, a new breed of historians, among whom C. Pfister, J. de Vries, J.D. Post, and M.L. Parry were most outstanding, recognised the possible importance of climatic variations on human affairs in both short and long runs, and their work has transformed the study of climate history impact onto a higher plain of methodological rigor.4
The study on climate changes in Chinese history was initiated in the early 20th century by Western scientists, archaeologist Sven Hedin and meteorologist E. Huntington.5 In the 1920s, Chinese scholars specialised in geography, geology, meteorology, archaeology, and history started doing research on climate changes in Chinese history; and since the 1950s, more and more historical source materials have been explored with new research methods and a large number of studies have been accumulated.6 With reference to selected works since the 1970s, this paper attempts to give a retrospective review of climate changes and their impacts in Chinese history; it should be noted, however, that the findings in the works of other scholars do not represent established results yet, but should be regarded as provisional and still need to be analysed in their methodologies and await evaluation.
3
Cf. Zhang, Zhongguo qihou zonglun, 14. 4
Cf. Ingram, M.J., G. Farmer, and T.M.L. Wigley, “Past Climates and their Impact on Man: a review,” in Climate and History: Studies in past climates and their impact on Man, ed. T.M.L. Wigley, M.J. Ingram, and G. Farmer (Cambridge: Cambridge University Press, 1981), 18–19.
5
Cf. Liu, Zhaomin 劉昭民, Zhongguo lishishang zhi qihou bianqian 中國歷史上之氣候變遷 [Climate Changes in Chinese History] (Taipei: Taiwan Commercial Press, 1992), 12.
6
Cf. Liu, Zhongguo lishishang zhi qihou bianqian, 13–15; cf. also Zhou, Shucan 周书灿, “20 shiji zhongguo lishi qihou yanjiu shulun 20 世纪中国历史气候研究述论 [Review on the Study of Historical Climate of China in the 20th Century],” Shixue lilun yanjiu 史学理论研究 [Historiography Quarterly] 4 (2007): 127–136.
3
2. Reconstruction of Climate History in China
Zhu Kezhen published his study on climate changes during the Southern Song dynasty (1127–1279) in 1925; however, a firm foundation of climate history in China was laid by his 1972 article on climatic fluctuations over the last 5,000 years.7 Zhu Kezhen utilised different materials of four broad periods: archaeological findings of 3000–1100 BCE, historical records of phenology of 1100 BCE–CE 1400, records in local gazetteers of 1400–1900, and records of instrumental observation since 1900. With evidences presented for each period, Zhu Kezhen derived the following conclusions. In the first 2,000 years, i.e., from the Neolithic Yangshao culture (~5000 BCE– ~3000 BCE) to Shang dynasty (1556 BCE–1046 BCE) with its capital city located at Yin (today’s Anyang, Henan), the climate in China was warm with an average temperature of 2ºC higher than the present. From then on, there was a series of temperature fluctuations with the lowest occurring around 1000 BCE, CE 400, 1200 and 1700, and the range of temperature fluctuations was 1–2ºC. In every 400 to 800 years, small cycles of 50 to 100 years could be recognised and the range of temperature fluctuations was 0.5–1ºC. During the coldest periods of these cycles, the cold climate originated from the east coast of the Pacific in East Asia and spread westward to Europe and Africa along the Atlantic. He also emphasised that a comparison of climate histories between China and other areas revealed climatic fluctuations occurring on a global scale. Moreover, while the coldest and the warmest years could be different in places, however, they echoed to each other earlier or later.8 Zhu Kezhen’s findings of warm and cold fluctuations in Chinese history were well taken, regardless of some errors in his interpretations on historical records, such as identifications of place names and implications of certain plants, recently pointed out by younger scholars.9
Following in the footsteps of Zhu Kezhen’s, scholars of the Institute of Geography at the Chinese Academy of Science started in 1977 to collect systematically records
7
Cf. Lü, Jiong 吕炯, Zhang Peiyuan 张丕远, and Gong Gaofa 龚高法, “Zhu Kezhen xiansheng dui qihou bianqian yanjiu de gongxian 竺可桢先生对气候变迁研究的贡献 [Zhu Kezhen and Climatic Fluctuation Studies in China],” Dili yanjiu 地理研究 [Geographical Research] 3.1 (1984): 19–25.
8
Cf. Zhu, Kezhen 竺可桢, “Zhongguo jin wuqian nianlai qihou bianqian de chubu yanjiu 中国近 五千年来气候变迁的初步研究 [A Preliminary Study on the Climatic Fluctuations during the Last 5,000 Years in China],” Kaogu xuebao 考古学报 [The Chinese Journal of Archaeology] 1 (1972): 5– 38.
9
Cf. Mou, Zhongxing 牟重行, Zhongguo wuqiannian qihou bianqian de zaikaozheng 中国五千年 气候变迁的再考证 [Re-verification of Climate Fluctuations during the Past 5000 Years in China] (Beijing: Meteorology Press, 1996); cf. also Zhou, Xiaoyun 周筱赟, “Zhu wen jiumiu erze 竺文纠谬 二则 [Two Errors in Zhu’s Article],” Jinyang xuekan 晋阳学刊 [Academic Journal of Jinyang] 2 (2004).
4
related to climate from historical documents. Within 17 years, they searched through 1,531 titles of classics, histories, thoughts, and literature and obtained more than 30,000 entries of climatic records, of which 22,567 entries (75 per cent) had precise year dated from 30 BCE to CE 1469. Moreover, they gathered records of droughts, floods, and other natural disasters from more than 4,000 titles of local gazetteers, particularly from the Ming (1368–1643) and Qing (1644–1911) Dynasty. From archives of Qing dynasty and the Republican Era (1912–1949), they obtained respectively 91,147 and 10,000 entries related to climate. Climatic records in Chinese historical documents can generally be classified into two categories: (1) direct records of cold or warm climate and their consequences as well as reactions of the officials and the people, and (2) indirect records related to phenology of animals and plants.10 The collection of these data was published as A Compendium of Chinese Meteorological Records of the Last 3,000 Years in 2004 in four volumes: the first volume covers the period from ancient past to Yuan dynasty (23rd century BC to 1367 AD), the second volume the Ming dynasty (1368-1643), the third volume the early Qing dynasty (1644–1795), and the fourth volume the later Qing dynasty (1796– 1911).11
The collection of historical climatic records continued; it was reported in 2010 that a total of 1.16 million entries related to the climate and more than 35 million characters recording rain and snow were found in the records. These original records with their quantitative indices have been organised into a database of 100MB on climate changes in Chinese history. In addition to historical documents, Chinese scholars also utilised archaeological discoveries and proxy data from analyses of ice cores, glaciers, pollen, sediments, and tree rings, as well as records of instrumental observation to study historical climate changes. In the case of tree rings, for instance, the first laboratory was set up in 1986 and a database with more than 13,000 samples of tree rings collected from more than 230 places was established.12
3. Warm and Cold Climate Fluctuations in Chinese History
Warm and cold climate fluctuations in Chinese history were formulated into different series. According to Zhu Kezhen’s findings, young scholars divided the series into
10
Cf. Zhang, Zhongguo lishi qihou bianhua, 197–219. 11
Zhang De’er 张德二, ed., Zhongguo sanqiannian qixiang jilu zongji 中国三千年气象记录总集 [A Compendium of Chinese Meteorological Records of the Last 3,000 Years], 4 Vols. (Nanjing: Fenghuang Press and Jiangsu Educational Press, 2004).
12
Cf. Zheng, Jingyun 郑景云 et al., “Guoqu 2000 nian Zhongguo qihou bianhua yanjiu 过去 2000 年中国气候变化研究 [An Overview of Research on Climate Change in China During the Past 2000 Years],” Dili yanjiu 地理研究 [Geographical Research] 19.9 (2010): 1562.
5
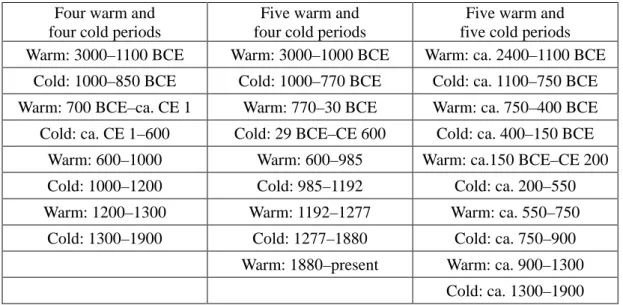
four warm and four cold periods.13 A senior meteorologist in Taiwan came up with five warm and four cold periods for the data he collected himself.14 With the additional data mentioned above, Zhang Peiyuan and his team modified the findings of Zhu Kezhen and classified the climate history of East China in the past 4,000 years into five warm and five cold periods.15 Table 1 shows details of these different series of periods.
Table 1: Periods of Warm and Cold Climate in Chinese History
Four warm and four cold periods
Five warm and four cold periods
Five warm and five cold periods
Warm: 3000–1100 BCE Warm: 3000–1000 BCE Warm: ca. 2400–1100 BCE
Cold: 1000–850 BCE Cold: 1000–770 BCE Cold: ca. 1100–750 BCE
Warm: 700 BCE–ca. CE 1 Warm: 770–30 BCE Warm: ca. 750–400 BCE
Cold: ca. CE 1–600 Cold: 29 BCE–CE 600 Cold: ca. 400–150 BCE
Warm: 600–1000 Warm: 600–985 Warm: ca.150 BCE–CE 200
Cold: 1000–1200 Cold: 985–1192 Cold: ca. 200–550
Warm: 1200–1300 Warm: 1192–1277 Warm: ca. 550–750
Cold: 1300–1900 Cold: 1277–1880 Cold: ca. 750–900
Warm: 1880–present Warm: ca. 900–1300
Cold: ca. 1300–1900
As can be seen, the durations of warm and cold periods are not all identical in the three series. It is notable that in terms of temporal variation, the major difference appeared in the division of warm-cold periods from ca. 750 BCE to CE 1300. The first two series divided into five periods while the third series into seven with a shorter warm-cold cycle. This is due, apparently, to the fact that the third series utilized more abundant data from various sources to identify cycles in a finer way. Moreover, the first and third series did not include the 20th century into analyses, but the second series used some records of temperature to indicate a possible trend of climate warming. And in terms of spatial coverage, the first two series made no specification while the third series confined to East China. In below, some details of the third series will be highlighted.
13
Cf. Jiang, Lübing 江旅冰, Sun Yanmin 孙艳敏, and Ba Mingting 巴明廷, “Lun qihou dui Zhongguo zhengzhi jingji lishi geju yanhua de yingxiang 论气候对中国政治经济历史格局演化的影 响 [On the Climate Affecting Chinese Political, Economical, Historical Structure Evolution],” Chengdu jiaoyu xueyuan xuebao 成都教育学院学报 [Journal of Chengdu College of Education] 18.6 (2004): 72.
14
Cf. Liu, Zhongguo lishishang zhi qihou bianqian, 26–178. 15
6
Major evidences for the five warm and five cold periods in East China are as follows:
(1) Warm climate in Xia and Shang Dynasty (ca. 2400–1100 BCE). The data obtained from pollen analyses revealed the existence of deciduous broad-leaved forests and grassland in the eastern part of the North China Plain. From archaeological excavations at Anyang, bones of roebucks, rhizomys (or bamboo rats), rhinoceros and Asian elephants were found. Trees often mentioned on oracle bone inscriptions included mulberry, bamboo, chestnut, cypress, elm, oak, and willow trees. A bronze tripod containing carbonised plum kernel was discovered in 1975, and the date was determined to be 3200 years before the present. All these provided evidence for a warm climate during this period at the Yellow River basin.16
(2) Cold climate in Western Zhou dynasty (ca. 1100–750 BCE). From the first cultural layer of Xiawanggang site in Xichuan, Henan, bones of animals keen on warm climate were not found and traces of group activity of rhinoceros and Asian elephants no longer existed. Elephant patterns were not seen on bronzes cast after mid Western Zhou.17
(3) Warm climate in Spring-Autumn period (ca. 750–400 BCE). As recorded in the Zuo Annotation of Spring-Autumn Annals (Chunqiu zuozhuan jishi), the harvest date of wheat in 720 BCE and 478 BCE at the lower Yellow River basin was ten days earlier than at present. In the Book of Odes (Shijing), poems referring to the Eastern Zhou (770–249 BCE) revealed the distribution of plum trees in places at today’s western Shandong, eastern Henan and the Qinling mountain area. In the Proceedings of Government in Different Months (Yueling), the phonological timetable was ten days earlier than the present one.18
(4) Cold climate in Warring State period and early Western Han (ca. 400–150 BCE). According to the Mencius and the Guanzi, in the late Warring State period and early Han dynasty, the harvest time of wheat at the lower Yellow River basin was around the summer solstice (June 24), comparatively later than that during the Spring-Autumn period; and the time when temperature began to rise in early spring was more than ten days later than the present one.19
(5) Warm climate from mid-Western Han to end of Eastern Han (ca.150 BCE–CE 200). Fan Shengzhi recorded that in mid-Western Han in Xi’an (in today’s Shaanxi), the soil began to thaw after the beginning of spring and the planting of wet rice began 110 days after the winter solstice (around April 10). Modern science indicates that a stable temperature equal or higher than 12°C is required for early planting of wet rice.
16
Cf. Zhang, Zhongguo lishi qihou bianhua, 283–87. 17 Ibid., 287. 18 Ibid., 288. 19 Ibid., 288–89.
7
The temperature in Xi’an today reaches this level around April 15, thus reflecting that Xi’an during this period had a warmer climate than the present.20
(6) Cold climate in Wei, Jin, and South-North Dynasties (ca. 200–550). In the Arts for the People (Qimin yaoshu), a book on agriculture of the Northern Wei dynasty, the time when peach blossoms began to bloom and jujube began budding was 10 to 15 days later than the present date. At that time, pomegranate grown in open fields had to be wrapped up in winter to avoid freeze injury; however, in today’s Henan and Shandong, the fruit can survive through the winter without the need of being wrapped up.21
(7) Warm climate from Sui to high Tang period (ca. 550–750). Historical documents revealed three characteristics of climate in this period: no extreme fluctuations, no frequent chill, and no apparent rise in temperature. In the Complete Poems of the Tang Dynasty (Quan Tangshi), poems that praised the blooming of plum in the palace courtyard appeared mostly before and during the high Tang period (ca. 713–755). However, there was a rapid decrease in such poems after 750 while those talking about the cold weather grew in number.22
(8) Cold climate from mid Tang to early Five Dynasties (ca. 750-900). Cold events occurred more frequently during this period; in particular, the sea along northern Jiangsu became frozen in 903. This phenomenon was recorded only in this period and in Ming-Qing throughout Chinese history. According to the Compilation of the Four Seasons (Sishi zuanyao), a treatise on agriculture, it was necessary to bury grapes with soil in winter in late Tang in the Guanzhong area (in today’s Shaanxi) to prevent freeze injury. Modern practices show that areas where grapes need to be protected against freeze damage have an average low temperature ranging from –16°C to –20°C, and the climate of Guanzhong does not need to carry out such protection measure. Nevertheless, during this cold period, the boundary of the low-temperature zone had moved southward to Guanzhong area.23
(9) Warm climate from the mid-Five Dynasty to early Yuan period (ca. 900–1300). Warm climate in East China could be evidenced by cultivation of winter wheat, sugar cane, wet rice, tea, orange, and ramie in places of latitudes one to two degrees north of the present boundary where these crops are grown. With the available historical records, periodic temperature anomalies were calculated using the temperatures between 1880 and 1979 as the baseline. The calculation showed that in Kaifeng (in today’s Henan), the winter temperature in 960–1109, 1050–1109 and 1060–1080 was 0.4°C, 0.67°C and 1.1–1.3°C higher, respectively. Moreover, there were marked
20
Cf. Zhang, Zhongguo lishi qihou bianhua, 289. 21
Ibid., 289–90. 22
Ibid., 290–91. 23
8
fluctuations in climate during this warm period. The first cold spell occurred in 960– 1010, followed by a warm spell until the late 11th century. The climate turned cold from 1100 to the late 12th century with notable events such as the freezing of Lake Tai (Taihu) in 1111 and 1132. By the end of the 12th century, the climate became warm again.24
(10) Cold climate from late Yuan to late Qing (ca. 1300–1900). There was an abrupt change of climate in 1230–1260; and thereafter, the temperature in East China remained at a lower level. The attack of snowstorms became more frequent and the Mongolian herders were forced to move southward. There were more frost calamities in the agricultural belt during 1260–1340. The Grand Canal froze in 1309 near Wuxi, in today’s Jiangsu; Lake Tai also froze in 1329 and 1353; the section of the Yellow River in Henan turned to ice in November 1351; and the freezing phenomenon also appeared in Guangzhou in South China. Incidents of natural calamities, mainly caused by snowstorms and droughts, increased at the interlocking belt of agriculture and animal husbandry and further northward. Although scholars derived temperature variations in this cold period with different methods, it was certain that there were three peaks of cold temperature in 1470–1520, 1601–1720 (or 1620–1720), and 1831– 1900 (or 1840–1890). The second cold spell was considered the coldest by most scholars, but there were also evidences indicating the third one to be the most chilly. Available statistics showed that there were 4.4 cold winters every decade in 1601– 1720 but only four in 1831–1900. Most scholars agreed that the lowest temperature appeared in the late 17th century and the early 19th century.25
Taking the winter half-year (from October to March) temperature as an indicator, a study suggested a general tendency of climate change from warm to cold in stages during the past 8,000 years in East China. Warm and cold periods occurred alternately but the fluctuations reflected neither a linear decline nor a general volatility. The process of changes went through four stages: (1) a warm period of 5,500 years from 8000 to 2500 before present; (2) a relatively warm period of 1,560 years in 510 BCE to CE 1050; (3) a relatively cold period of 400 years in 1050-1450; and (4) a cold period from 1450 to the present. It was found that the coldest phase occurred in 1626– 1725, particularly in 1651–1675; and there were 12 cold years in North China, 13 in Central China and nine in South China. Furthermore, analyses of cold years during 1501-1900 in every ten-year and 25-year period in North China, Central China, and South China revealed that there was no consistence in the distribution of cold years among regions. By the late 20th century, the climate seemed not yet ready to enter a
24
Ibid., 293–98. 25
9
new warm stage, even though greenhouse effect, heat island effect, lake effect, oasis effect, and so on brought forth by industrialisation should not be neglected.26
A more recent study reconstructed the winter half-year temperature in East China during the past 2,000 years with an optimal resolution of a thirty-year period; and during 960–1100 and 1500–2000 with an optimal resolution of a ten-year period. Analyses using different scales confirmed that in the past 2,000 years, the 20th-century climate warming was not unique; the degree and speed of warming had not exceeded the highest level ever occurred. By taking the period 1951–1980 as a base for comparison, an analysis with the 100-year scale showed that the anomaly of winter half-year temperature in the 20th century was 0.2 ºC, about the same as that of the Sui-Tang warm period in 570s–770s but lower than that of the two medieval warm periods, 0.4ºC in the 1200s–1310s and 0.3ºC in 930s–1100s. With the 30-year scale, the temperature anomaly of the warmest 30 years in the 20th century was 0.5ºC, lower than 0.9ºC in the medieval warm period and about the same as that of the Sui-Tang warm period. The annual-scale temperature anomaly of the warmest year in the 20th century was 0.9ºC, close to the 1.0ºC of the medieval warm period. On the other hand, the speed of warming in the 20th century was quite similar to that in previous periods of transition from cold to warm in the past 2,000 years. Simulation and cyclical analyses revealed temperature fluctuations in cycles of 200–300 years and quasi 600 years. Diagnosis of self-similar characteristics of the millennium indicated that the process of temperature variation from the year 1500 onward was similar to that during 150–650, and the autocorrelation was most significant by a lag of 1,350 years, thus proving that the pattern of climate warming in the 20th century was similar to that in the Sui-Tang warm period.27
In addition to that of East China, the temperature of West China in the past 1,000 years was also reconstructed using analyses of tree rings and records of instrumental observation. The findings revealed a warm period in 1050–1150, a cold period in 1150–1350 with a short warm spell around 1250, another warm period in 1350–1440, another cold period in 1440–1510 with a warm spell in 1510–1580 followed by a cold period in 1580–1890; and that the climate has rapidly turned warm since the 20th century. The characteristics of cold and warm fluctuations not only reflected the uniqueness of temperature variations in West China, but was also consistent with climate changes in the northern hemisphere and global warming in the 20th century.28
26
Cf. Wen, Huanran 文焕然, and Wen Rongsheng 文榕生, Zhongguo lishi shiqi dongbannian qihou lengnuan bianqian 中国历史时期冬半年气候冷暖变迁 [Climate Fluctuations of Cold and Warm in Winter-half-year in Chinese History] (Beijing: Science Press, 1996), 3, 110–23, 132, 148.
27
Cf. Zheng et al., “Guoqu 2000 nian,” 1563–64. 28
10
For temperature variations in the upper reaches of the Yangzi River during the past 2,000 years, a study on the movements of the northern boundary of litchi distribution obtained the following results: During the period of Han, Jin, and South-North Dynasties, there was no apparent variation. In Tang dynasty, as climate was warm and wet, the northern boundary of litchi distribution reached 31ºN, about two degrees north of the present boundary. In Northern Song, it was possible to distinguish litchi as a natural plant from an economic crop and the northern boundary of natural litchi growth reached 30º40′N in Chengdu area. In the Southern Song, the climate turned cold but it did not affect the growth of litchi in the south of 29ºN. During the Ming-Qing period, the distribution of litchi as an economic crop was limited to the south of 29º30′N, and there was not much cultivation of litchi in Chengdu, Fengjie, Yunyang and Guang’an.29
As for temperature variations in the last 5,000 years in South China, including southeast Fujian, central and southern Guangdong, Guangxi, Hainan, Taiwan and the South Sea islands, a research identified the following warm and cold periods on the basis of historical documents and evidences of animal and plant distributions. From the late Eastern Han to the early Eastern Jin, the climate was warm with evidences of coral reef, wild elephants, and rhinoceros found in this area. From the South-North Dynasties to the Northern Song, the climate was also warm with proofs of rhinoceros, elephants, crocodiles, and boas present in the area. From the late Song to the early Ming, the climate became cold as evidenced by freezing injury to litchi in 1110 and heavy snow in Guangzhou in 1245. From the late 13th to 15th century, the climate turned warm with evidences of increasing numbers of wild elephants, parrots, peacocks, crocodiles, and orang-utans. During the Ming-Qing little ice age, extreme cold events occurred in 1506, 1655–1656, 1737, and 1892–1893, with 1892 being the coldest year ever in this area.30
Using records of extreme cold events, droughts, floods, typhoons, famines and good harvests, a study calculated the correlation of these events and derived cycles of different lengths during 1400–1949 in Guangdong province. There were cycles of 20– 30 years and 150 years. Floods and droughts had their own cycles; the 23.1-year cycle of floods and the 30.0-year cycle of droughts both reached a significant level of 95 per cent. Long-term vibrations of typhoons and extreme cold events were identical. It was
29
Cf. Lan, Yong 蓝勇, “Jin 2000 nianlai Changjiang shangyou lizhi fenbu beijie de tuiyi yu qiwen podong 近 2000 年来长江上游荔枝分布北界的推移与气温波动 [The Movements of the Northern Boundary of Litchi Distribution and Fluctuations of Temperature in the Upper Reaches of The Yangzi River in the Past 2000 Years],” Disiji yanjiu 第四纪研究 [Quaternary Science] 1 (1998): 40–42.
30
Cf. He, Yeheng 何业恒, “Jin wuqiannianlai huanan qihou lengnuan de bianqian 近五千年来华 南气候冷暖的变迁 [The Cold and Warm Climate Change in South China During the Past 5000 Years],” Zhongguo lishidili luncong 中国历史地理论丛 [Collections of Essays on Chinese Historical Geography] 1 (1999): 197–203.
11
also hypothesised that the humidity index decreased during cold periods when there were also more frequent droughts, floods, and typhoons. In other words, during the little ice age, the precipitation rate increased but the amount decreased; and the climate of Guangdong became more similar to the continental climate.31
Between 1488 and 1893, snowing in the Pearl River delta was recorded in 42 years. During this period, there were three cold spells and two warm spells. The first cold spell in 1569–1618 was marked by heavy snow; the second cold spell in 1634–1685 featured accumulated snow and freeze; and the third cold period occurred during late Qing with an extreme cold event in early 1893. The three cold spells were interrupted with short intervals of warm climate, indicating fluctuations in temperature even in the little ice age.32
For the climate of Taiwan in the last 500 years, a study using tree rings of Taiwan fir (Abies kawakamii (hayata) Ito) and Taiwan red cypress (Chamaecyparis formosensis Matsum.) found two cold periods, one from the early 17th to the early 18th century and the other in the mid 19th century. Thus, the cold spells in Taiwan occurred more or less during the same periods as those in South China.33
As for the climate in Southwest China, the historical records of snow accumulation on Diancang Mountain in Yunnan revealed cycles of temperature fluctuations as follows. The climate was warm in Tang dynasty, cold in Yuan dynasty, warm from late Yuan to early Ming, and cold from then on until 1733 with many records of year-round snow accumulation, a short warm spell in 1733–1741 with the climate quickly turning cold again until 1850; and then a short warm spell in 1850–1860. It is suggested that as Yunnan is located at high altitude of low latitude, its characteristics of climate variations in history should be taken into consideration in modern development.34
31
Cf. Zheng, Sizhong 郑斯中, “Guangdong xiaobingqi de qihou jiqi yingxiang 广东小冰期的气 候及其影响 [The Climate of Guangdong in the Little Ice Age and its Impact],” Kexue tongbao 科学通 报 [Chinese Science Bulletin] 5 (1982): 302–03.
32
Cf. Li, Pingri 李平日, and Zeng Zhaoxuan 曾昭璇, “Zhujiang sanjiaozhou wubai nianlai de qihou yu huanjing bianhua 珠 江 三 角 洲 五 百 年 来 的 气 候 与 环 境 变 化 [On the Climatic and Environmental Changes in the Pearl River Delta during the Last 500 Years],” Disiji yanjiu 第四纪研 究 [Quaternary Science] 1 (1998): 65–67.
33
Cf. Zou, Peishan 鄒佩珊, “Taiwan shanqu jin wubainian de qihou bianhua: shulun kuandu de zhengju 臺灣山區近五百年的氣候變化: 樹輪寬度的證據 [Climate Change in Taiwan’s Mountain Area in the Past 500 years: Evidences of Tree Rings],” Ph.D. diss. (National Taiwan University, 1998), 181 pages.
34
Cf. Yu, Xixian 于希贤, “Cangshan xue yu lishi qihou lengqi bianqian yanjiu 苍山雪与历史气 候冷期变迁研究 [A Study on the Cang Mountain Snow and Changes in Cold Climate in History],” Zhongguo lishidili luncong 中 国 历 史 地 理 论 丛 [Collections of Essays on Chinese Historical Geography] 2 (1996): 26–39.
12
4. Drought and Flood Periods in Chinese History
A project launched by the Central Meteorology Institute in the 1970s produced a volume of maps illustrating the distribution of droughts and floods in China in the past 500 years.35 By 2003, the supplementary maps were extended to the year 2000.36 In Chinese historical documents, the terminology describing drought or flood remained quite similar, it was thus possible to classify these events into five grades as follows. The first grade is drought (han) lasting several months or across the seasons; the second grade is partial drought (pianhan) occurring in one month of one season or with light calamity; the third grade is normal (zhengchang) identifying good harvest or normal harvest; the fourth grade is partial flood (pianlao) identifying rainfall in one season with light calamity or flood in some parts of an area; and the fifth grade is flood (lao) identifying rainfall of long duration and strong intensity, flood in a large area, or flood caused by typhoon.37
An early study tried to classify droughts and floods in the past 500 years into five types. The first type was high precipitation in the Yangzi River basin; the second type was high precipitation to the south of the Yangzi and low precipitation to the north of the Yangzi; the third type was low precipitation in the Yangzi River basin with one rainfall belt each to the south and to the north; the fourth type was low precipitation to the south of the Yangzi and high precipitation to the north of the Yangzi; and the fifth type was low precipitation all over the country. Examining the incidence of each type in every 50 years revealed climate changes in the following order: The first type of precipitation pattern dominated in 1550–1600; the second in 1600–1650; the third and fourth types in 1650–1700; and the fifth type in 1700–1750. After two centuries, a similar cycle of precipitation patterns occurred again; but it was notable that in the
35
Cf. CMI, Zhongyang qixiangju qixiang kexue yanjiuyuan 中 央 气 象 局 气 象 科 学 研 究 院 [Chinese Academy of Meteorological Sciences], ed., Zhongguo jin wubainian hanlao fenbu tuji 中国近 五百年旱涝分布图集 [Charts of Droughts and Floods in the Past 500 Years in China] (Beijing: Atlas Press, 1981), 332 pages.
36
Cf. Zhang De’er 张德二, and Liu Chuanzhi 刘张志, “Zhongguo jin wubainian hanlao fenbu tuji xubu (1980–1992) 中国近五百年旱张分布张集张张 (1980–1992 年) [A Supplement of Charts of Droughts and Floods in the Past 500 Years in China (1890–1992)],” Qixian 气象 [Meterological Monthly] 11 (1993): 41–45; Zhang De’er 张德二, Li Xiaoquan 李小泉, and Liang Youye 梁有叶, “Zhongguo jin wubainian hanlao fenbu tuji zai xubu (1993–2000) 中国近五百年旱张分布张集再张 张 (1993–2000 年) [A Further Supplement of Charts of Droughts and Floods in the Past 500 Years in China (1993–2000)],” Yinyung qixian xuebao 张 用 气 象 学 张 [Quarterly Journal of Applied Meteorology] 3 (2003): 379–389.
37
Cf. Zhang, Zhongguo qihou zonglun, 320; cf. also Zhang, Zhongguo lishi qihou bianhua, 199– 200.
13
first half of the 20th century, the fifth type with low precipitation all over the country dominated ten of the 50 years.38
A comparison of precipitation anomalies showed that the stages of drought and flood in China and Europe had been rather similar since the second century. For instance, China tended to have higher precipitation from the 700s to the 1300s, while Europe experienced abundant rainfall from the 800s to the 1200s; and both China and Europe tended to have lower precipitation from the 300s to the 600s. However, the time of transition and the degree of drought and flood in China and Europe were different.39
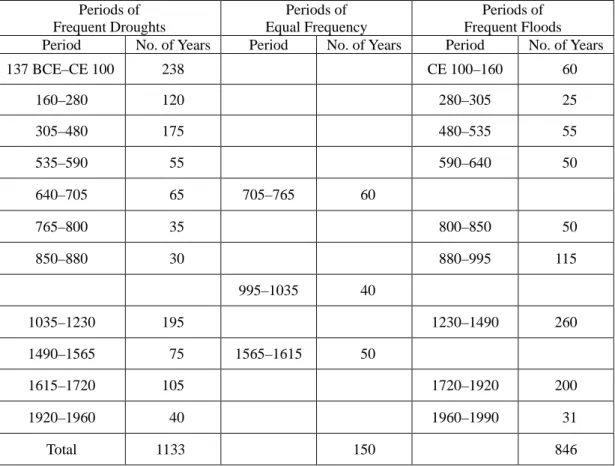
Table 2 is a summary of the drought and flood periods in Chinese history from 137 BCE to CE 1990 obtained by the Fuzzy Clustering Method (FCM).40
Table 2: Periods of Droughts and Floods in Chinese History Periods of Frequent Droughts Periods of Equal Frequency Periods of Frequent Floods Period No. of Years Period No. of Years Period No. of Years
137 BCE–CE 100 238 CE 100–160 60 160–280 120 280–305 25 305–480 175 480–535 55 535–590 55 590–640 50 640–705 65 705–765 60 765–800 35 800–850 50 850–880 30 880–995 115 995–1035 40 1035–1230 195 1230–1490 260 1490–1565 75 1565–1615 50 1615–1720 105 1720–1920 200 1920–1960 40 1960–1990 31 Total 1133 150 846
As can be seen, during these 2,129 years, there were 11 periods with a total of 1,133 years in which droughts occurred frequently, nine periods with a total of 846 years in which floods occurred frequently, and three periods with a total of 150 years
38
Cf. Wang, Shaowu 王绍武, and Zhao Zongci 赵宗慈, “Jin wubainian woguo hanlao shiliao de fenxi 近五百年我国旱涝史料的分析 [An Analysis of Historical Data of Droughts and Floods in the Last 500 Years in China],” Dili xuebao 地理学报 [Acta Geographica Sinica] 34.4 (1979): 338–40.
39
Cf. Zhang, Zhongguo qihou zonglun, 319–20. 40
14
in which the frequency of drought and flood occurrences were the same. The duration of frequent drought periods ranged from 30 to 283 years, with the five longest periods occurring in 137 BCE–CE 100 (283 years), 1035–1230 (195 years), 305–480 (175 years), 160–280 (120 years), and 1615–1720 (105 years). The duration of frequent flood periods ranged from 25 to 260 years, with the three longest periods occurring in 1230–1490 (260 years), 1720–1920 (200 years), and 880–995 (115 years). Moreover, the year 1230 was considered to be a turning point from a relatively wet period to a relatively dry period. The wet period could be further divided into four phases: a relatively wet phase before the year 280; a phase of frequent droughts in 280–480; and phases of frequent floods in 480–880 and 880–1230. During the dry period, the most serious droughts occurred around 1230, 1450, 1490, and 1560; while the most serious floods occurred around 1300, 1400, 1750, and 1830–1910.41
After eliminating accidental errors by a moving average of every 50 years, it was found that in the past 2,000 years, there were 10 partial flood periods and 11 partial drought periods in the area of Yangzi and Huai Rivers; and there were eight partial flood periods and 11 partial drought periods in North China. These statistics revealed that North China was prone to drought, and the transition from drought to flood or vice versa in the two areas did not occur at the same time.42
As for regional differences in droughts and floods in a great cycle, taking the 400 years from 1631 to 1950 for example, the transition from drought to flood or vice versa all started from Shanxi and Shaanxi region, followed by North China and Shandong, and then regions to the south including northern Jiangsu and Anhui, Yangzi Delta, Central China, Hunan and Jiangxi, Yunnan and Guizhou, Guangdong and Guangxi, as well as Fujian and Zhejiang. Moreover, each region had various short periods of drought and flood, and thus the changes in climate were actually very complicated.43
A recent study with statistical analyses of drought and flood variations in East China during the past 1,500 years showed that there were main cycles of 70–80 years (in which each dry and wet period lasted 30–50 years), quasi 22 years and 2–4 years. There were abrupt changes around 720, 1050, 1230, 1350, 1610, 1730, and 1915. In the past 1,500 years, there were 18 serious consecutive floods and 16 serious consecutive droughts, with the most serious droughts occurring in 1634–1644. In East China, droughts happened mainly from 1100 to 1300, but floods had become more frequent since 1650. The severity of floods in the 20th century was similar to that in the historical period, but the severity of droughts had declined, proving that the
41
Cf. Zhang, Zhongguo lishi qihou bianhua, 315–16. 42
Ibid., 231–234. 43
15
variation in rate of precipitation in the 20th century did not surpass the natural variation in the past 1,500 years.44
Qing archival records of rain and snow revealed variations in precipitation over the past 300 years. In addition, experimental observations made at 28 stations shed light on the relationship between precipitation and depth of infiltration, as well as variations of summer monsoon and rainfall. Taken together, results of analyses showed that in the middle and lower reaches of the Yellow River, high precipitation occurred in 1791–1805, 1816–1830, and 1886–1895, while low precipitation happened in 1916–1945 and 1981–2000. Variations in precipitation had cycles of 2–4 years, quasi 22 years and 70–80 years. There was an abrupt change in 1915 when the amount of precipitation changed suddenly from large to small. Thereafter, the signal of a quasi 22-year cycle weakened, then disappeared in the late 1940s and was finally replaced by the cycle of 35–40 years. In the lower Yangzi River area, the centennial and annual fluctuations of plum rain were extremely striking. Longer plum rain periods occurred in 1771–1820, 1871–1920 and 1971–2000, while shorter plum rain periods happened in 1736–1770, 1821–1870, and 1921–1970. The annual fluctuations increased during 1821–1890, decreased during 1891–1940, and increased again after 1940. During the plum rain period, there were greater annual fluctuations of rainfall and there were cycles of 20–40 years and quasi 40 years. It was also obvious that when the East Asian summer monsoon was strong, the plum rain period was short, and vice versa.45
As for the precipitation fluctuations at Qinghai-Tibet Plateau, analyses of more than 1,000 samples of tree rings from seven locations in the past 1,437 years revealed that there were cycles of 150–250 years and 70–80 years, and the fluctuations were closely related to stages of solar activity. The three longest periods with the lowest precipitation occurred in the late 15th century, from the late 17th to the early 18th century, and from the late 18th to the early 19th century. Moreover, prior to the year 1200, the fluctuations of precipitation were smaller, followed by more marked variations, implying an abrupt climate change occurring around 1200.46
The case study of Anhui showed that during 1650–1949, there were a total of 108 floods and droughts occurring along the two rivers in the province; the Huai River area had 56 and the Yangzi River area had 52; meaning the occurrence of a disaster every 5 to 6 years on average. Moreover, there were more floods than droughts; the Huai River area had 36 floods and 20 droughts while the Yangzi River area had 37 and 15, respectively. The disasters were also of different scales. The Huai River area only had two serious droughts out of 20, while the Yangzi River area had nine out of
44
Cf. Zheng et al., “Guoqu 2000 nian,” 1565. 45
Ibid., 1566–67. 46
16
15. The Huai River area had 13 serious floods out of 36, while the Yangzi River area had 17 out of 37. In other words, serious disasters occurred more frequently in the Yangzi River area. Their patterns of change and frequencies also differed. The Huai River area had four periods with higher disaster frequencies with an average of 31 years each, while the Yangzi River area had five with an average of 34 years each. The Huai river area had three periods of lower disaster frequencies with an average of 59 years each, while the Yangzi River area had four with an average of 33 years each. During the periods with higher disaster frequencies, the Huai River area had one disaster in every three years, while the Yangzi River area had one in every four years. During the periods of lower disaster frequencies, the Huai River area had one disaster in every 15 years, while the Yangzi River area had one in every 17 years. As for seasonal variations, floods occurred mostly in summer and autumn in both areas, but they were more concentrated in summer in the Yangzi River area. Droughts also occurred mostly in summer and autumn but summer droughts were of a larger share, and spring droughts were also notable in the Huai River area. The concentration of floods and droughts in Anhui was due mostly to uneven precipitation, but the autumn floods in Anhui were also related to floods in the Yellow River area, in addition to natural factors of abnormal rainfall, atmospheric circulation and solar activity.47
The case study of Yunnan province during the past 500 years found alternate dry and wet periods as follows. The dry period in 1500–1689 had 35 years of drought and 22 years of flood; the wet period in 1690–1929 had 66 years of flood and 31 years of drought; and the dry period in 1930–1994 had 20 years of drought and 15 years of flood. Moreover, there were 10 partial flood periods and nine partial drought periods, which occurred alternately; and there were only two consecutive partial flood periods in the 18th and 19th centuries. The duration of partial drought periods ranged from 15 to 48 years with an average of 27 years; while that of partial flood periods ranged from 11 to 39 years with an average of 25 years.48
5. Impacts of Climate Changes in Chinese History
The reconstruction of historical climate changes has encouraged more scholars to discuss the relationship between climate changes and human activities of significant
47
Cf. Shi, Hejin 施和金, “Anhui lishi qihou bianqian de chubu yanjiu 安徽历史气候变迁的初步 研究 [Preliminary Research on Climatic Change in History of Anhui Province],” Anhui shixue 安徽 史学 [History of Anhui] 4 (2004): 60–63.
48
Cf. Wang, Yu 王宇, “Yunnan 500 nianlai ganshi bianhua ji weilai qushi yuce 云南 500 年来干 湿变化及未来趋势预测 [Variations and Trend Predictions of Dryness and Wetness in Yunnan Province during the Last 500 Years],” in Zhongguo de qihou bianhua yu qihou yingxiang yanjiu 中国 的气候变化与气候影响研究 [A Study on Climatic Changes and Climatic Influences in China], ed. Ding Yihui 丁一汇 (Beijing: Meteorology Press, 1997), 354.
17
impacts in Chinese history. For instance, the cold climate in the transition period from Western Han to Eastern Han and at the end of Eastern Han period had induced two waves of north-south migrations, resulting in population increase in places such as Changsha, Guiyang, and Lingling (in today’s Hunan), rapid economic development in the area south of the Yangzi River, and the eastward shift of the centre of political power.49 It was pointed out that the move of the capital city of Northern Wei dynasty in 494 from Pingcheng (today’s Datong, Shanxi) to Loyang was related to the cold climate at that time.50 A recent study suggested that the cold climate during the period of Eastern Han, Wei and Jin not only caused nomadic groups from the north to move southward, but also forced the Han Chinese to migrate on a large scale. These migrations changed the political, economic and cultural order in the Central Plain area and shifted the core of Han culture to the south. Hence, the factor of climate should not be neglected in the discussion of this Han cultural shift.51
According to archaeological findings, in the Neolithic period (more than 5000 years before present) North China was an area of primitive agriculture supplemented with gathering, fishing and hunting. Around 3500–3000 years before present, inceptive husbandry emerged and an area dominated by husbandry and riding ethnic groups was established. The area of primitive agriculture shrank in size and later transformed into a combination of agriculture and husbandry around 1500 BCE when the climate turned from warm-wet to cold-dry. From 1500 BCE, the cold-dry climate induced ancient people to start moving southward and eastward and by 400 BCE, the interlocking belt of agriculture and husbandry in North China was established.52
A comprehensive study on the relationships between climate changes and southward migrations of nomadic ethnic groups in the past 2,000 years
49
Cf. Wang, Zijin 王子今, “Shilun Qin Han qihou bianqian dui Jiangnan jingji wenhua fazhan de yiyi 试论秦汉气候变迁对江南经济文化发展的意义 [A Discussion on the Significance of Climate Change on Economic and Cultural Development in Jiangnan in the Qin and Han Period],” Xueshu yuekan 学术月刊 [Academic Monthly] 9 (1994): 63–69; cf. also Wang, Zijin 王子今, “Qin Han shiqi qihou bianqian de lishixue kaocha 秦汉时期气候变迁的历史学考察 [A Historical Inquiry of the Climate Change in the Qin and Han Period],” Lishi yanjiu 历史研究 [Historical Research] 2 (1995): 18–19.
50
Cf. Xu, Shengyi 徐勝一, “Bei Wei Xiaowendi qiandu Luoyang yu qihou bianhua zhi yanjiu 北 魏孝文帝遷都洛陽與氣候變化之研究 [A Study on the Move of Capital City to Luoyang by Xiaowen Emperor of Northern Wei],” Shida dili yanjiu baogao 師大地理研究報告 [Journal of
Geographical Research of Normal University] 38 (2003): 1–12.
51
Cf. Wu, Jianqing 武剑青, “Dong Han Wei Jin qihou bianqian yu Han wenhua zhongxin de nanyi 东汉魏晋气候变迁与汉文化重心的南移 [Climate Change during the Period of Eastern Han, Wei and Jin and the Southward Movement of the Han Cultural Center],” Zhoukou shifan xueyuan xuebao 周口师范学院学报 [Journal of Zhoukou Normal College] 25.6 (2008): 93–95.
52
Cf. Han, Maoli 韩茂莉, “Zhongguo beifang nongmu jiaocuodai xingcheng yu qihou bianqian 中 国 北 方 农 牧 交 错 带 形 成 与 气 候 变 迁 [Formation of the Interlocking Belt of Agriculture and Husbandry and Climatic Change in Ancient North China],” Kaogu 考古[Archaeology] 10 (2005): 57– 67.
18
cross-examined the curves of temperature fluctuations, variations in droughts and floods, and changing southern boundaries of nomadic frontiers on the same time scale. It was found that the rise and fall of nomadic dynasties as well as the stages and ranges of southward migrations were consistent with the cycles of climate change. A corresponding analysis of climate changes and dynastic cycles attributed the repeated penetration of nomadic nationalities into the Yellow River and Yangzi River areas in the past 2,000 years to a continuous shortening of the warm and humid periods, the persistent lengthening of the cold and dry periods, and the increasing severity of droughts. However, it was also stressed that historical developments, including rise and fall of dynasties and movements of nomadic groups, were the results of interactions among various factors with climate change being just a predisposing one. In other words, the chain effect or the feedback mechanism of climate-ecology-economy-society was influential in the social and historical process.53
The causes of nomadic migrations from Qin to Tang Dynasty (246 BCE–CE 907) were explored using the ‘pull and push’ theory: the ‘push’ factors were found to include (1) development of social productivity and population increase of nomadic groups; (2) frequent cold climate-induced natural disasters; (3) wars between neighbouring groups, internal conflicts, and both; and (4) migration policy initiated by the ruler. On the other hand, the ‘pull’ factors comprised (1) appeasement policies; (2) better conditions of living and production; and (3) sense of national identity. Instead of being the sole cause, climate change was one of the contributing factors for migrations of northern ethnic groups in ancient China.54
It is notable that in the past 2,000 years, the difference in climatic changes between East and West China had decisive impacts on the rise and decline of the Silk Road. In East China, warm-humid and cold-dry periods occurred alternately, whereas in West China, cold-humid and warm-dry periods occurred alternately. The Silk Road thrived and prospered when East China had warm-humid climate and West China had a cold-humid climate, such as the Western Han, Sui-Tang, and Yuan periods. On the contrary, the Silk Road became blocked and desolate when East China had cold-dry
53
Cf. Wang, Huichang 王会昌, “2000 nianlai Zhongguo beifang youmu minzu nanqian yu qihou bianhua 2000 年来中国北方游牧民族南迁与气候变化 [The Relationship between the Migrating South of the Nomadic Nationalities in North China and the Climatic Changes],” Dili kexue 地理科学 [Scientia Geographica Sinica], 16.3 (1996): 274–78.
54
Cf. Li, Jihe 李吉和, “Zhongguo gudai shaoshu minzu qianxi yuanyin tantao 中国古代少数民族 迁徙原因探讨 [The Reasons for Migration of Ancient Chinese Ethnic Groups],” Zhongnan minzu daxue xuebao (renwen shehui kexue ban) 中 南 民 族 大 学 学 报 ( 人 文 社 会 科 学 版 ) [Journal of South-Central University for Nationalities (Humanities and Social Sciences)], 24.1 (2004): 71–75.
19
climate and West China had warm-dry climate, such as the periods in Eastern Han, Wei, Jin, and South-North Dynasties, Five Dynasties, Song, Ming and Qing.55
Outbreaks of wars and uprisings were also found to be related to the climate. A comparison between the frequency of wars and temperature fluctuations during 850– 1911 using the Pearson correlation showed that periods with frequent outbreaks of wars coincided with those of cold climate. Of the three periods with an extremely high frequency of wars (more than 50 wars in every 10 years), two occurred during the cold periods of the Ming-Qing little ice age (1583–1717 and 1806–1912). Of the eight cold periods, six had one to two phases with frequent outbreak of wars (more than 25 wars in every 10 years). Of the 10 periods with a high frequency of wars, eight had cold climate, except for those two periods in the 16th century. Moreover, rebellions and revolutions accounted for the largest share (46 per cent) of all types of confrontations, and the frequency of rebellions and revolutions was also closely related to temperature fluctuations. In addition, there was an apparent difference in the geographical distribution of wars. In warm and wet South China, the relation between the frequency of war and temperature fluctuations was rather weak. In North China, most wars occurred during cold periods and there was a relatively high frequency of wars during 1300–1600. In Central China, out of the seven periods with a high frequency of wars (more than 20 wars in every 10 years), six were in cold periods. Since the year 850, seven of the eight cold climate periods have coincided with the fall and rise of dynasties and large-scale turmoils. Out of the 24 dynastic rises and falls, only the rise of the Tangut (Xixia, 1038), the fall of the Yuan and the rise of the Ming (1367–1368) occurred during warm spells. The reaction of the society to climate changes also differed geographically. In South China, society was not so sensitive to cold climate. In Central China, however, temperature fluctuations had a great impact on agricultural production and wars often broke out slightly after the cold period began because harvests obtained in the warm period could last for a while. In North China, the correlation between the outbreak of wars and climate change was insignificant because the northern ethnic groups ruled over China for more than 400 years from Tang to Qing Dynasty. They could move freely southward during cold periods, or resources could be transported to the north when necessary.56
55
Cf. Du, Zhongchao 杜忠潮, “Zhongguo jin liangqianduonianlai qihou bianqian de dongxi fenyi ji dui sichouzhilu xingshuai de yingxiang 中国近两千多年来气候变迁的东西分异及对丝绸之路兴 衰的影响 [Influence of the East-West Difference of the Climatic Changes since Recent 2000 Years on the Rise and Decline of Silk Road in China],” Ganhanqu dili 干旱区地理 [Arid Land Geography] 19.3 (1996): 50–57.
56
Cf. Zhang, Dian 章典 et al., “Qihou bianhua yu Zhongguo de zhanzheng, shehui dongluan he chaodai bianqian 气候变化与中国的战争、社会动乱和朝代变迁 [Climate Changes and War, Social Disorder, and Dynastic Change in China],” Kexue tongbao 科学通报 [Chinese Science Bulletin] 49.23 (2004): 2468–73.
20
Another study found that the number of wars peaked in 1000–850 BCE, CE 200– 600, 850–1280, the late 14th century, the mid-17th century, and the mid-19th century. These periods were consistent with the cold periods of 1000 BCE, CE 400, 1200 and 1700 marked out by Zhu Kezhen. Hence, the concurrence of cold periods with dynastic rises and falls was more than a mere coincidence.57
A recent study on the wars between the Song and the Xixia confirmed the relation between climate changes and frequency of wars. Song-Xia wars were fought at today’s eastern Qinghai, Ningxia, central and northern Shaanxi, western Inner Mongolia, and Gansu. The climate of these areas was colder and dryer in Northern Song than today. Song-Xia wars (in 981–1126) were three times more in number and 3.6 times more frequent than Song-Liao wars (in 960–1124). Moreover, all Song-Liao wars took place in the early Song and no battles were fought during 1005–1121. Such differences in number and frequency of wars were mainly due to the disparity of climate conditions between the two regions. The temperature curves of 620–1280 indicated that fluctuations were more intense in the mid-eastern part of Northwest China than in North China, particularly after the mid-11th century. A comparison of wars occurring in Northwest China from the Tang to the Southern Song also revealed that wars broke out more frequently in Northern Song than in Southern Song. Moreover, examinations of the number of Song-Xia wars and temperature fluctuations during 960–1127 revealed that the number of wars increased with decreasing temperature and peaked around the year 1100, which was also the coldest period in the northwest area during the Northern Song. In other words, there exists a negative correlation between the number of Song-Xia wars and temperature in the region. Furthermore, a high frequency of Song-Xia wars was in agreement with cold periods. Although there was a time lag of about 10 years, in general, warm periods corresponded with tranquil eras while cold periods matched with turmoil times. In addition, the fluctuations of flood and drought indices, in particular the drought index, were consistent with the variations in number of wars. Nevertheless, such correspondence was more evident since the mid-Northern Song, indicating that the impact of droughts was greater in the area where Song-Xia wars broke out.58
Some historians focused their discussion on the relationship between climate change and dynastic transition. A study pointed out that although the climate was in
57
Cf. Wang, Junjing 王俊荆 et al., “Qihou bianqian yu Zhongguo zhanzhengshi zhijian de guanxi zongshu 气候变迁与中国战争史之间的关系综述 [Relationship between Climate Changes and Wars in the History of China],” Zhejiang shifan daxue xuebao (ziran kexue ban) 浙江师范大学学 报(自然科学版) [Journal of Zhejiang Normal University (Natural Science)] 31.1 (2008): 91–96.
58
Cf. Jin, Yongqiang 金勇强, “Qihou bianhua dui Song Xia zhanshi de yingxiang shulun 气候变 化对宋夏战事的影响述论 [Influence of Climate Change on the War between Song and Xia,” Ningxia shehui kexue 宁夏社会科学 [Social Sciences in Ningxia] 1 (2010): 92–97.
21
general warm and wet during the Tang dynasty, it became cold in the mid eighth century. Such climate changes intensified the pressure for the northern nomadic people to move south, and the An Lushan Rebellion (755–759) was a turning point of this southward migration.59 Another study provided details of droughts and other disasters since the mid-Tang such as frost, hail, sand storm, plague of locusts, epidemics, and how these calamities gradually exhausted the national strength, thus paving the way for the fall of Tang dynasty.60 Similarly, the collapse of Ming dynasty was precipitated by famines, epidemics and rebellions during 1620–1644. About the same time in France, revolutions were suppressed by Louis XIII with great brutality. It was suggested that rebellions in the East and the West were results of the little ice age in the 17th century.61 A more general study pointed out that climate change affected not only dynastic rise and fall but also the relations between agricultural and nomadic societies in Chinese history. Although such claim did not have its basis on ‘environmental determinism’ alone, it did emphasise the importance of climate as one of the factors determining the historical development, direction, speed and process, as well as the shifting of political centre to the north and economic centre to the south in Chinese history.62
The relationship between climate change and population fluctuations in Chinese history has also been explored. From Qin to Qing Dynasty, Chinese population witnessed eight large fluctuations including (1) a decrease of 40 per cent during the transition from Western Han to Eastern Han in the early first century; (2) a decrease in the period of Wei, Jin, and the South-North Dynasty, with the population in the beginning of Sui Dynasty around the year 600 about the same as that in the late Eastern Han around the year 220; (3) a decrease of 50 per cent during the transition from Sui to Tang; (4) a decrease of around 50 per cent from the mid-Tang to the Five Dynasties; (5) a decrease of 20 per cent during Jin and Yuan periods; (6) a decrease of 25 per cent during the transition from Yuan to Ming; (7) a decrease of 20 per cent during the transition from Ming to Qing; and (8) a decrease of 10 per cent at the end
59
Cf. Lan, Yong 蓝勇, “Tangdai qihou bianhua yu Tangdai lishi xingshuai 唐代气候变化与唐代 历史兴衰 [Climate Variations and the Rise and Fall of the Tang Dynasty],” Zhongguo lishidili luncong 中国历史地理论丛 [Collections of Essays on Chinese Historical Geography] 16.1 (2001): 4–15.
60
Cf. Ren, Shumin 任树民, “Qihou bianhua jiasu Tang wangchao shuaiwang de jingshi yu fansi 气候变化加速唐王朝衰亡的警示与反思 [The Warning and Reflection on Climate Change Speeded up the Decline of Tang Dynasty],” Qinghai shizhuan xuebao (Jiaoyu kexue) 青海师专学报(教育科学) [Journal of Qinghai Junior Teachers’ College (Education Science)] 3 (2009): 29–32.
61
Cf. Wang, Rongzu 汪荣祖, “Qihou bianhua yu Ming Qing daixing 气候变化与明清代兴 [Climate Change and the Ming and Qing Transition].” In Jinian Chen Yinque xiansheng danchen bainian xueshu lunwen ji 纪念陈寅恪先生诞辰百年学术论文集 [Studies in Honour of Professor Chen Yinque], ed. Center for Study of Chinese Medieval History, Peking University (Beijing: Peking University Press, 1989), 333–36.
62
22
of the Qing compared with that in 1850. The impact of climate change on population could be both direct and indirect. Direct impacts induced changes in agricultural production and thus changes in population; while indirect impacts referred to social conflicts and crises, disintegration of social structures, and the spread of infectious diseases brought in from outside, which led to a decrease in population. The impact of climate on agricultural production was more apparent and greater in areas of high latitude, such as North China, where the growing season was shorter. During the 400 years from late Eastern Han to mid Sui, there was no population increase at all and this happened to be a long cold period. In early Yuan, transition from Yuan to Ming, and transition from Ming to Qing, infectious diseases brought in by nomadic groups had a great impact on the population. Disintegration of social structure turned people into refugees; and when climate change affected a large area, the locals were not able to help refugees and conflicts were likely to break out between the two groups. The state system would be weakened by these confrontations with its power further undermined by separate regimes. Thus, the vicious cycle became worse and finally led to the collapse of society. Such historical processes could often be observed during periods of population decline. Moreover, cold and dry climate drove not only the agricultural belt but also the pastoral belt to move southward. Six of the eight periods of population decline, except for the first and the eighth, were periods when nomadic or semi-nomadic groups of the north migrated southward.63
As for the southward shift of the economic centre during the Song period, a very recent study highlighted the climate change as the major contributing factor by eliminating possible factors such as population, institution, ideology, and improvement in labour productivity. The cold climate brought forth a decline of agricultural production in North China, and the decrease in total productivity reduced its capacity to provide for the population, leading to a stagnation of the economy. On the other hand, the cold climate in South China did not much affect rice production but made wheat cultivation possible. Thus, the double cropping system developed, which raised the unit productivity of the land and in turn increased the capability of supporting the people by one single unit of land. In addition, two measures were adopted in the south. One was intensive cultivation and the other was the cultivation of economic crops, which led to a commercialisation of agriculture. The impacts of climate change on agriculture also influenced indirectly the development of handicraft as surplus labour released from farming could turn to handicraft production. During the Northern Song period, the transportation via the Bian Canal declined because of
63
Cf. Li, Bozhong 李伯重, “Qihou bianhua yu Zhongguo lishishang renkou de jici daqi daluo 气候 变 化 与 中 国 历 史 上 人 口 的 几 次 大 起 大 落 [Climate Change and Some Great Fluctuations of Population in Chinese History],” Renkou yanjiu 人口研究 [Population Research] 23.1 (1999): 15–18.
23
its silting up while navigation along the Yangzi River developed to sustain the prosperous commercial economy. In summary, climate change was the basic factor affecting a shift of the economic centre from north to south.64
A study on the relationship between climate change and economic development in the Lake Tai area during the Ming-Qing period pointed out that during this cold period, Lake Tai froze frequently in the 16th and 17th centuries and that there were frequent floods in the early 17th century. However, since the mid-17th century, the climate turned to become very dry. The impacts of climate change on agriculture of the Lake Tai area could be seen from the changes in cropping systems, decrease in multiple cropping indices and grain production, as well as a large reduction in the planting area of economic crops, such as orange and tea.65
As for economic decline during the mid-19th century, a case study of Songjiang (in today’s Jiangsu province) discussed the impact of climate change using detailed historical materials and rigorous analyses. Signs of economic depression in Daoguang reign (1821–1850) appeared in Jiangnan, or the lower Yangzi area. The land prices dropped sharply, agricultural production declined with costs remaining high, the income of farming households decreased enormously accompanied with a decline in production capability, and the rural cotton industry was on the verge of bankruptcy. A direct consequence of such economic crisis was the Taiping Rebellion (1851–1864). The drastic climate change in the early 19th century was one of the complicated causes of ‘Daoguang depression’. In Songjiang, three serious floods took place in 1823, 1833, and 1849 with the 1823 flood as a landmark event. Again, the root cause of these serious floods was climate change. In the northern hemisphere, temperature started to drop in 1816—the ‘Year without a summer’66—with temperature being 0.6ºC lower than the average in 1880–1975, and the climate remained quite unstable until after 1830. In Jiangnan, the climate changed from dry to wet in 1820–1821 and was erratic during the years 1823–1834. Thus, it was concluded that the economic decline in Songjiang was part of the ‘Daoguang depression’ and its direct cause was
64
Cf. Zhang, Yuxiao 张雨潇, and Zhang Lüezhao 张略钊, “Qihou bianqian zai Songdai jingji zhongxin nanyi zhong de yingxiang 气候变迁在宋代经济重心南移中的影响 [The Impact of Climate Change on the Southward Movement of Economic Center in Song Dynasty],” Henan shehui kexue 河南社会科學 [Henan Social Sciences] 18.3 (2010): 117–19.
65
Cf. Chen, Jiaqi 陈家其, “Ming Qing shiqi qihou bianhua dui Taihu liuyu nongye jingji de yingxiang 明清时期气候变化对太湖流域农业经济的影响 [The Impact of Climate Change on Agriculture in the Lake Tai Area in the Ming and Qing Period],” Zhongguo nongshi 中国农史 [Agricultural History in China] 3 (1991): 30–35.
66
Cf. Fagan, Brian, The Little Ice Age: How Climate Made History, 1300–1850 (New York: Basic Books, 2000), ch. 10.
24
the global climate change in the early 19th century. The concurrence of a drastic climatic change and economic depression could not be just accidental.67
The relationship between climate change and grain prices was another topic of study. A comprehensive investigation on the relationships of climate changes, natural disasters, grain productions, and grain prices in the Qing period revealed that cold temperature usually affected grain production in spring when the first crop of rice was being planted and the winter wheat was waiting to ripen; as well as in the autumn when the second crop of rice was blooming. In addition, crops were damaged by frost during seasonal transition. The influence of rainfall was seen in the changing cropping boundary, with seasonal and regional differences observed. Droughts were apt to occur in North China in spring; in the middle and lower reaches of Yangzi River in summer; and in South China and parts of North China in autumn. Spring floods and spring-summer floods occurred mainly in South China and in the middle and lower reaches of Yangzi River; summer floods in the plain area of Yellow and Huai Rivers, in the middle and lower reaches of Yangzi River, at the Southeast coast, in the Sichuan basin, and in Northeast China; and autumn floods and summer-autumn floods in Southwest China and central and southern Shaanxi province. The frequency of floods and droughts in every decade in East China indicated more natural disasters and fewer normal years during cold periods, and vice versa during warm periods. A comparison of East China and North China showed that the incidence of natural disasters was related to changes between cold and warm climate. Moreover, examining grain prices in the Yangzi River delta during cycles of cold and warm periods in East China revealed an interesting phenomenon: grain prices dropped during the cold period of the 17th and 19th centuries but increased moderately during the warm period of the 18th century. Thus, grain prices in the long run were affected not only by the climate but also by other factors. In the later half of the 17th century, population decreased after the turbulent dynastic transition and thus the supply of grain was relatively abundant. At the same time, the Qing government banned maritime trade, which lead to a decline in the import of silver. The subsequent deflation affected the possible decline of grain prices. Although the warm period in the 18th and early 19th centuries was favourable for grain cultivation, the increase in grain products could not meet the soaring demand that accompanied the population rise. In addition, inflation was prevalent due to unprecedented commercial development, which also speeded up the circulation of currency. Consequently, grain
67
Cf. Li, Bozhong 李伯重, “‘Daoguang xiaotiao’ yu ‘guiwei dashui’—jingji shuaitui, qihou jubian ji 19 shiji de weiji zai Songjiang “道光萧条”与“癸未大水”——经济衰退、气候剧变及 19 世纪的危 机在松江 [The Daoguang Depression and the 1823 Flood—Economic Decline, Climatic Cataclysm and the Nineteenth-Century Crisis in Songjiang],” Shehui kexue 社会科学 [Journal of Social Sciences] 6 (2007):173–178.