行政院國家科學委員會專題研究計畫 成果報告
以基因微陣列分析肝細胞再生時,特種基因及基因族群之基
因表現在程度、型態、時程的變遷並鑑別其扮演之角色(2/2)
計畫類別: 個別型計畫 計畫編號: NSC93-2314-B-002-056- 執行期間: 93 年 08 月 01 日至 94 年 07 月 31 日 執行單位: 國立臺灣大學醫學院外科 計畫主持人: 賴鴻緒 共同主持人: 陳炯年,李伯皇 計畫參與人員: 吳秀鵑 報告類型: 完整報告 處理方式: 本計畫可公開查詢中 華 民 國 94 年 8 月 1 日
行政院國家科學委員會專題研究計畫成果報告
以基因微陣列分析肝細胞再生時,特種基因及基因族群之基因表現在程
度、型態、時程的變遷,並鑑別其扮演之角色 (2/2)
ANALYZING THE REGULATING GENES OF LIVER
REGENERATION IN CHANGING DEGREE, PATTERN, TIMING
AND VERIFYING THE ROLES OF SPECIFIC AND CLUSTER GENES
BY cDNA MICROARRY (2/2)
計畫編號:NSC 93-2314-B-002-056
執行期限:93 年 8 月 1 日至 94 年 7 月 31 日
主持人:賴鴻緒 台大醫學院 外科
中文摘要 有關肝細胞在肝損傷後可以再生,雖 已是公認的事實,許多研究也證實多種營 養素、賀爾蒙、生長因子、藥劑等,可直 接或間接影響肝細胞再生,但肝細胞再生 基因控制之詳細機轉,則仍不明瞭。 本計畫第一年以大鼠切除 70%肝臟 模式研究發現:(1)剩餘肝臟重量比值,於 切肝術後72 小時即恢復 90%以上;(2)有絲 分裂於術後 48 小時大量出現,術後 72 小 時逐漸減少;(3)所有基因表現變遷之型態 及時程共分為72 種,包括第 2、、6、12、 24、72 小時及、7 天單一尖峰型、雙尖峰、 遞增型、遞減型、突出型、凹陷型和混和 型等,每種型態包括40 至 218 種基因;(4) 包括免疫、賀爾蒙、生長因子、酵素及血 管新生因子等基因族群,均有明顯的變遷;(5) fas-associating protein with death
domain, carnitine palmitoyltransferase 1, fas death domain-associating protein, 及 steroid O-acyltransferase 1 等早期變化基因可能與
肝再生之啟動有關;(6) transforming growth
factor beta 2 及 beta receptor 等中期變化基 因可能與肝再生之分化有關;(7) TGF-β
regulated gene 3 及 small inducible cytokine A2 等晚期變化基因可能與肝再生之終止 有關。進一步以切除較少(40%)肝臟比較其 程度差異,以及比對各種基因之重要性, 則於第二年進行。 本 計 劃 第 二 年 仍 以 重 約 200 克 之 Wistar 雄性大鼠做實驗,測定肝細胞再生 過程中,超過 20000 種基因種別之基因表 現,並分析及比較上一年 70%切肝後,其 變遷程度、型態、時程及各基因族群之相 關性。所有大鼠均接受約百分之四十之肝 臟部分切除手術,各於術前及術後2、4、6、 12、24、72 小時及 5、7、10 天後犧牲取樣, 仍測定:(1)剩餘肝臟之重量比值;(2)剩餘 肝臟之有絲分裂指標;(3)以基因微陣列高 密 度 晶 片 、 肝 細 胞 mRNA 標 號 、 hybridization 及 影 像 分 析 等 方 法 , 測 定 20,500 種基因表現之變遷程度、型態及時 程;(4)將基因表現變化大者,依特性分為 免疫、賀爾蒙、生長因素、酵素、及血管 新生因子等基因族群,並比較其程度、型 態及時程與 70%切肝時,變化之差異性。 結果發現:(1)剩餘肝臟重量比值,切肝 40 %後恢復速度較慢,但至術後72 小時,40 %與70%兩組幾乎到達同樣重量;(2)有絲
分裂切肝40%後 48 小時也出現,至 72 小 時逐漸減少,但程度上比 70%切肝後明顯 較少;(3)基因表現變遷之種類與型態,與 70%切肝組類似,亦為 72 種型態,部分基 因變化程度雖較低,但變化型態相近;(4) 包括免疫、賀爾蒙、生長因子、酵素及血 管新生因子等基因族群,均有明顯的變 遷;(5)免疫相關基因(如 IL-6 和 IL-10)及血 管 新 生 相 關 基 因( 如 Angiotensiongen,
VEGF, 及 VEGF receptor 2)之變化 40%與 70%切肝後相近於重量比值變化,可能在 肝細胞再生之調控,扮演較重要的角色。 關鍵字:肝細胞再生、部分肝臟切除術、 proto-oncogene、基因微陣列、基因表現型 態、基因族群 ABSTRACT
Although there are much controversy on the initiation, regulation, metabolic changes, and termination of liver regeneration after partial hepatectomy that well initiate proliferation of the remaining hepatocytes, several factors, such as hormones, growth factors, nutritional components, and pharmacological agents, have been demonstrated to directly or indirectly affect liver regeneration. However, the regenerative mechanism and genetic control of liver after major tissue loss is still not clear.
We used 70% portal hepatectomized rat model for studying genes variation after partial hepatectomy, and found that: (1) the remnant liver weight increased to 90% in 72h after partial hepatectomy; (2) the mitosis of hepatocytes increased marked at 48h then decreased at 72h after partial hepatectomy; (3) analyzing the gene expression of microarray chips, the variation could be classified into 72 different patterns in cluding the patterns with a single peak at 2, 4, 6, 12, 24, 72h and 5, 7d after partial hepatectomy; (4) gene clusters of immune, hormone, growth factor, enzyme and angiogenesis have changed markedly; (5) early stage changed genes including fas-associating protein with death
domain, carnitine palmitoyltransferase 1, fas death domain-associating protein, and steroid O-acyltransferase 1 could be related to the initiation of liver regeneration; (6) intermediate stage changed genes including transforming growth factor beta 2 and beta receptor could be related to the differentiation of liver regeneration; (7) late stage changed genes including TGF-β regulated gene 3 and small inducible cytokine A2 could be related to the termination of liver regeneration. Study with 40% partial hepatectomy was performed in the second year.
Male Wistar rats around 200g will be used as subject. Partial hepatectomy around 40% were performed. They were sacrificed before and 2, 4, 6, 12, 24, 72 hours and 5, 7, 10 days after hepatectomy. We have measured: (1)weight of remnant liver; (2)mitotic index; (3)genomic survey of the gene expression by microarray chip of 20,500 identified cDNA clones, labeling of liver mRNA hybridization and image analysis; and (4)Grouping of genes expression into immune, nutrition, hormone, growth factor, enzyme, oncologic and embryonic subgroups, and compare the expression degree, changing pattern and specific timing.
The results were: (1) the remnant liver weight recovered slower, but can reach 90% in 72h after partial hepatectomy; (2) the mitosis of hepatocytes also increased markedly at 48h although not so high as 70% group rats, and also decreased at 72h after partial hepatectomy; (3) analyzing the gene expression of microarray chips, the variation of 40% group rats could also be classified into 72 patterns just like 70% group, with some variation degree were not so marked as 70% group rats; (4) gene clusters of immune, hormone, growth factor, enzyme and angiogenesis have changed markedly; (5) The changes of gene expression in immune related genes (such as IL-6 and IL-10 control genes) and angiogenesis related genes (such as Angiotensiongen, VEGF, and
VEGF-receptor 2) were more similar to the remnant liver weight variations. It may indicate that these genes play more important roles in the control mechanism of liver regeneration.
Key words: liver regeneration, partial
hepatectomy, proto-oncogene, microarray, genetic changing pattern, gene cluster
INTRODUCTION
Hepatocytes have a quiescent and highly differentiated phenotype. They rarely divide in adult humans or animals while remaining
in the G0-phase of the cell cycle. However,
their capacity to replicate is not lost and is readily activated after liver resection or after injury induced by chemicals or drugs. Therefore, hepatocytes constitute a conditional renewal cell system that may proliferate in vivo under well-defined
conditions.1-3 It seems that liver ”knows”
when to start and when to stop growing, and
thereby accurately regulates its mass.4,5
Partial hepatectomy triggers hepatocyte proliferation whereas excessive liver mass is regulated by apoptosis. The process of initiation and the control of the final size of the regenerated liver have been the subject of
research for many years.6-9 Genetic
regulation should have played an important role during the liver regeneration, however, the knowledge on the genetic mechanism is still limited.
We used 70% portal hepatectomized rat model for studying genes variation after partial hepatectomy, and found that: (1) the remnant liver weight increased to 90% in 72h after partial hepatectomy; (2) the mitosis of hepatocytes increased marked at 48h then decreased at 72h after partial hepatectomy; (3) analyzing the gene expression of microarray chips, the variation could be classified into 72 different patterns in cluding the patterns with a single peak at 2, 4, 6, 12, 24, 72h and 5, 7d after partial hepatectomy; (4) gene clusters of immune, hormone, growth factor, enzyme and angiogenesis have changed markedly; (5) early stage changed genes
including fas-associating protein with death domain, carnitine palmitoyltransferase 1, fas death domain-associating protein, and steroid O-acyltransferase 1 could be related to the initiation of liver regeneration; (6) intermediate stage changed genes including transforming growth factor beta 2 and beta receptor could be related to the differentiation of liver regeneration; (7) late stage changed genes including TGF-β regulated gene 3 and small inducible cytokine A2 could be related to the termination of liver regeneration. Study with 40% partial hepatectomy was performed in the second year.
It is reported that proto-oncogene expression after partial hepatectomy is
specific, sequential, and highly regulated.10,11
Changes have been detected in the expression of c-fos, c-myc, p53 and the ras gene family (c-Ha-ras, c-Ki-ras, and
N-ras).12-14 In contrast, expression of c-src
and c-abl does not change after partial hepatectomy while c-mos transcripts cannot be detected in normal or regenerating
liver.15,16 Recently, p21 cyclin-dependent
kinase (CDK) inhibitor, Fas, interleukin (IL)-18, and several caspases which inceased apoptosis, and Bcl-2, heat shock proteins, glutathione-S-transferase genes which down regulated cell proliferation were noted to be
involved in liver regeneration.17 D6.1A gene
was proved relate to stimulation of cell
proliferation and differentiation.18 Fox MIB
transcription factor was proved contribute to the decline in liver regeneration in the aging
process.19 Insulin like growth factor binding
protein 1 (IGFBP-1), HURP mRNA were also noted involve in the process of liver
regeneration.20,21 The mass survey about the
variation of all the regulating proto-oncogenes expression according time sequence, which is not reported yet, should be very important for investigating the genetic mechanism of liver regeneration.
This study was conducted to compare the variation patterns of 20,500 regulating genes expressions by cDNA microarray chip
during liver regeneration after 40% vs 70% partial hepatectomy in rats.
MATERIALS AND METHODS Experimental Protocol
Sixty male Wistar rats (purchased from Charles River, Osaka, Japan) weighing approximately 200g were used as subjects. All of them received 40% partial hepatectomy and they were sacrificed before and 2, 4, 6, 8, 12, 24, 48, 72 hours and 5, 7 days after hepatectomy. Six were sacrificed each time and the remnant livers were removed immediately for further tests.
Surgical Procedures
All rats are anesthetized by intraperitoneal pentobarbital (10mg/kg) injection. A midline laparotomy was performed. Partial hepatectomy was then carried out by means of aseptic extirpation of the left lateral lobes (around 40%) according
to the procedure of Higgins and Anderson.9
The removed liver sample was immediately weighed. Laparotomies with manipulation of liver were done in the sham operated rats. All of the surgeries were performed between 8 am and 11 am to reduce the influence of diurnal variation.
Measurements
(1)Evaluation of the remnant liver
Observation of the liver surface and color. Then weighing the liver immediately after sacrifice, and the ratio of remnant liver weight/body weight will be calculated.
(2)Mitotic index of remnant liver
The small pieces of liver tissue for hisopathological examination at certain postoperative period will be fixed in 10% neutral formalin, embedded in paraffin, sectioned and stained with hematoxylin-eosin for microscpic observation. The mitotic index will be determined by counting the number of parenchymal cells undergoing
mitosis in 50 randomly-selected fields under magnification ×400. The results will be expressed as the mitotic index (the total number of mitoses per 50 different fields examined).
(3)Genomic survey of remnant liver by cDNA microarray chips.
a. Non-isotopic labeling of liver mRNA Total RNA was extracted from remnant livers of sacrificed rats in each postoperative time sequence. The tissue was homogenized in 3 ml of solution A containing 4M guanidine thiocyanate, 0.5% sarcosyl, 25 mM sodium citrate, and 0.1M betamercaptoethanol at pH 7.0, followed by phenol extraction, isopropanol precipitation, and ethanol precipitation. Quality of RNA was examined by agarose gel electrophoresis. Messenger RNA was purified using Qiagen Oligotex extraction Kit.
Five micrograms of mRNA was annealed with 6 uM random hexamer in a total volume of 50 ul. The cDNA synthesis was performed in a 100 ul mixture containing 0.5 mM each dATP, dCTP, dGTP: 40 uM dTTP, 40 uM biotin-16-dUTP (Boehringer Mannheim), 10 mM DTT; 0.5 units/ul Human Placental Ribonuclease Inhibitor (HT Biotechnology Ltd., UK), and 200 units of Superscript RT II (GIBCO-BRL, Gaithersburg, MD). The mixture was incubated for 90 min at 42ºC and terminated by heating at 90ºC for 5 min. The RNA was degraded by addition of 5.5 ul of 3N NaOH and incubated at 50ºC for 30min. The mixture was neutralized by addition of 5.5 ul of 3M acetic acid and precipitated by addition of 50 ul of 7.5M ammonium acetate, 20 ug of linear polyacrylamide, and 1125 ul ethanol. The pellet was suspended in 36 ul deionized water.
b. Hybridization and image analysis of microarray
The chip containing 20,500 spots cDNA was pre-hybridized in 5 ml 1×hybridization
buffer containing 5×SSC, 0.1% SDS, 1% BM blocking buffer (Boehringer Mannheim), and 10 ug/ml denatured salmon sperm DNA, at 60ºC for 1 h. The probe was mixed with 2 ul of 10 ug/ul poly d(A) 10 and 2 ul of 10 ug/ul human Cot-1 DNA (Gibco BRL) and 40 ul of 2×hybridization buffer to a final volume of 80 ul, followed by denaturation of the probe mixture at 95ºC for 5 min and then cooling on ice. The membrane was annealed with the probe mixture in a hybridization chamber, incubated at 95ºC for 5 min, and then at 58ºC for 12-16h. The membrane was washed twice with 5 ml of 2×SSC, 0.1%SDS for 5 min at room temperature, followed by three washes for 15 min each with 5 ml of 0.1×SSC, 0.1% SDS at 58ºC. The membrane was blocked with 5 ml of 1% BM blocking reagent containing 2% dextran sulfate at room temperature for 1 h, followed by incubation with 5 ml mixture containing 700×diluted Streptavidin-β-galactosidase (1.38 U/ml, enzyme activity) (Gibco BRL), 4% polyethylene glycol 8000 (Sigma), and 0.3% BSA in TBS buffer (10 mM Tris, pH 7.4, 150 mM NaCl) at room temperature for 1 hour. The membrane was then washed with TBS buffer three times for 5 min each. The membrane was then treated with 5 ml X-gal substrate containing 1.2 mM X-gal, 1 mM
MgCl2, 3 mM K3Fe(CN)6, 3 mM K4Fe(CN)6
in TBS buffer for 45 min at 37ºC with gentle shaking, followed by mini-Q water wash and air dry. Color image was generated using UMAX PowerLook 3000 flatbed scanner at a resolution 3048 dpi and processed by ScanAlyze.
Data analysis
The images captured by a scanner could be digitized by a commercial analysis software such as GenePix 3.0 (Axon instruments) or the program written in-house. The pre-treated data will be then clustered by hierarchical method or self-organizing maps. These softwares are free and available from Stanford University and Massachusetts Institute of Technology once got the license permission for non-profit use.
RESULTS
The rats were living well during experimental stage. After sacrifice, the remnant liver weight increased to 90% in 72h after partial hepatectomy. However, the growing speed is not so fast as 70% group rats when 40% partial hepatectomy was done (Fig. 1). The mitosis index showed that the mitosis of hepatocytes in the remnant liver increased to 64±8.8 at 48h, then decreased to 20±4.6 at 72h after 40% partial hepatectomy. The elevation was also not as high as that in 70% group rats (Table 1).
When the microarray chip was analyzed by a flatted scanner and the GenePix in each time sequence, the variations of all the 20,500 proto-oncogenes expression could be classified into 72 different patterns as previous report. The various patterns of the genes expressions include the pattern containing a single peak which occurred at 2h, 4h, 6h, 12h, 48h, 72h, 5d, and 7d. In addition, typical double-peaks patterns occurred at different time sequence such as 12h, and 5d after partial hepatectomy. Moreover, patterns showing increasing trend since 4h or patterns illustrating a decreasing trend since 4h were also noticed in some proto-oncogenes expressions. Beyond that, the protruding types of patterns from 12h to 24h and from 6h to 72h, or the excavated types of patterns from 4h to 5d and 6h to 5d were found. Mixed types of time-dependent curves were detected as other unclassified variation patterns of genes expressions. The changing patterns are about the same when compared 40% vs 70% groups rats, however, the changing degrees was not so high in 40% partial hepatectomized rats. The name, NCBI number and features of the chosen representative genes which were contained in the 5 categories (including immune related, hormone related, growth factor related, enzyme related, and angiogenesis related) of genes expressions were listed in Table 2. Each category of gene expression pattern contained 8 to 13 identified proto-oncogenes.
changing degrees in 40% group rats were not so marked but more stable when compared with 70% group rats (Fig. 2). Histocompatibility locus class II region was highly elevated at 3d after 40% partial hepatectomy that was high at 6h and 7d, but not 3d after 70% partial hepatectomy. That means this gene might be not directed related to the control mechanism of liver regeneration. As for IL-6 and IL-10 genes, the time sequence changes and changing patters are similar in 40% vs 70% groups rats, with a milder degree in 40% group rats.
Hormone related genes showed an almost flat changing curve in 40% group rats (Fig. 3). Although the changes of these genes were markedly variable in 70% group rats, they may not be considered as contral genes because that the patter was not similar between 40% and 70% group rats.
Growth factor related genes as shown at Fig. 4. Although growth factor independent 1, fibroblast growth factor and transforming growth factor had specific changes respectively after 70%, there were no change after 40% partial hepatectomy.
Enzyme related genes had wider ranging flat changing curves after 40% portial hepatectomy (Fig. 5). Ubiquitin elevated a little, and glutathione peroxidase dedreased a little during liver regeneration period. However, the elevated peaks which appeared at 70% group rats had never seen in 40% group rats.
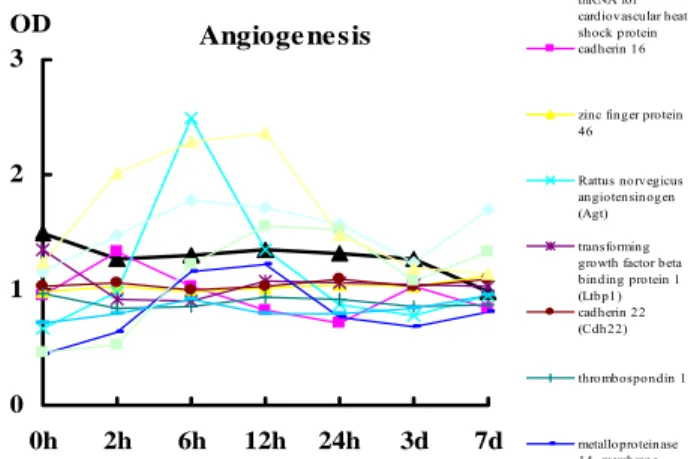
Angiogenesis related genes had changing curves with single peak elevated occurred on angiotension gene both after 40% and 70% partial hepatectomy (Fig. 6). VEGF and VEGF receptor 2 genes also had similar elevated peak after 40% and 70% partial hepatectomy. Zinc finger protein gene demonstrated a wide based elevation after 40% but not 70% partial hepatectomy.
DISCUSSION
For the gene expressions during liver
regeneration, several proto-oncogenes with some chemical agents involved in mechanism during liver regeneration were
reported[22-24]. Arora et al reported that c-Myc
antisense limits rat liver regeneration by
regulating cytochrome p-450 3A activity[22].
Ozeki and Tsukamoto found that retinoic acid can repress c-fos and c-jun expression
and induce apoptosis in regenerating liver[25].
Some proto-oncogenes about angiogenesis reaction such as insulin-like growth factor
Ⅱ[26], and TNP-470 angiogenesis inhibitor[27]
were also detected to be involved in the regulation during the process of liver regeneration. Liver regeneration might be regulate by expression of angiogenesis related proto-oncogenes concerned about
VEGF changes[9]. However, mass survey and
more detailed analysis about immune related genes by microarry method, that will be very important, are still not reported.
In our preliminary study of gene expression during liver regeneration, we monitored the variation of regulating genes by selected liver-related genes cDNA microarry nylon membrane. The results showed that there were fifty-nine regulating proto-oncogenes expression increased markedly and nineteen regulating proto-oncogenes expression decreased significantly during liver regeneration after partial hepatectomy in rats. However, the roles of these regulating genes can’t be verified because the changing pattern and timing were varied a lot. We repeated the study by cDNA microarry membrane carrying 6144 proto-oncogenes identified and PCR-amplified by cDNA clones, the results showed many more genes had changed significantly during liver regeneration. The changing patterns could be categorized in seventy-two patterns.
There were twenty-two immune related genes were detected with different variations during the time sequence after partial hepatectomy. Among these 22 genes, ten of them had marked changes in six different kinds of patterns in changing curve with
quantitative hybridized proto-oncogenes expression with different degree and timing. We have selected γIFN receptor 2 (γIFN-R2) for trying verification by RT-PCR and Western Blot, and the results were shown in Fig. 6,7,8 and 9. The preliminary data showed that γIFN-R2 transcripted mRNA was strongly enhanced when compared with the index by accounting the relative quantitation of γIFN-R2 against GAPDH expression as a controlled base. The melting peak of γIFN-R2 was also showed a unique peak which demonstrated a definite amplification product of the detected cDNA, and can be a good indicator for further PT-PCR analysis according time sequence and Western Blot analysis.
As for angiogenesis vs liver regeneration, we have proved that there were thirty-two angiogenesis related genes detected with different variations during the time sequence after partial hepatectomy. Among these 32 genes, eleven of them had marked changes and could be classified into six different kinds of patterns in changing curve with quantitative hybridized proto-oncogenes expression with different degree and timing. We also detected some enhanced expressed angiogenesis related genes, such as insulin-like growth factor (ILGF) binding protein 1, fibroblast growth factor (FGF) binding protein, metalloproteinase 2, ephrin A,
laminin-beta, transforming growth
factor (TGF)β-2, transforming growth factor (TGF)β-2 receptor, TGF regulated gene, Leukotriene C4 synthase, placenta
growth factor, ○11TGFB inducible protein,
○12 VEGF. To acknowledge whether the
changes of these angiogenesis related genes are truly effective, further verification by real time PCR (RT-PCR) for RNA expression, and Western Blot for protein products variation is necessary to find out the compatible reactions of these angiogenesis related genes which really involved in the mechanism of liver regeneration.
REFERENCES
1. George K, Marie C. Liver regeneration. Science 1997;276:60-6.
2. Kountouras J, Boura P, Lygidakis NJ. Liver regeneration after hepatectomy. Hepato-Gastroenterology
2001;48:556-62.
3. Sato Y, Koyama S, Tsukada K, Hatakeyama K. Acute portal hypertension reflecting shear stress as a trigger of liver regeneration following partial hepatectomy. Surg Today 1997;27:518-26.
4. Drixler TA, Vogten MJ, Ritchie ED, van Vroonhoven TJ, Gebbink MF, Voest EE, et al. Liver regeneration is an angiogenesis-associated phenomenon. Ann Surg 2002;236:703-11.
5. Gaglio PJ, Liu H, Dash S. Liver regeneration investigated in a non-human primate model (Macaca mulatta). J Hepatol 2002;37: 625-32.
6. Higgins GM, Anderson RM.
Experimental pathology of the liver; I. Restoration of the liver by the white rat following partial surgical removal. Arch Pathol 1931;12:186-202.
7. Lai HS, Chen Y, Chen WJ. Carnitine contents in remnant liver, kidney and skeletal muscle after partial hepatectomy in rats: randomized trial. World J Surg 1998;22:42-7.
8. Court FG, Wemyss-Holden SA, Dennison AR, Maddern GJ. The mystery of liver regeneration. Br J Surg 2002;89:1089-95.
9. Mitsue S, Hamanoue M, Tanabe G, Ogura Y, Yoshidome S, Aikou T, et al. Expression of HGF and TGF-beta 1 mRNA after partial hepatectomy in rats with liver cirrhosis. Surg Today 1995;25:237-43.
10. Fausto N, Shank PR. Oncogene expression in liver regeneration and hepatocarcinogenesis. Hepatology 1983;3:1016-23.
11. Fausto N, Mead JE, Braun L, Thompson NL, Panzica M, Goyette M, et al. Proto-oncogene expression and growth factors during liver regeneration. Symp Fundam Cancer Res 1986;39:69-86. 12. Thompson NL, Mead JE, Braun L,
Goyette M, Shank PR, Fausto N. Sequential protooncogene expression during rat liver regeneration. Cancer Res 1986;46:3111-7
13. Corral M, Paris B, Guguen-Guillouzo C, Corcos D, Kruh J, Defer N. Increased expression of the N-myc gene during normal and neoplastic rat liver growth. Exp Cell Res 1988;174:107-15.
14. Fausto N. Hepatic regeneration. In: Zakim D, Boyer TD eds. Hepatology. Pholadelphia, W.B. Saunders Co. 1990:Pp 49-65
15. Fausto N, Shank PR. Analysis of proto-oncogene expression during liver regeneration and hepatic carcinogenesis. In: Okuda K, Ishak KG, eds. Neoplasms of the liver. New York, Springer-Verlag, 1987:Pp57-61.
16. Goyette M, Petropoulos CJ, Shank PR, Fausto N. Regulated transcription of c-Ki-ras and c-myc during compensatory growth of rat liver. Mol Cell Biol 1984;4:1493-8.
17. Morita T, Togo S, Kubota T,
Kamimukai N, Nishizuka I, Kobayashi T, et al. Mechanism of postoperative liver failure after excessive hepatectomy investigated using a cDNA microarray. Hepat Biliar Pancr Surg 2002;9:352-9. 18. Tanaka F, Hori N, Sato K. Identification
of differentially expressed genes in rat hepatoma cell lines using subtraction
and microarray. J Biochem 2002;131:39-44.
19. Wang X, Quail E, Hung NJ, Tan Y, Ye H, Costa RH. Increased levels of forkhead box M1B transcription factor in transgenic mouse hepatocytes prevent age-related proliferation defects in regenerating liver. Proceed Nat Aca Sci USA 2001;98:11468-73.
20. Leu JI, Crissey MA, Craig LE, Taub R. Impaired hepatocyte DNA synthetic response posthepatectomy in insulin-like growth factor binding protein 1-deficient mice with defects in C/EBP beta and
mitogen-activated protein kinase/extracellular signal-regulated
kinase regulation. Mol Cell Bio 2003;23:1251-59.
21. Tsou AP, Yang CW, Huang CY, Yu RC, Lee YC, Chang CW, et al. Identification of a novel cell cycle regulated gene, HURP, overexpressed in human hepatocellular carcinoma. Oncogene 2003;22:298-307.
22. Arora V, Knapp DC, Smith BL, et al: c-Myc antisense limits rat liver regeneration and indicates role for c-Myc in regulating cytochrome P-450 3A activity. J Pharmacol Exp Therap 292:921-8, 2000.
23. Iwao K, Tsukamoto I: Quercetin inhibited DNA synthesis and induced apoptosis associated with increase in c-fos mRNA level and the upregulation of p21WAF1CIP1 mRNA and protein expression during liver regeneration after partial hepatectomy. Biochem Biophy Acta 1427:112-20, 1999.
24. Lee SM, Li ML, Tse YC, et al: Paeoniae Radix, a Chinese herbal extrac, inhibit hepatoma cells growth by inducing apoptosis in a p53 independent pathway. Life Science 71:2267-77, 2002.
repressed the expression of c-fos and c-jun and induced apoptosis in regenerating rat liver after partial hepatectomy. Biochem Biophy Acta 1450:308-19, 1999.
26. Bae MH, Lee MJ, Bae SK, et al: Insulin-like growth factor II (IGF-II) secreted from HepG2 human hepatocellular carcinoma cells shows
angiogenic activity. Cancer Letters 128:41-6, 1998.
27. Tanaka H, Taniguchi H, Mugitani T, et al: Angiogenesis inhibitor TNP-470 prevents implanted liver metastases after partial hepatectomy in an experimental model without impairing wound healing. Br J Surg 83:1444-7, 1996.
Genes\Time 40%2h / 70%2h 40%4h / 70%4h 40%6h / 70%6h 40%12h / 70%12h 40%24h / 70%24h 40%3d / 70%3d 40%7d / 70%7d
Immune related
histocompatibility locus class II region 1.177 /0.875 0.893 /0.910 1.262 /0.921 1.194 /0.910 1.260 /1.122 1.677 /1.447 1.398 /1.279 early B-cell factor 0.954 /1.109 1.043 /1.058 0.772 /0.801 1.033 /1.028 0.964 /0.883 1.172 /0.994 1.032 /0.927 B-cell receptor-associated protein 29 1.438 /1.506 1.033 /1.377 1.244 /1.283 1.339 /1.626 1.186 /1.838 1.134 /1.146 1.118 /1.064 macrophage migration inhibitory factor 0.991 /0.996 1.067 /1.015 1.341 /1.103 1.020 /1.144 1.311 /1.508 1.316 /1.111 1.125 /1.137 histocompatibility antigen H13 isoform 1 0.808 /0.871 1.000 /0.974 1.117 /1.084 1.040 /1.034 1.081 /0.875 1.067 /1.064 1.109 /1.070 immunoglobulin J chain homologPartial 1.085 /0.909 1.042 /1.224 1.484 /0.955 0.937 /1.011 1.131 /0.837 1.232 /1.053 1.090 /0.911 histocompatibility class II antigen-associated 0.956 /0.980 0.961 /1.018 0.886 /0.834 0.979 /0.800 1.017 /0.789 1.198 /1.059 0.982 /1.054 histocompatibility locus class II,O region 1.177 /0.875 0.893 /0.910 1.262 /0.921 1.194 /0.910 1.260 /1.122 1.677 /1.447 1.398 /1.279 mast cell growth factor 1.318 /1.301 1.231 /1.278 1.026 /1.158 1.055 /1.098 1.025 /1.681 1.146 /1.073 0.976 /1.081 interferon gamma receptor 0.780 /0.923 0.929 /1.062 1.362 /1.174 0.885 /1.171 0.950 /0.906 1.050 /1.241 1.246 /1.278 Hormone related
huntingtin-associated protein interacting protein 1.138 /1.101 1.341 /1.136 1.153 /0.927 1.183 /1.086 1.097 /0.743 1.199 /1.211 1.293 /0.918 Somatostatin 0.614 /0.586 0.840 /0.769 1.133 /1.250 1.144 /1.036 1.105 /0.966 1.080 /1.181 1.115 /1.211 Cholecystokinin B receptor (Cckbr), mRNA. 0.958 /0.896 1.059 /0.930 0.933 /1.017 0.983 /0.907 0.976 /0.772 0.930 /0.927 1.003 /0.984 Prepronociceptin (neuropeptide nociceptin) (N23K) (Pnoc) 1.046 /1.148 1.095 /1.108 1.089 /1.125 1.019 /1.069 1.055 /0.949 1.013 /1.095 1.000 /1.024 Proteolipid protein(Plp1), mRNA. 1.076 /0.875 1.042 /1.033 0.876 /0.767 0.761 /0.794 0.645 /0.630 0.789 /0.765 0.928 /0.882 GATA-binding protein 1 (globin transcription factor 1) 0.895 /0.857 0.865 /0.948 1.144 /1.064 0.881 /0.851 1.062 /0.891 0.933 /0.900 1.051 /1.040 growth hormone releasing hormone (Ghrh), mRNA. 1.076 /1.062 1.069 /0.992 0.980 /0.954 0.878 /0.848 0.984 /0.685 0.977 /0.993 1.016 /1.036 Secretogranin II (Scg2), mRNA. 0.876 /1.017 0.912 /1.226 1.118 /1.622 1.059 /0.844 1.083 /1.296 1.587 /0.824 0.922 /1.286 Growth factor related
Growth factor independent-1 (Gfi1), mRNA. 0.861 /0.895 1.056 /0.968 1.008 /0.838 1.103 /0.960 1.116 /1.016 1.124 /0.999 1.024 /1.002 epidermal growth factor receptor related protein (Errp) 1.012 /1.018 1.351 /0.985 0.948 /1.019 1.066 /1.063 1.236 /1.214 0.859 /1.041 0.963 /0.860 Insulin-like growth factor II (Igf2), mRNA. 1.013 /0.993 0.986 /0.961 0.988 /0.890 1.087 /1.038 1.091 /0.780 0.998 /1.053 1.101 /1.140 fibroblast growth factor 1 (Fgf1), mRNA. 0.712 /0.843 0.794 /0.771 0.921 /0.826 0.788 /0.759 0.802 /0.566 0.848 /0.740 0.956 /1.013 fibroblast growth factor 12 (Fgf12), mRNA. 0.898 /0.866 1.026 /0.913 0.803 /0.836 0.774 /0.757 0.935 /0.665 0.872 /0.807 0.883 /0.946 fibroblast growth factor receptor 3 (Fgfr3), mRNA. 1.101 /1.100 1.109 /1.165 1.179 /1.246 1.088 /1.066 1.076 /1.060 1.111 /1.050 1.139 /1.145 fibroblast growth factor receptor 1 beta-isoform 1.359 /1.297 0.970 /1.248 1.041 /0.942 0.961 /1.034 0.953 /0.754 1.113 /1.387 1.146 /1.200 transforming growth factor, beta receptor 1 (Tgfbr1) 0.760 /1.059 0.961 /1.227 0.799 /0.894 1.046 /1.177 0.908 /1.079 0.964 /1.080 1.079 /0.914 Enzyme related
ubiquitin C-terminal hydrolase UCH37 (UCH37) mRNA 1.306 /1.184 1.430 /1.368 1.471 /1.449 1.376 /1.695 1.212 /2.140 1.200 /1.119 1.130 /1.131 glycolipid-anchored form of acetylcholinesterase(R) 0.901 /0.986 0.914 /0.917 1.244 /0.981 1.013 /0.943 1.065 /0.908 0.937 /0.799 1.111 /1.228 glutathione synthetase (Gss), mRNA. 0.739 /0.931 1.121 /1.131 1.475 /1.558 1.186 /2.264 0.682 /1.790 1.208 /1.188 1.120 /1.016 glutathione peroxidase (GSH-PO) mRNA 0.470 /0.589 0.477 /0.498 0.612 /0.725 0.504 /0.510 0.636 /0.600 0.964 /0.838 0.654 /0.734 carnitine palmitoyltransferase 1 (Cpt1a), mRNA. 0.447 /0.689 0.696 /0.469 0.800 /0.517 0.668 /0.449 0.688 /0.593 0.414 /0.355 0.698 /1.030 Protein kinase, cAMP dependent, regulatory, type 1 (Prkar1a) 1.132 /1.070 1.303 /1.307 1.131 /1.199 0.988 /1.607 1.085 /1.180 1.179 /1.117 1.093 /0.856 Deoxyribonuclease I (Dnase1), mRNA. 1.139 /1.065 1.112 /0.801 0.890 /0.868 0.781 /0.953 1.010 /0.811 1.054 /0.946 0.883 /0.918 membrane amine oxidase 0.850 /0.868 0.984 /1.062 0.970 /1.047 1.012 /0.983 1.137 /0.948 0.977 /1.025 0.984 /0.959 pyruvate dehydrogenase 2 (Pdk2), mRNA. 0.562 /0.789 0.656 /0.635 0.906 /0.803 0.737 /0.691 0.901 /0.645 1.066 /1.157 1.138 /1.333 cysteine proteinase inhibitor cystatin C. 0.827 /0.948 0.793 /0.896 0.988 /0.921 0.955 /0.904 0.912 /0.749 0.900 /1.012 1.077 /1.047 RNA polymerase II subuunit RPB14 1.125 /1.081 1.036 /0.940 1.069 /1.013 1.160 /1.043 0.892 /1.048 1.058 /1.123 1.040 /1.147 arginine-glutamic acid dipeptide (RE) repeats (Rere) 0.902 /0.916 0.722 /1.127 0.935 /1.170 1.001 /1.061 1.061 /1.366 1.068 /1.250 1.076 /0.905 dipeptidase 1 (Dpep1), mRNA. 1.175 /1.412 1.208 /0.960 0.934 /1.467 0.931 /1.214 0.984 /0.695 0.871 /0.815 0.992 /1.091 Angiogenesis
cardiovascular heat shock protein 1.497 /1.153 1.267 /1.385 1.303 /1.042 1.345 /1.110 1.320 /1.123 1.268 /1.093 0.989 /1.046 cadherin 16 0.946 /1.010 1.330 /1.284 1.039 /1.171 0.827 /1.025 0.716 /1.445 1.028 /1.325 0.848 /0.899 zinc finger protein 46 0.981 /0.927 1.027 /1.020 0.987 /1.138 1.013 /1.139 1.044 /0.964 1.028 /1.142 1.120 /0.880 Rattus norvegicus angiotensinogen (Agt), mRNA. 0.667 /1.597 0.991 /1.594 2.492 /3.618 1.348 /2.439 0.867 /1.226 0.779 /0.771 0.945 /1.219 transforming growth factor beta binding protein 1 (Ltbp1) 1.346 /1.431 0.917 /1.242 0.907 /0.958 1.073 /1.051 1.071 /0.787 1.043 /1.126 1.035 /1.001 cadherin 22 (Cdh22), mRNA. 1.028 /1.101 1.063 /1.045 0.994 /1.080 1.038 /0.953 1.096 /0.984 1.032 /1.024 1.089 /1.040 thrombospondin 1 0.974 /1.009 0.837 /0.953 0.850 /0.799 0.939 /0.878 0.924 /0.852 0.851 /0.919 0.880 /0.978 metalloproteinase 14, membrane-inserted (Mmp14), mRNA. 0.444 /0.656 0.641 /0.616 1.155 /1.284 1.229 /1.441 0.756 /0.813 0.689 /0.827 0.814 /0.509 fibroblast growth factor 1 (Fgf1), mRNA. 0.712 /0.843 0.794 /0.771 0.921 /0.826 0.788 /0.759 0.802 /0.566 0.848 /0.740 0.956 /1.013 integrin beta 2 alpha subunit mRNA 1.163 /0.958 1.478 /2.389 1.781 /1.310 1.721 /1.148 1.565 /1.464 1.232 /1.389 1.692 /1.425 calreticulin (Calr), mRNA. 0.461 /0.571 0.517 /0.544 1.214 /1.225 1.549 /1.401 1.527 /1.537 1.076 /1.369 1.331 /1.357
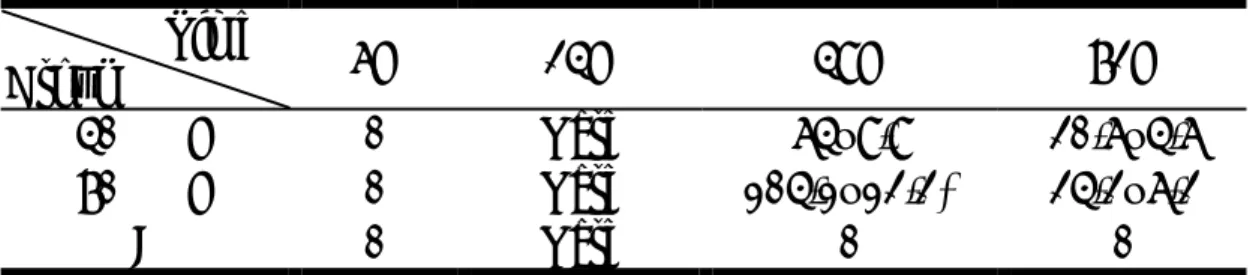
Table 2. Gene Expressions in Time Sequence after 40% vs 70% Partial Hepatectomy
Time
Group
6H 24H
48H
72H
40% PH
0
Rare
64±8.8
20.6±4.6
70% PH
0
Rare
104.1±12.2*
24.2±6.2
C 0
Rare 0
0
Mean±SD; Sum of 50 randomized field under 400x; C: control; H: hour;
PH: Partial hepatectomy; *: vs 40%PH, p<0.05
Fig 1. Remnant Liver Weight/Body Weight Ratio after 40% and 70% partial Hepatectomy. Immune 0 0.5 1 1.5 2 0h 2h 6h 12h 24h 3d 7d OD histocompatibility locus class II region early B-cell factor B-cell receptor-associated protein 29 macrophage migration inhibitory factor histocompatibility antigen H13 isoform 1 immunoglobulin J chain homologPartial histocompatibility class II antigen-associated histocompatibility locus class II,O region mast cell growth factor interferon gamma receptor
Fig 2. The names and their changing patterns of immune related genes.
Hormone 0 0.5 1 1.5 2 0h 2h 6h 12h 24h 3d 7d OD huntingtin-associated protein interacting protein Somatostatin Cholecystokinin B receptor (Cckbr) Prepronociceptin (neuropeptide nociceptin) Proteolipid protein(Plp1) GATA-binding protein 1 (globin transcription factor 1) (Gata1) growth hormone releasing hormone (Ghrh) Secretogranin II (Scg2)
Fig 3. The names and their changing patterns of hormone related genes.
Growth Factor 0 0.5 1 1.5 2 0h 2h 6h 12h 24h 3d 7d OD Growth factor independent-1 (Gfi1) epidermal growth factor receptor related protein (Errp) Insulin-like growth factor II (Igf2) fibroblast growth factor 1 (Fgf1) fibroblast growth factor 12 (Fgf12) fibroblast growth factor receptor 3 (Fgfr3) fibroblast growth factor receptor 1 beta-isoform transforming growth factor, beta receptor 1 (Tgfbr1)
Fig 4. The names and their changing patterns of growth factor related genes.
Enzyme 0 0.5 1 1.5 2 0h 2h 6h 12h 24h 3d 7d OD ubiquitin C-terminal hydrolase UCH37 (UCH37) glycolipid-anchored form of acetylcholinesterase( R) glutathione synthetase (Gss) glutathione peroxidase (GSH-PO) carnitine palmitoyltransferase 1 (Cpt1a) Protein kinase, cAMP dependent, regulatory, type 1 (Prkar1a) Deoxyribonuclease I (Dnase1) membrane amine oxidase
Fig 5. The names and their changing patterns of enzyme related genes.
Angioge ne sis 0 1 2 3 0h 2h 6h 12h 24h 3d 7d OD Rattus norvegicus mRNA for cardiovascular heat shock protein cadherin 16 zinc finger protein 46 Rattus norvegicus angiotensinogen (Agt) transforming growth factor beta binding protein 1 (Ltbp1) cadherin 22 (Cdh22) thrombospondin 1 metalloproteinase 14, membrane-inserted (Mmp14)
Fig 6. The names and their changing patterns of angiogenesis related genes
Normal Rat 4.31% 0 1 2 3 4 5 0 6 24 48 72 Hours % 70% 40%