Deposition of Ru and RuO
2thin films employing dicarbonyl
bis-diketonate ruthenium complexes as CVD source reagents
Ying-Hui Lai,
aYao-Lun Chen,
aYun Chi,*
aChao-Shiuan Liu,
aArthur J. Carty,*
bShie-Ming Peng
cand Gene-Hsiang Lee
ca
Department of Chemistry, National Tsing Hua University, Hsinchu 300 Taiwan, ROC. E-mail: [email protected]; Fax: (886) 3 572-0864
b
Steacie Institute for Molecular Sciences, National Research Council Canada, 100 Sussex Drive, Ottawa, Ontario, K1A 0R6, Canada. E-mail: [email protected]
c
Department of Chemistry, National Taiwan University, Taipei 106 Taiwan, ROC
Received 14th January 2003, Accepted 16th May 2003
First published as an Advance Article on the web 9th June 2003
Reaction of Ru3(CO)12with 6 eq. of b-diketone ligands (hfac)H, (tmhd)H, (acac)H and (tfac)H at 160–170uC
in a hydrocarbon solvent (pentane or hexane) affords the diketonate complexes [Ru(CO)2(hfac)2] (1),
[Ru(CO)2(tmhd)2] (2), [Ru(CO)2(acac)2] (3) and [Ru(CO)2(tfac)2] (4) in high yields. These ruthenium complexes
were characterized by spectroscopic methods; a single crystal X-ray diffraction study was carried out on one isomer of the tfac complex (4a), revealing an octahedral coordination geometry with two CO ligands located at cis-positions and with the CF3groups of the b-diketonate ligands trans to the CO ligands. Thermogravimetric
analysis of complex (1) showed an enhanced volatility compared to the parent acac complex (3), attributed to the CF3group reducing intermolecular attraction. Employing complexes (1) and (2) as CVD source reagents,
ruthenium thin films can be deposited at temperatures of 350uC–450 uC under an H2atmosphere or at
temperatures of 275uC–400 uC using a 2% mixture of O2in argon as carrier gas. For deposition carried out
using complex (1) and under 100% O2atmosphere, RuO2thin films with a preferred (200) orientation were
obtained. The as-deposited thin films were characterized by surface and physical analytical techniques, such as scanning electron microscopy (SEM), X-ray photoelectron spectroscopy (XPS), X-ray diffraction analysis (XRD) and four-point probe measurement.
Ruthenium-containing thin films show great promise for fabricating bottom electrodes or non-corrosive diffusion barriers for next generation, tantalum oxide (Ta2O5), barium
strontium titanate (BST) and lead zirconate titanate (PZT) based nonvolatile random access memory (RAM) devices.1The advantages of ruthenium over other conducting materials include: lower resistivity, good etching ability, good barrier properties against oxygen diffusion, high resistance against capacitor shorting due to the formation of hillocks, severe polarization fatigue and aging.2 Moreover, its oxide phase, RuO2, which crystallizes in the rutile structure, belongs to a
class of conductive oxide materials that exhibit excellent chemical stability at higher temperatures in O2ambient. These
combined characteristics make RuO2an idea candidate for the
fabrication of diffusion barriers for contact metallizations in very large scale integration (VLSI) applications, buffer layers of high Tcsuperconducting films on silicon, and electrodes of
ferroelectric thin films.
Chemical vapor deposition (CVD) has received more attention in recent years, particularly in depositing these ruthenium-containing thin films, for its obvious capability of alleviating problems associated with the physical vapor deposition or sputtering process, such as low conformal coverage, poor crystallinity, and high stress level. As a result, several Ru metal-containing complexes have been examined as potential CVD precursors, including (a) ruthenocene3and its alkyl substituted derivatives such as Ru(C5H4Et)2,4(b) metal
carbonyl complexes, such as Ru(CO)3(C6H8), 5
Ru(CO)4(hfb), 6
hfb ~ hexafluoro-2-butyne, and Ru3(CO)12,7 (c)
tris-b-diketonate coordination complexes, such as Ru(acac)3,
Ru(tfac)3 and Ru(tmhd)3, tfac ~
1,1,1-trifluoro-2,4-pentane-dionate and tmhd ~ 2,2,6,6-tetramethyl-3,5-heptane1,1,1-trifluoro-2,4-pentane-dionate,8 and (d) organo- metallic alkenyl and alkene complexes of
bis(2,4-dimethylpentadienyl)ruthenium,9and arene complexes
such as (g6-C6H6)Ru(g 4
-C6H8), C6H8~ 1,3-cyclohexadiene,
and Ru(C3H5)2(COD), COD ~ 1,4-cyclooctadiene.10
How-ever, only one of them, i.e. Ru(C5H4Et)2, was tested on the
pilot scale using six-inch silicon wafers as substrates.4aThe rest of the source reagents were not used in the large scale process due to their poor thermal stabilities, or the involvement of laborious synthetic manipulations.
Accordingly, there is a strong demand for better Ru CVD source reagents, which should possess advantages such as: suitability for scale-up synthetic operation, higher thermal and oxidative stability during storage, higher volatility upon heating, and the capability to induce facile metal deposition under designated CVD conditions. In this paper, we report our attempt targeted at the preparation of possible Ru CVD source reagents that would satisfy most of these stringent require-ments. Part of this investigation was published as a preliminary communication and a patent document.11
Experimental
General information and materials
All synthetic experiments were conducted using a 160 mL Parr Instrument, series 4772Q stainless steel autoclave, with a 4316 gauge block assembly and a thermocouple. Mass spectra were obtained on a JEOL SX-102A instrument operating in electron impact (EI) mode, and infrared spectra were recorded on a Perkin-Elmer 2000 FT-IR spectrometer. The1H,13C and
19
F NMR spectra were recorded on a Varian Mercury-400 instrument; chemical shifts are quoted with respect to internal standard tetramethylsilane for 1H and 13C NMR data and CFCl3 for 19F NMR data. The thermogravimetric analyses
(TGA) were recorded on a Seiko TG/DTA 300 instrument under N2at 1 atm, with a constant flow rate of 100 sccm (standard
cubic centimeter per minute) and a heating rate of 10uC min21
. All reactions were performed in air using anhydrous solvents or solvents treated with an appropriate drying reagent.
The Ru and RuO2thin film samples was analyzed using a
Mac Science, M18XCE X-ray diffractometer with Cu Ka
radiation (XRD). Scanning electron microscopy (SEM) was performed using a Hitachi S-4000 system. The electrical resistivity of films was measured by a four-point probe method at room temperature, for which the instrument is assembled using a Keithley 2182 nanovoltmeter and a Keithley 2400 constant current source. The elemental composition was determined by X-ray photoelectron spectroscopy (XPS) utilizing a Physical Electronics PHI 1600 system with an Al/ Mg dual anode X-ray source, and the XPS spectra were collected after 1–2 min sputtering with argon at 4 keV until a constant composition was obtained. In general, the C1speak
overlaps with the Ru 3d3/2peak at binding energy (BE) 284 eV
in the XPS survey scan and direct measurement of the carbon content is impossible. However, the Ru 3d5/2peak at BE 280 eV
does not overlap with any carbon signals, and the 3d5/2/3d3/2
peak intensity ratio of pure Ru metal should be nearly 3:2, which corresponds to the theoretical value due to spin–orbit interactions of d-electrons.12If carbon were indeed present in
the Ru film, the observed 3d5/2/3d3/2integration ratio would
show a deviation from the ideal value of 3:2. Thus, slow scans over these regions of interest were utilized as a gauge of the carbon content, followed by least-squares curve fitting and deconvolution. The spectral deconvolution procedures were carried out using a nonlinear least squares fitting program adopting mixed Gaussian–Lorentzian line shape and Shirley baselines.
Synthesis of complex (1). A sample of Ru3(CO)12 (0.5 g,
0.78 mmol), six equivalents of (hfac)H (0.7 mL, 4.9 mmol), and 50 mL of anhydrous pentane together with a stirring bar were added into a 160 mL stainless steel autoclave. The autoclave was sealed and then slowly heated under stirring to 160uC for 18 hours. After cooling the autoclave to room temperature, the pentane solution was transferred out of the reactor and filtered to remove any insoluble precipitates present in the reaction mixture. The filtrate was concentrated on a rotary evaporator very briefly, and the resulting solid residue was dissolved into a minimum amount of warm methanol. Cooling the methanol solution to 220 uC produced 1.27 g of the light orange Ru(CO)2(hfac)2(92%) with melting point 64–66uC.
Spectral data of (1): MS (FAB,102Ru), m/z 572. IR (C 6H12): n(CO), 2092 (s), 2036 (vs) cm21.1H NMR (CDCl3, 298 K): d6.34 (s, 2H, CH).13C NMR (CDCl3, 298 K): d 192.5 (2C, CO), 179.1 (2C, CO,2J CF~ 36 Hz), 176.9 (2C, CO,2JCF~ 36 Hz), 116.7 (2C, CF3, 1 JCF~ 285 Hz), 115.9 (2C, CF3, 1 JCF ~ 285 Hz), 91.8 (2C, CH).19F (CDCl3, 298 K): d 274.15 (s,
6F), 275.06 (s, 6F). Anal. Calcd for C12H2F12O6Ru: C, 25.23;
H, 0.35. Found: C, 25.45; H, 0.40%.
Synthesis of complex (2). To a 160 mL stainless steel auto-clave was added 0.5 g of Ru3(CO)12(0.78 mmol), 1.0 mL of
(tmhd)H (4.8 mmol), 50 mL of hexane and a magnetic stirring bar. The autoclave was sealed and slowly brought to a temperature of 160uC under constant stirring. After 18 hours, the autoclave was cooled to room temperature and then opened. The light yellow solution was transferred out of the reactor. The hexane solvent was evaporated under vacuum and the residue dissolved into a minimum of warm methanol solvent. Cooling the methanol solution to 220uC produced a light yellow solid Ru(CO)2(tmhd)2, which was collected by
filtration. Yield: 1.11 g, 2.11 mmol, 90%. Further purification of this compound was carried out by sublimation at 80uC and 300 mTorr.
Spectral data of (2): MS (EI, 102Ru), m/z 524 (M1). IR (C6H12): n(CO), 2053 (s), 1985 (vs) cm21.1H NMR (CDCl3,
294 K): d 5.62 (s, 2H, CH), 1.09 (s, 18H, CH3), 1.04 (s, 18H,
CH3).13C NMR (CDCl3, 294 K): d 199.1 (2C, CO), 198.4 (2C,
CO), 197.0 (2C, CO), 98.6 (2C, CH), 42.1 (2C), 41.1 (2C), 28.7 (6C, CH3), 28.5 (6C, CH3). Anal. Calcd for C24H38O6Ru: C,
55.05; H, 7.31. Found: C, 55.37; H, 7.53%.
Synthesis of complex (3). A similar procedure was followed, using (acac)H as starting material rather than (hfac)H or (tmhd)H. The autoclave was heated at 160uC for 24 hours. After removing the hexane solvent, recrystallization of the solid residue from methanol at 4uC gave yellow-orange crystalline solid [Ru(CO)2(acac)2] in 85% yield. The compound melted at
115–117uC.
Spectral data of (3): MS (EI, 102Ru): m/z 356 (M1). IR (C6H12): n(CO), 2056 (s), 1988 (vs) cm21.1H NMR (CDCl3,
294 K): d 5.41 (s, 2H, CH), 2.04 (s, 6H, CH3), 2.02 (s, 6H, CH3). 13
C NMR (CDCl3, 294 K): d 197.5 (2C, CO), 189.9 (2C, CO),
189.0 (2C, CO), 100.6, (2C, CH), 27.8 (4C, CH3). Anal. Calcd
for C12H14O6Ru: C, 40.57; H, 3.97. Found: C, 40.19; H, 4.22%.
Synthesis of complex (4). A six-fold molar excess of (tfac)H (1.71 g) was added to Ru3(CO)12(0.8 g) in 50 mL of hexane.
The resulting mixture was heated to 170 uC for 24 hours, following which the volatiles were removed under vacuum. The yellow-orange solid product (1.5 g), which consists of three structural isomers, was obtained in 87% yield by reduced pressure distillation at 120uC and at 500 mTorr using a Bu¨chi GKR-51 distillation apparatus. Selected spectral data of 4: MS (EI,102Ru): m/z 464 (M1). IR (C
6H12): n(CO), 2073 (s), 2011
(vs) cm21.
A light yellow crystalline product, consisting of a single isomer (4a) with melting point 124–125uC, was obtained by repeated recrystallization from methanol solution at room temperature.
Spectral data of (4a): MS (EI, 102Ru): m/z 464 (M1). IR
(C6H12): n(CO), 2073 (s), 2011 (vs) cm21.1H NMR (CDCl3,
294 K): d 5.85 (s, 2H, CH), 2.21 (s, 6H, CH3). 13C NMR
(CDCl3, 298 K): d 198.4 (2C, CO), 195.2 (2C, CO), 169.0 (q,
2C,2JCF~ 34 Hz), 118.0 (q, 2C,1JCF~ 283 Hz), 95.8 (2C,
CH), 28.9 (2C, CH3).19F (CDCl3, 298 K): d 274.44 (s, 6F).
Anal. Calcd for C12H8F6O6Ru: C, 31.11; H, 1.74. Found: C,
31.30; H, 1.52%.
A yellow-orange viscous liquid, which is composed of an inseparable mixture of the other isomers (4b) and (4c) and a very small amount of (4a), was obtained from reduced pressure distillation of the filtrate that was collected during recrystalli-zation. Selected spectral data of a mixture of (4b) and (4c):1H NMR (4b, CDCl3, 294 K): d 5.90 (s, 1H, CH), 5.87 (s, 1H, CH), 2.22 (s, 3H, CH3), 2.21 (s, 3H, CH3).19F (CDCl3, 298 K): d 273.75 (s, 3F), 274.57 (s, 3F).1H NMR (4c, CDCl3, 294 K): d 5.88 (s, 2H, CH), 2.23 (s, 6H, CH3). 19F (CDCl3, 298 K): d 273.70 (s, 6F). X-Ray crystallography
Single crystal X-ray diffraction data were measured on a Nonius CAD4 diffractometer using l(Mo-Ka) radiation (l ~
0.71073 A˚ ). Data collection was executed using the SMART program, while cell refinement and data reduction were carried out using the SAINT program. The structure was determined using the SHELXTL/PC program and refined using full-matrix least squares. All non-hydrogen atoms were refined anisotro-pically, whereas hydrogen atoms were placed at the calculated positions and included in the final stage of refinements with fixed parameters. Three fluorine atoms, F(4), F(5) and F(6), of one of the CF3groups were found to be disordered, and the
occupancies (50:50%) were estimated according to the least J. Mater. Chem., 2003, 13, 1999–2006
squares refinement. Selected crystal data of (4a) are listed below:
C12H8F6O6Ru, M ~ 463.25, triclinic, space group P1¯, a ~
7.7805(8), b ~ 9.2982(2), c ~ 12.251(2) A˚ , a ~ 74.530(13), b ~ 83.433(13), c ~ 75.538(11)u, V ~ 826.0(2) A˚3
, Z ~ 2, rcalcd~ 1.863 g cm21, F(000) ~ 452, crystal size 0.50 6 0.50 6
0.50 mm, l(Mo-Ka) ~ 0.7107 A˚ , T ~ 295 K, m ~ 1.038 mm21,
3797 reflections collected, 3797 unique (Rint~ 0.0000), final
wR2(all data) ~ 0.0741. R1[I w 2s(I)] ~ 0.0267.
CCDC reference number 201228. See http://www.rsc.org/ suppdata/jm/b3/b300517h/ for crystallographic data in CIF or other electronic format.
CVD procedures
The thermal CVD reactions were carried using a vertical cold-wall reactor described elsewhere.13For deposition of Ru metal, the sample reservoir was maintained at 28uC and 50 uC for complex (1), and 80uC for complex (2); while RuO2thin films
were deposited using pure O2carrier gas. The flow rate of the
carrier gas was adjusted to 10–20 sccm, the sample reservoir was loaded with y50 mg of CVD source reagent, and the deposition time was set to a period of 20–40 min. Before each experiment, the Si wafers were rinsed with diluted aqueous solution of Buffered Oxide Etch 6:1 (J. T. Baker), followed by de-ionized water and acetone in sequence, and dried under nitrogen.
Results and discussion
Synthesis and characterization of Ru complexes
The ruthenium carbonyl complex Ru3(CO)12reacted with 6 eq.
of the b-diketone ligands in pentane or hexane solution at 160– 170uC to give the ruthenium complexes [Ru(CO)2(hfac)2] (1),
[Ru(CO)2(tmhd)2] (2), [Ru(CO)2(acac)2] (3) and [Ru(CO)2(tfac)2]
(4) in good yields. The applied experimental procedures were essentially identical to that reported in the literature, except that a nonpolar and highly volatile hydrocarbon solvent was utilized to replace the polar THF solvent, the latter gave much lower yields due to apparent sample decomposition.14 The molecular structures and physical data of (1)–(4) are summarized in Scheme 1 and Table 1, respectively. The reaction stoichiometry giving the observed products can be understood according to the chemical equation listed below:
Ru3(CO)1216 (diketonate)H A
3[Ru(CO)2(diketonate)2] 1 3H216CO
These ruthenium-containing metal complexes were purified by sublimation to remove trace amounts of black, non-volatile impurity, followed by recrystallization from a mixture of CH2Cl2and methanol at room temperature. Their color varies
from light orange, light yellow to yellow orange, respectively. The identification was achieved using FAB mass analysis, IR and NMR spectroscopy and elemental analysis. Of particular importance was the solution IR spectrum, for which two strong n(CO) stretching absorptions in the range of 2092–1985 cm21 were observed due to terminal CO ligands located in cis-positions;15the hfac complex (1) showed the highest stretching frequencies, i.e. at 2092 and 2036 cm21. This observation is in good agreement with the electron withdrawing property of the hfac ligand, making it a poor s-donor. The same electron withdrawing character then reduced the charge density on the Ru(II) metal center as well as the metal-to-ligand back
p-bonding to the nearby carbonyl ligands. Moreover, the13C NMR chemical shifts of the terminal CO ligands follow a monotonous trend of d 199.1 (2) w 197.5 (3) & 192.5 (1); showing a systematic de-shielding effect imposed by the b-diketonate ligands.
Thermogravimetric analysis of (1) carried out at atmospheric pressure and with N2as the carrier gas exhibited an onset of
loss of weight at 60 uC due to the direct evaporation of the sample, affording a zero residual weight at 125uC. On the other hand, the tert-butyl derivative [Ru(CO)2(tmhd)2] (2), for which
the tert-butyl groups are less effective in terms of reducing the intermolecular attraction, displayed a much higher onset temperature for sample evaporation at 130 uC and became completely vaporized upon raising the temperature to 215uC. The repulsive interaction between the lone pairs of fluorine atoms and the low polarizability of the C–F bonds are probably the two most important factors that contribute to the observed difference in volatility.16
In addition, the TG analysis of the parent acetylacetonate complex [Ru(CO)2(acac)2] (3) was recorded for comparison.
Again, a single-stage loss of weight was observed, for which the starting temperature of sample evaporation was akin to that of (2), except that the vaporization proceeded slightly faster, giving a null residual weight aty200 uC. The higher volatility of (3) is apparently due to the smaller molecular weight, which would give weaker van der Waals attractive interactions between each of the individual molecules. However, the melting point of (2) is only 70–72 uC, vs. the range of 115– 117uC observed for (3); the former would be more suitable to use as a liquid precursor,17 which would show a more reproducible and steady rate of evaporation, by keeping the temperatures of the sample reservoir and transport lines slightly higher than its normal melting point.
For the reaction employing Ru3(CO)12and the asymmetric
b-diketone ligand (tfac)H, all three isomeric products [Ru(CO)2(tfac)2] (4) were isolated by direct sublimation of
the product mixture, showing a statistical, random distribution Scheme 1
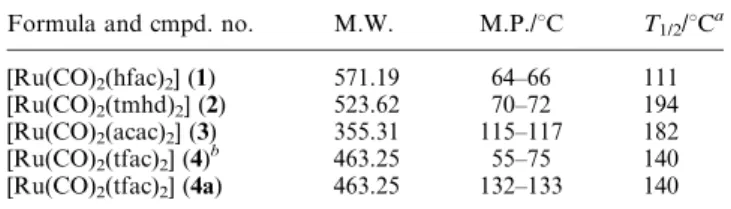
Table 1 Physical properties of the dicarbonyl b-diketonato ruthenium complexes
Formula and cmpd. no. M.W. M.P./uC T1/2/uCa
[Ru(CO)2(hfac)2] (1) 571.19 64–66 111 [Ru(CO)2(tmhd)2] (2) 523.62 70–72 194 [Ru(CO)2(acac)2] (3) 355.31 115–117 182 [Ru(CO)2(tfac)2] (4) b 463.25 55–75 140
[Ru(CO)2(tfac)2] (4a) 463.25 132–133 140
aThe temperature at which 50 wt.% of the sample was lost during
TGA analysis.bA mixture of three structural isomers.
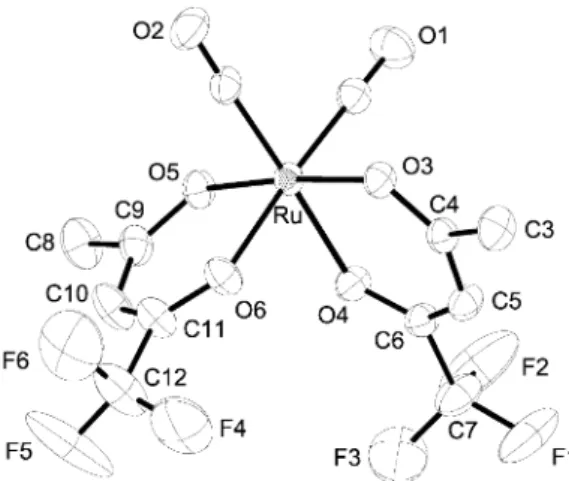
of the alkyl groups of the coordinated b-diketonate ligands. This is evident by the observation of four equal intensity CH signals at d 5.90 (4b), 5.88 (4c), 5.87 (4b) and 5.85 (4a) in the1H NMR spectrum of the directly sublimed sample, where the asymmetric isomer (4b) (see Scheme 1) is expected to show two signals with equal intensity. Repeated recrystallization from saturated methanol solutions gave the isolation of a crystalline product (4a) with a melting point (132–133uC) that was higher than that of the mixed products (55–75 uC). Single crystal X-ray analysis was then carried out to determine its config-uration. As indicated in Fig. 1, it shows the expected octahedral coordination arrangement with two cis-oriented CO ligands and a pair of chelating b-diketonate ligands, on which the CF3
substituents are located at the positions trans to the carbonyl ligands. Interestingly, a higher temperature, which is similar to that employed for the reactions of Ru3(CO)12and b-diketone
ligands, is required for inducing isomerization between 4a, 4b and 4c. This observation is evidenced by the result that less than 5% and 53% of the other two isomers (4b) and (4c), respectively, were observed upon heating a hexane solution of (4a) at 170uC in a stainless steel autoclave for 3 h and 12 h. Deposition of Ru metal thin films
Deposition of Ru metal thin film was conducted using a cold-wall CVD reactor, with the substrates maintained at tempera-tures 300–450 uC. For each CVD experiment, the source reagent (y50 mg) was vaporized at temperatures of 28–80 uC and under a pressure of 1–5 Torr, these parameters were fine-tuned according to the relative volatility of the source reagent employed. The carrier gas was either high purity H2 or a
mixture of 2% O2 in argon. At the end of each deposition
experiment, a gradual decreasing of the system pressure was observed, showing the total consumption of the source reagents and requiringy40 minutes. The combined CVD parameters are summarized in Table 2.
The first deposition experiment was carried out from source complex (1) and using the reductive carrier gas H2at 350uC.
The thin films showed a light gray and somewhat lustrous appearance. The resistivity was measured by the four-point probe method (r ~ 618 mV cm), which deviates significantly from that of bulk Ru metal (7.1 mV cm at 0uC). We believe that this high resistivity is mainly caused by the excessive carbon present in the thin films (30 at.% by XPS). Upon increasing the deposition temperature, the as-deposited thin films became much thicker, 3200 A˚ at 400 uC and 4800 A˚ at 450 uC, respectively; obviously due to the more effective metal deposition. The color of the thin films changed from light gray to silvery white and the electrical resistivities dropped to values of 39–26 mV cm, giving an indication of the improved thin film purity. For comparison, similar H2 induced
depo-sition of Ru metal was successfully achieved using several related carbonyl complexes Ru3(CO)12,7b Ru(CO)4(hfb)6 and
[Ru(CO)3(3,5-(CF3)2-pz)]2, pz ~ pyrazolate.18In this case, the
H2carrier gas would prevent the inadvertent metal oxidation,
which was reported for depositions using the alternative O2
carrier gas and gave rise to the formation of the RuO2rutile
phase, vide supra.
The scanning electron micrographs of these metal thin films are compiled in Fig. 2. A comparison of these pictures suggested an apparent distinction according to the applied deposition temperatures. At 350uC, the top surface appeared much smoother and the sizes of the microcrystalline grains werey50 nm. Upon increasing the temperature to 400 uC and to 450uC, the crystalline grains on the substrate grew much larger and the surface morphology turned rougher. The XRD data (Fig. 3) were consistent with these observations: the thin film deposited at the lowest temperature of 350 uC was essentially featureless, showing one broad signal in the 2h region between 42–45u. Upon increasing the temperature to 400uC, four diffraction signals due to the (100), (002), (101) and (102) planes of the hexagonal close packed (hcp) structure became visible. As their relative intensities were similar to those of the Ru bulk standard, it implied that the as-deposited thin film was composed of small crystallites with almost no orientation preferences. Finally, upon raising the temperature to 450uC, the XRD experiment showed a prominent increase of the (002) reflection at 2h ~ 42.2u with respect to the other signals. This is attributed to the fact that the (001) planes have the shortest crystallographic inter-planar spacing within the hexagonal Ru lattice structure, and should be the most pre-ferable growth direction under the condition of thermodynamic Fig. 1 Molecular structure of [Ru(CO)2(tfac)2] complex (4a). Selected
bond lengths are given as follows: Ru–C(1) ~ 1.877(3), Ru–C(2) ~ 1.874(3), Ru–O(3) ~ 2.052(2), Ru–O(4) ~ 2.060(2), Ru–O(5) ~ 2.041(2) and Ru–O(6) ~ 2.061(2) A˚ .
Table 2 Experimental data of the CVD experiments
Entry Source CGFR/sccm TS/ uC TD/ uC PS/ Torr Thickness/ A˚ D. Rate/ A˚ min21 Resistivity r/ mV cm Cont. (at.%) 1 (1) H2(20) 28 350 5 1600 23 618 C: 30 2 (1) H2(20) 28 400 5 3200 46 39 O: 4 3 (1) H2(20) 28 450 5 4800 69 26 O: 4 4 (1) O2(2%)/Ar (10) 50 300 5 600 12 34 C: 4; O: 8 5 (1) O2(2%)/Ar (10) 50 350 5 1450 28 15 C: 2; O: 3 6 (1) O2(2%)/Ar (10) 50 400 5 5000 96 37 C: 2; O: 9 7 (2) O2(2%)/Ar (10) 80 275 1 1400 31 206 C: 22; O: 3 8 (2) O2(2%)/Ar (10) 80 325 1 1600 36 111 C: 9; O: 1 9 (2) O2(2%)/Ar (10) 80 375 1 3000 67 24 C: 2; O: 6 10 (1) O2(10) 25 300 5 1600 80 218 O: 52 11 (1) O2(10) 25 350 5 4800 240 156 O: 65 12 (1) O2(10) 25 400 5 5400 270 170 O: 65
Abbreviations: CGFR: carrier gas flow rate, TS: source temperature, TD: deposition temperature, PS: initial system pressure, D. Rate:
deposi-tion rate, and Cont.: content of non-metal elements determined by XPS.
control. In accordance with this hypothesis, a high quality c-axis oriented Ru thin film was deposited on a glass substrate using dc magnetron sputtering.19
The deposition of Ru metal thin films was next conducted with complex (1) as the CVD precursor and a mixture of 2% oxygen in argon as the alternative carrier gas. The selection of this deposition parameter was encouraged by a recent report that the oxygen could enhance the oxidative ligand decom-position, resulting in metal deposition at lower temperatures, and then affecting the phase and other physical properties of the as-deposited thin film.20
For studying the deposition behavior under this new condition, the CVD runs were carried out at three tempera-tures: 300uC, 350 uC and 400 uC. The morphologies of the as-deposited thin films were investigated by scanning electron microscopy (Fig. 4). It can be seen that the thin film surfaces were smooth with neither pinholes nor cracks present between microcrystalline grains, particularly for the thin film grown at the limiting temperature of 300 uC. Upon increasing the temperature to 350uC and then to 400 uC, the surface turned much rougher, along with an obvious increase of grain sizes and thickness. These observations are consistent with the general tend of the grain growth vs. applied deposition temperature.21
X-Ray diffraction patterns of these thin films are compiled in Fig. 5. It is clear that the film deposited at 300uC is amorphous Fig. 2 SEM micrographs of the Ru films deposited from complex (1)
under H2atmosphere, deposition temperatures TDbeing (a) 350uC, (b)
400uC, and (c) 450 uC.
Fig. 3 X-Ray diffraction patterns for the Ru thin films deposited at temperatures TDof (a) 350uC, (b) 400 uC and (c) 450 uC.
Fig. 4 SEM micrographs of the Ru films deposited from complex (1) under a mixture of Ar with 2% of O2, deposition temperatures TDbeing (a)
300uC, (b) 350 uC, (c) 400 uC, and (d) 350 uC using a patterned thin film.
Fig. 5 X-Ray diffraction patterns for the Ru thin films deposited at temperatures TDof (a) 300uC, (b) 350 uC and (c) 400 uC.
and shows a very broad signal in area expected for the hcp Ru metal. At 350uC, three signals due to the (100), (002) and (101) planes became visible, with intensities being very close to those of the powdery Ru standard. Upon further increasing the temperature to 400 uC, the intensity pattern remained some-what identical, except that the (101) diffraction signal grew slightly faster, showing the situation where there was no preferred orientation. This observation is in sharp contrast to the previous deposition experiment carried out under H2
carrier gas. In addition, the observed XRD patterns showed no other diffraction signal, in particular at the 2h positions that could be assigned to the RuO2rutile phase. This confirmed that
the 2% O2 concentration would not promote the metal
oxidation in giving the RuO2 oxide phase, but rather a
ligand oxidation reaction. It then released the metallic Ru element and afforded the observed, high purity metal deposit on the substrates.
The resistivity of these thin film samples was then examined. As indicated in Table 2, they exhibited resistivity data in the range 37–15 mV cm. The lowest resistivity was obtained with sample deposited at 350uC, which was assigned as the optimal temperature for Ru metal deposition. In accordance with these results, X-ray photoelectron spectroscopy measurement (XPS) gives the carbon content at a level of 2–4 at.%, while that of oxygen falls in a much larger range of 3–9 at.%. Thus, the deviation from the ideal value of bulk Ru standard (7.1 mV cm) may be attributed to the incorporation of carbon and oxygen impurities as well as to the formation of many small crystallites in the as-deposited thin films.
For determination of the conformal deposition, we selected a patterned Si wafer containing through-holes with a diameter of 0.4 mm and an aspect of y2, and repeated the thin film depositions at the optimal temperature 350uC, using a mixture of Ar carrier gas with 2% oxygen and only one-third of the deposition time. The SEM picture of the as-deposited film is depicted in Fig. 4d. It is notable that through-holes have been evenly coated with a thin layer of ruthenium metal. The top surface of the resulting metal thin film appears smooth and featureless, and the thickness of the metal film within the holes is about the same as that deposited on the more exposed top surface, showing the good step coverage.
Moreover, the deposition of Ru metal was extended to experiments using the tmhd complex (2) and the carrier gas of 2% of oxygen in argon (Table 2). In order to balance the lower volatility of (2), increasing of the reservoir temperature to 80uC and reduction of the system pressure to 1 Torr were employed to assist the vaporization and transport of the precursor. It was observed that the successful deposition of an Ru thin film was realized at all three temperature settings (275, 325 and 375uC), which were slightly lower than those used for the hfac complex (1). Concurrently, the electrical resistivity of the thin films deposited at temperatures below 325 uC was found to be significantly greater than samples obtained at 375 uC. In agreement with these resistivity data, XRD analysis showed that the thin films deposited at temperatures below 325uC were amorphous, and XPS fitting gave 9 at.% and 22 at.% of carbon content for the films deposited at 325uC and 275 uC, respec-tively. Based on these observations, we suggest that these as-deposited Ru thin films possess a strong tendency to incorporate high levels of carbon, making them less desirable for practical applications.
Deposition of RuO2thin films
The RuO2thin films were grown on Si substrates using (1) as
the source reagent and using pure O2as the carrier gas. As can
be seen in Table 2, deposition occurred at temperatures as low as 300uC. The as-deposited thin films showed no cracks and adhered very well to the substrate surfaces, for which their SEM images are presented in Fig. 6. Columnar crystallite
grains and good coverage over the substrate surface were observed, which was attributed to the uninterrupted grain growth of the surface reaction controlled region. Moreover, the average grain size increases with increasing temperature, indicating that the grain growth is governed by the substrate temperature; i.e. the higher temperature provides greater kinetic energy to surpass the barrier for both crystal growth and boundary migration. Thus, the formation of larger crystallites on the substrate would occur through the reduction of the two-dimensional contact between the grains at higher temperature. For instance, the cross sectional view of the thin film deposited at 350uC indicated the formation of a larger columnar structure perpendicular to the substrate and the top surface was made up of semi-ellipsoidal crystallites of similar sizes. At 400uC, the RuO2 film showed the columnar
grains along with appreciable extrusions from its top surface, as compared with the morphologies observed at the lower temperatures. The resistivities of the films deposited at 300uC, 350uC and 400 uC were 218 mV cm, 156 mV cm and 140 mV cm, showing reduced resistivity with increasing deposition tempera-ture. For comparison, epitaxial RuO2 films deposited on the
(1102)-oriented Al2O3single-crystal substrate surfaces exhibited
a low electrical resistivity ry 30 mV cm at room temperature.22
The X-ray diffraction patterns of the RuO2films are depicted
in Fig. 7. The formation of the tetragonal rutile RuO2structure
is confirmed using four main diffraction peaks including the Fig. 6 SEM micrographs of the RuO2films deposited from precursor (1),
pure O2as carrier gas, and with deposition temperatures TDof (a) 300uC,
(b) 350uC, (c) 400 uC, and (d) 350 uC using a patterned thin film.
Fig. 7 X-Ray diffraction patterns for the RuO2thin films deposited at
temperatures TDof (a) 300uC, (b) 350 uC and (c) 400 uC. J. Mater. Chem., 2003, 13, 1999–2006
(110), (101), (200) and (211) planes of the RuO2standard. It is
noted that the film deposited at 300uC exhibits two signals that were derived from the (110) and (200) planes with a 1:2 ratio. On the other hand, the film deposited at 350uC shows notable (200) preference with respect to the other diffraction signals. In good agreement with our discovery, the formation of this (200) oriented, RuO2 thin film was obtained on the LaAlO3(100)
substrate with deposition temperatures greater than 500 uC, while the latter has been attributed to the minimization of the lattice misfits present between the films and substrates.23As the temperature was increased to 400 uC, the thin film began to exhibit no specific preferred orientations, while the (211) signal gained its intensity and became equal to the (200) diffraction.
XPS analysis
Fig. 8a shows the XPS spectrum of the Ru thin film deposition from complex (1) at TD~ 400uC (thin film #6). The fitting
curves of the corresponding Ru 3d5/2 and 3d3/2 peaks at BE
280.2 and 284.5 eV reveal the expected 3:2 ratio,24while the
very small deviation gives the relative content of carbon in the thin film sample (y2%). The XPS analyses of other Ru thin films were carried out accordingly and these analytical data are summarized in Table 2. Moreover, the presence of trace amounts of O-containing impurities and oxide phase RuO2
were evidenced by the detection of two relatively weak O(1s) XPS signals at BEy530 eV.
For the RuO2thin film deposited at 350uC using pure O2
carrier gas (thin film #11), the Ru (3d) XPS doublet was found
at 281.3 and 285.5 eV (Figure 8b), very close to the literature value of the RuO2 3d5/2 and Ru3d3/2 doublet peaks at BE
280.7–281.0 eV and BE 284.9–285.2 eV, respectively.25 The O(1s) XPS spectrum consists of an enhanced peak at 530.3 eV and a shoulder at 532.3 eV. This XPS survey spectrum was qualitatively identical to that of the RuO2thin film standard
reported in the literature.26 Similar spectral patterns were observed for the two other samples; as a result, we proposed that the carbon impurity was below the detection limit.
Summary
The b-diketonate complexes [Ru(CO)2(diketonate)2] were
prepared and their basic properties fully characterized. For the methodology, although the need for a stainless autoclave is not attractive for routine laboratory use, its simplicity will make this method particularly suitable for the future industrial operations. Two of them, i.e. (1) and (2), may give properties superior to those of the most volatile carbonyl complexes, i.e. Ru(CO)5
27
and Ru(CO)4(hfb), 6
and the commercially available liquid ruthenocene reagent Ru(C5H4Et)2.4
Ru metal thin films were fabricated from complex (1) and using H2carrier gas. The depositions of Ru metal were next
achieved from both (1) and (2), using the mixed carrier gas of O2in argon.28In this case, the precise control of oxygen partial
pressure (i.e. 2%) and accurate tuning of the deposition temperature are important; too high partial pressure of O2as
well as temperature would lead to the formation of a mixture of Ru and RuO2. In fact, such a mixed composition was obtained
during our initial attempts in searching for the optimal O2/Ar
ratio. Finally, depositions of conductive RuO2were executed
using (1) and pure O2carrier gas, and well-defined RuO2thin
films with the preferred (200) orientation were obtained at 350 uC, with the resistivity reduced to the lowest value of 156 mV cm. Their physical properties were comparable to those of other RuO2thin films obtained at higher temperatures.29
Acknowledgements
Y. C. thanks the National Science Council (NSC 91-2113-M-007-006) as well as the Ministry of Economy (91-EC-17-A-08-S1-0003) for financial support.
References
1 S. Yamamichi, P.-Y. Lesaicherre, H. Yamaguchi, K. Takemura, S. Sone, H. Yabuta, K. Sato, T. Tamura, K. Nakajima, S. Ohnishi, K. Tokashiki, Y. Hayashi, Y. Kato, Y. Miyasaka, M. Yoshida and H. Ono, IEEE Trans. Electron Devices, 1997, 44, 1076.
2 (a) E.-S. Choi, J.-B. Park and S.-G. Yoon, Chem. Vap. Deposit., 2001, 7, 260; (b) Y. Kim, S.-C. Ha, K.-C. Jeong, K. Hong, J.-S. Roh and H. K. Yoon, Integr. Ferroelectr., 2001, 36, 285; (c) M. Tarutani, M. Yamamuka, T. Takenaga, T. Kuroiwa and T. Horikawa, Thin Solid Films, 2002, 409, 8.
3 (a) D. E. Trent, B. Paris and H. H. Krause, Inorg. Chem., 1964, 3, 1057; (b) M. L. Green, M. E. Gross, L. E. Papa, K. J. Schnoes and D. Brasen, J. Electrochem. Soc., 1985, 132, 2677; (c) J. Si and S. B. Desu, J. Mater. Res., 1993, 8, 2644; (d) W.-C. Shin and S.-G. Yoon, J. Electrochem. Soc., 1997, 144, 1055.
4 (a) T. Aoyama and K. Eguchi, Jpn. J. Appl. Phys., 1999, 38, L1134; (b) Y. Matsui, M. Hiratani, T. Nabatame, Y. Shimamoto and S. Kimura, Electrochem. Solid-State Lett., 2002, 5, C18. 5 S. Uhlenbrock and B. A. Vaarstra, US Patent 1999, No. 5,962,716. 6 (a) Y. Senzaki, W. L. Gladfelter and F. B. McCormick, Chem. Mater., 1993, 5, 1715; (b) Y. Senzaki, D. Colombo, W. L. Gladfelter and F. B. McCormick, Proc. Electrochem. Soc., 1997, 97-25, 933. 7 (a) C. J. Smart, A. Gulhati and S. K. Reynolds, Mater. Res. Soc. Symp. Proc., 1995, 363, 207; (b) E. P. Boyd, D. R. Ketchum, H. Deng and S. G. Shore, Chem. Mater., 1997, 9, 1154. 8 (a) P. Hones, T. Gerfin and M. Graetzel, Appl. Phys. Lett., 1995,
67, 3078; (b) G.-R. Bai, A. Wang, C. M. Foster and J. Vetrone, Thin Solid Films, 1997, 310, 75; (c) J. M. Lee, J. C. Shin, C. S. Hwang, H. J. Kim and C.-G. Suk, J. Vac. Sci. Technol., 1998, Fig. 8 XPS spectra of (a) ruthenium film deposited using 2% of O2with
TD~ 400uC, and (b) RuO2film grown under O2carrier gas and with
TD~ 350uC. At the upper left corner of each spectrum, the dotted line
shows the fitted Ru 3d5/2and 3d3/2doublet components of the thin film
sample.
16, 2768; (d) J.-H. Lee, J.-Y. Kim and S.-W. Rhee, Electrochem. Solid-State Lett., 1999, 2, 622; (e) D.-J. Lee, S.-W. Kang and S.-W. Rhee, Thin Solid Films, 2002, 413, 237; (f) K.-W. Kim, N.-S. Kim, Y.-S. Kim, I.-S. Choi, H.-J. Kim, J.-C. Park and S.-Y. Lee, Jpn. J. Appl. Phys., Part 1, 2002, 41, 820; (g) M. Kadoshima, T. Nabatame, M. Hiratani, Y. Nakamura, I. Asano and T. Suzuki, Jpn. J. Appl. Phys., Part 2, 2002, 41, L347. 9 L. Meda, R. C. Breitkopf, T. E. Haas and R. U. Kirss, Mater. Res.
Soc. Symp. Proc., 1998, 495, 75.
10 (a) D. Barreca, A. Buchberger, S. Daolio, L. E. Depero, M. Fabrizio, F. Morandini, G. A. Rizzi, L. Sangaletti and E. Tondello, Langmuir, 1999, 15, 4537; (b) S. Barison, D. Barreca, S. Daolio, M. Fabrizio and E. Tondello, J. Mater. Chem., 2002, 12, 1511.
11 (a) F.-J. Lee, Y. Chi, P.-F. Hsu, T.-Y. Chou, C.-S. Liu, S.-M. Peng and G.-H. Lee, Chem. Vap. Deposit., 2001, 7, 99; (b) Y. Chi, F.-J. Lee and C.-S. Liu, US Patent 2001, No. 6,303,809. 12 L. C. Feldman and J. W. Mayer, Fundamentals of Surface and Thin
Film Analysis, North-Holland, New York, 1986, p. 354. 13 (a) H.-L. Yu, Y. Chi, C.-S. Liu, S.-M. Peng and G.-H. Lee, Chem.
Vap. Deposit., 2001, 7, 245; (b) Y.-L. Chen, C.-S. Liu, Y. Chi, A. J. Carty, S.-M. Peng and G.-H. Lee, Chem. Vap. Deposit., 2002, 8, 17.
14 F. Calderazzo, C. Floriani, R. Henzi and F. L’Eplattenier, J. Chem. Soc. (A), 1969, 1378.
15 (a) I. R. Baird, S. J. Rettig, B. R. James and K. A. Skov, Can. J. Chem., 1999, 77, 1821; (b) M. A. Bennett, G. Chung, D. C. R. Hockless, H. Neumann and A. C. Willis, J. Chem. Soc., Dalton Trans., 1999, 3451; (c) K.-B. Shiu, S.-J. Yu, Y. Wang and G.-H. Lee, J. Organomet. Chem., 2002, 650, 37.
16 (a) T. N. Martynova, L. D. Nikulina and V. A. Logvinenko, J. Thermal Anal., 1990, 36, 203; (b) I. K. Igumenov, V. R. Belosludov and P. A. Stabnikov, J. Phys. IV, 1999, 9, 15; (c) B. D. Fahlman and A. R. Barron, Adv. Mater. Opt. Electron., 2000, 10, 223; (d) Y. Chi, S. Ranjan, P.-W. Chung, C.-S. Liu, S.-M. Peng and G.-H. Lee, J. Chem. Soc., Dalton Trans., 2000, 343.
17 (a) F. Maury, J. Phys. IV, 1995, C5, 449; (b) F. Maury, Chem. Vap. Deposit., 1996, 2, 113.
18 Y.-H. Song, Y.-L. Chen, Y. Chi, C.-S. Liu, W.-L. Ching, J. J. Kai, R.-S. Chen, Y.-S. Huang and A. J. Carty, Chem. Vap. Deposit., 2003, 9, in press.
19 Y. Abe, Y. Kaga, M. Kawamura and K. Sasaki, Jpn. J. Appl. Phys., 2001, 40, 6956.
20 (a) S.-E. Park, H.-M. Kim, K.-B. Kim and S.-H. Min, J. Electrochem. Soc., 2000, 147, 203; (b) Y.-H. Lai, T.-Y. Chou, Y.-H. Song, C.-S. Liu, Y. Chi, A. J. Carty, S.-M. Peng and G.-H. Lee, Chem. Mater., 2003, 15, in press.
21 J. J. Kim, D. H. Jung, M. S. Kim, S. H. Kim and D. Y. Yoon, Thin Solid Films, 2002, 409, 28.
22 K. Frohlich, D. Machajdik, V. Cambel, I. Kostic and S. Pignard, J. Cryst. Growth, 2002, 235, 377.
23 P. Lu, S. He, F. X. Li and Q. X. Ji, Thin Solid Films, 1999, 340, 140.
24 (a) H. Kim, I. Rabelo de Moraes, G. Tremiliosi-Filho, R. Haasch and A. Wieckowski, Surf. Sci., 2001, 474, L203; (b) Y. Kaga, Y. Abe, H. Yanagisawa, M. Kawamura and K. Sasaki, Surf. Sci. Spectra, 1999, 6, 68.
25 H. Y. H. Chan, C. G. Takoudis and M. J. Weaver, J. Catal., 1997, 172, 336.
26 J. Sankar, T. K. Sham and R. J. Puddephatt, J. Mater. Chem., 1999, 9, 2439.
27 A. D. Berry, D. J. Brown, R. Kaplan and E. J. Cukauskas, J. Vac. Sci. Technol. A, 1986, 4, 215.
28 (a) G. S. Sandhu, Thin Solid Films, 1998, 320, 1; (b) T. Aoyama, M. Kiyotoshi, S. Yamazaki and K. Eguchi, Jpn. J. Appl. Phys., 1999, 38, 2194; (c) E.-S. Choi, J.-C. Lee, J.-S. Hwang, J.-B. Park and S.-G. Yoon, J. Electrochem. Soc., 1999, 146, 4189; (d) Y. Matsui, M. Hiratani, T. Nabatame, Y. Shimamoto and S. Kimura, Electrochem. Solid-State Lett., 2001, 4, C9.
29 (a) P. Hones, F. Levy, T. Gerfin and M. Gratzel, Chem. Vap. Deposit., 2000, 6, 193; (b) R.-S. Chen, Y.-S. Huang, Y.-L. Chen and Y. Chi, Thin Solid Films, 2002, 413, 85.