On the Measurement of Comparative Economic
Freedom across Nations
Jac C. Heckelman*
Department of Economics, Wake Forest University, U.S.A.
Abstract
The measurement of economic freedom is discussed. One particular set of freedom indi-ces developed by Heritage Foundation is detailed, including how the indiindi-ces are constructed and potential problems in the methodological design. Comparisons are made for the different levels of freedom individual nations and regions achieve.
Key words: economic freedom; methodology JEL classification: H10; P50
1. Introduction
Economists have begun to understand the importance of the structure of institu-tions in evaluating economic performance [North (1990) and Barro (1991)], but the concept of economic freedom remains an illusive term. Unlike pure measures of national wealth, such as GNP, measures of welfare, such as economic freedom, are more subjective. In general, economic freedom refers to the absence of governmen-tal control and direction of resources [Rabushka (1991)]. Around the world, bureau-crats and politicians believe they can manage, or at least fine-tune, the economy more properly than economic agents themselves in a free market environment. In every nation, the government is involved to some degree in micro-managing the economy.
Controversy remains over what is the proper role of government in the econ-omy, although the recent tendency has been to take a more limited view of govern-ment interference. Welfare economists still deem it necessary to correct various pri-vate market failures, such as providing public goods to overcome free-rider effects
Received November 14, 2001, revised April 18, 2002, accepted November 1, 2002.
* Correspondence to: Department of Economics, Wake Forest University, PO Box 7505, Winston-Salem,
NC 27109, U.S.A. Email: heckeljc@wfu.edu. The first draft of this paper was originally written while I was a Visiting Research Fellow at the American Institute for Economic Research. I thank Gerald O’Driscoll of Heritage Foundation for sending the data analyzed in that version of the paper. The current data used in this version of the paper are taken from Heritage’s website available at
http://www.heritage.org/research/features/index, which came to my attention while working on the revi-sions.
[Stiglitz (2000)], while others now view it necessary to limit government activities to only those which assist private market development, or what Olson refers to as ‘market-augmenting government’ [Olson (2000)]. Public choice scholars tend to stress the problems of government involvement [Mueller (1989) and Buchanan (1989)], and Austrians maintain that governmental intervention involves coercion which by its very presence lowers individual welfare [Barry (1984)]. These various positions are summarized in the recent debate between the two noted public finance economists, Richard Musgrave and James Buchanan [Buchanan and Musgrave (1999)].
The controversy begs the question of how to measure the degree of economic freedom and governmental involvement. Recently, organizations such as Heritage Foundation and Fraser Institute have developed definitive notions of how to measure economic freedom, which can then be used to objectively quantify how free or un-free people are in various nations:
The critical message of the index…is that government coercion and control over the entrepreneurial process are deadly forces. The index recognizes the important role of government in protecting free markets—principally through its judicial, monetary and international functions. But the overall conclusion is that the most important factors in determining growth and prosperity are policies that reduce, as much as possible, governments’ con-straints on economic activity [Johnston et al. (1997, p. A-22)].
In this paper, I discuss a recent set of freedom indices—in particular those de-veloped by Heritage Foundation, how the indices are constructed, and potential problems in the methodological design. Ratings are compared across nations, and conclusions are drawn regarding the importance of these measures.
Note the discussion is limited to the concept of economic freedom and does not consider other types of freedom, such as political freedom indices developed by Freedom House, among others. Thus, no consideration is given as to how or why the economic freedoms and restrictions in a nation have come to be, as the economic freedom index does not distinguish between dictatorially imposed or collectively agreed upon standards.
2. A Way to Measure Economic Freedom
Heritage Foundation considers 10 broad categories of economic freedom, rank-ing each nation on a scale of 1 to 5, where 1 is the highest level of freedom. Nations are then classified into four general groupings based upon their average score over all 10 categories:
Free 1.00−1.99
Mostly Free 2.00−2.99
Mostly Unfree 3.00−3.99
The 10 categories are comprised of the following to broadly measure the degree of government involvement in the production, distribution, or consumption of goods and services:
Trade Policy—tariff and non-tariff barriers; corruption
Fiscal Burden—income and corporate taxes; government expenditures Government Intervention—government consumption and ownership Monetary Policy—average and current inflation
Capital Flow and Foreign Investment—foreign investment code; restrictions
on foreign ownership and investment; legal equality between foreign and do-mestic companies
Banking and Finance—government ownership and regulation; restrictions on
foreign banks
Wage and Price Controls—minimum wage laws; government price controls;
government subsidies that affect prices
Property Rights—commercial code defining contracts; government
expropria-tion of property; protecexpropria-tion of private property; judicial delays; judicial corrup-tion
Regulation—licensing requirements; ease of obtaining licenses; environmental,
consumer, worker regulations; bureaucratic corruption
Black Market—smuggling; size of black market activity 3. Some Thoughts on the Relevance of Each Measure
Free trade is an important factor for economic growth and prosperity. False ar-guments surround the ideas that tariffs and quotas can be used to create a more fa-vorable trade balance and protect particular domestic businesses and workers, which in reality comes at the expense of businesses and workers in other sectors and the ultimate consumers of protected products. Trade is not a competitive game between nations, rather open trade benefits both partners overall. Trade barriers are often erected and maintained to benefit specific interests, rather than the nation as a whole [Krueger (1974) and Magee (1999)].
Taxes distort economic activity since they serve as a disincentive to engage in particular activities in favor of more governmentally-sanctioned activity and sup-press total economic output. Freedom from taxes means freedom for individuals, for better or worse, to choose how to spend their own time and money. Excise taxes on particular products which impose negative externalities on others can enhance eco-nomic efficiency. Most taxes, such as the income and corporate taxes that Heritage Foundation focuses on, do not meet this characteristic.
To a certain extent, taxes are a necessary evil in the sense that some revenue must be raised to support a functioning government, even for a minimal state inter-ested only in protecting the rights of its citizens (see below). How far beyond this hypothetical point current governments are is worth examining.
so-cialistic and Keynesian ideas. Although there are benefits to be had from certain products and services offered by the government, it is doubtful the benefits are larger than a private corporation could generate. Without a profit motive to rein it in, gov-ernment production usually serves as a substitute for efficient market production, often producing too much and at inflated costs. This concept is well developed in the large literature dealing with bureaucracies [see Wintrobe (1999) for a recent survey].
An exception to this argument exists for the case of pure public goods. Private markets tend to underproduce those goods which are inexcludable in nature. Nothing prevents even public goods, however, from the possibility of being overproduced or produced at too high a cost by the government sector.
Barter arrangements are generally inefficient and time-consuming. The inven-tion of money helps facilitate trade. But fiat money has no intrinsic value and is only a useful tool as long as people maintain confidence in its future acceptance. Inflation reduces the purchasing power of money and in the extreme can lead to the aban-donment of money as a means of exchange. Confidence in the currency is necessary to promote economic stability. But this should not be interpreted as a call for wage and price controls (see below).
A primary contributor to production is capital. For markets to work efficiently, it is necessary to allow capital to flow where it is most highly valued, including abroad. Domestic economies will benefit from attracting new capital for investment and production, and this will occur more frequently where foreign investors are free from undue burdens and restrictions and treated equally under the eyes of the law with domestic producers.
Banks typically provide the financial capital needed to start and expand busi-ness by lending against expected future earnings. Likewise, consumers are able to increase their purchasing ability by borrowing against future earnings. Restrictions in the banking sector serve to repress economic potential.
Economic freedom also entails the freedom to control one’s own labor and output. Restrictions and regulations in wage and price decisions raise the costs of engaging in economic activity and prevent fair trade from occurring.
Protection of private property may represent the most fundamental of economic freedoms. This is where a strong government force is most needed
—
to enforce, rather than undermine, property rights. Lack of enforcement of property rights cre-ates a strong disincentive for innovation, investment, and wealth production [North (1990)].Many of the categories discussed above are concerned with various regulations and restrictions in particular sectors of the economy. Other remaining regulations are grouped by Heritage into the Regulation category and comprise a substantial amount of governmental interference in the working of a free market economy.
Finally, black markets emerge when individuals attempt to circumvent gov-ernment interference. In a pure free market economy, black markets could not exist. Thus, the amount of black market activities serves as an additional indicator of the intrusiveness of government intervention. The greater the degree of government obstruction, the faster the underground black market economy will grow. Forcing
trade onto the black markets is inefficient due to problems of information and higher transaction costs [Rose-Ackerman (1978)]. On the other hand, an active black mar-ket may serve as a second-best solution to the problem of governmentally induced shortages.
4. Problems in Measuring Economic Freedom
As with any listing, the criteria are highly subjective. Heritage does not make a strong case for why the particular measures were adopted or why they ignored other potentially important considerations. For example, in measuring Trade Policy it is not clear if tariffs or quotas are considered more restrictive. Krueger’s (1974) early analysis of rent-seeking and Magee’s (1999) recent survey on protectionism imply quotas are more detrimental, whereas others have disagreed [Bhagwati and Sriniva-san (1980)]. Nor is it clear how to properly measure the other component (the degree of corruption) to their Trade Policy variable.
The limitation of 1−5 point scale groupings is that it obscures important differ-ences among the nations within each group. Only the measures for Fiscal Burden, Government Intervention, and Black Markets allow for half-point increments for values between 1 and 5, effectively creating 9 potential groupings. Further differen-tiation among the other factors would be equally illuminating. Unfortunately, Heri-tage does not explain why such a scale was only assigned to these few categories.
The use of categorical groupings leads to other potential problems as well. For example, the Government Intervention grading scale assigns the top value when government consumption totals less than 10 percent of GDP and there are virtually no government enterprises. But this does not truly represent complete freedom from intervention, and a nation that already meets this criterion could make future im-provements but would not be able to be credited with a better score. Likewise, the worst score is assigned when government consumption totals 45 percent or more of GDP and most industries are government-owned with few private enterprises. But even for a country fitting these characteristics, there is still the potential for increas-ing intervention which would not be reflected in future scores, makincreas-ing it appear the country is holding steady when in reality the situation is worsening.
The average score used for shorthand convenience is also potentially mislead-ing. Rating nations from 1 to 5 is intuitively appealing but actually completely arbi-trary. In order to compare average scores it must be true that nations rated as 2, 3, 4, or 5 necessarily actually have that many times the amount of restrictions on their freedom as a nation rated a 1 for that category. It also must be true that a nation with a four in every category has the same level of freedom as one rated a 3 in half the categories and a 5 in the other half. Neither assumption is justified. If all the various freedoms are not equal in importance or impact, the average score will be biased and empirical studies relying on this measure will be misspecified [Heckelman (2000)].
Other scholars and institutions have also created their own set of economic freedom indicators in what has become a growing cottage industry, including meas-ures maintained and updated by James Gwartney and Robert Lawson from a project
first begun, with Walter Block, for a conference at the Fraser Institute, and published in 1992. The latest measures are given in 2000 Economic Freedom of the World. [Detailed criticisms of their methodology are given in Heckelman and Stroup (2000).] Methodologies and individual measures differ (all are subject to varying degrees to the same criticisms leveled here at Heritage), making it even more diffi-cult to truly determine what constitutes economic freedom and which nations pos-sess these advantages. On the plus side, national relative rankings do not differ by a statistically significant degree across the differing lists, lending more support to the robustness of any set of these measures [Hanke and Walters (1997)].
It is important also not to confuse these freedoms with political rights. Freedom from autocratic authority and ability to engage in the democratic process also repre-sent necessary ingredients for a high quality of life. It should be no surprise that na-tions rated strongly for economic freedom tend to be the same nana-tions rated strongly for maintaining political rights and civil liberties, and the nations considered to be heavily engaged in repressing economic freedoms also score poorly on the political and civil rights indices [Farr et al. (1998) and Messick (1996)].
5. A Brief Trip around the World
The ratings for each country are now available from Heritage both in print form in their annual Index of Economic Freedom [O’Driscoll et al. (2002)] and online at
http://www.heritage.org/research/features/index. Table 1 lists the 2002 category and
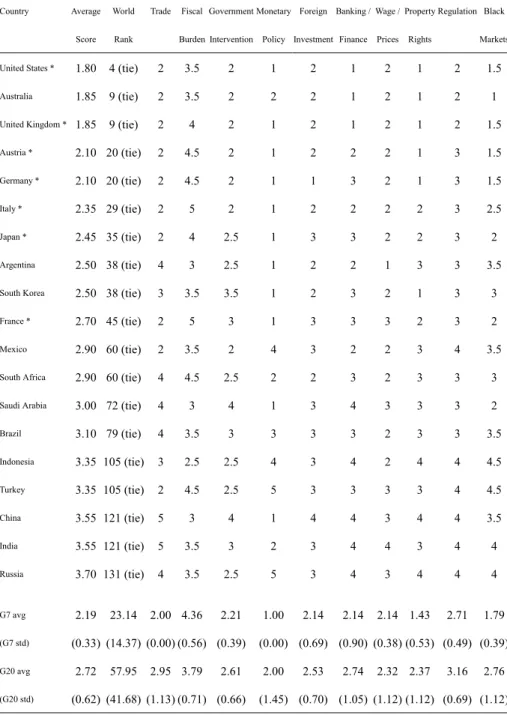
overall scores assigned by Heritage for each of the G20 nations, which comprises the original G7 nations plus twelve others (with the final member being the Euro-pean Union). The G7 represents the world’s most industrialized nations, but clearly not the world’s freest nations. Even among this small group of industrialized nations, there is considerable variation in the degree of economic freedom achieved. The United States is tied for fourth in the world rank of lowest average score achieved (representing least economic repression or most economic freedom) with four other nations, behind Hong Kong, Singapore, and New Zealand. The lowest rated G7 na-tion, France, places behind 45 other nations around the world. Among the G7, the United States has the top (lowest) average score, and only it and the United King-dom are within the “free” grouping; the others are “mostly free” by Heritage’s scor-ing.
Although the U.S. makes the top grouping of “free,” it does not do so easily. The U.S. garners top scores in only 3 of the 10 categories. Further investigation re-veals where the U.S., and in fact all the G7 nations, fare the worst: Fiscal Burden, which also has the worst world average among all the categories. In fact, it is the only category in which no nation in the world received the top score of 1 (although some nations have received this score in past years).
The greatest variation among the G7 nations exists in the category of Banking and Finance, while all these nations receive identical scores in Trade and Monetary Policy. There is also considerable variation within each country across the categories as well. For example, Germany is the only G7 nation to receive a top score for For-
Table 1. 2002 Economic Freedom Scores for G20 Nations (Excluding EU)
Country Average World Trade Fiscal Government Monetary Foreign Banking / Wage / Property Regulation Black Score Rank Burden Intervention Policy Investment Finance Prices Rights Markets
United States * 1.80 4 (tie) 2 3.5 2 1 2 1 2 1 2 1.5
Australia 1.85 9 (tie) 2 3.5 2 2 2 1 2 1 2 1
United Kingdom * 1.85 9 (tie) 2 4 2 1 2 1 2 1 2 1.5
Austria * 2.10 20 (tie) 2 4.5 2 1 2 2 2 1 3 1.5
Germany * 2.10 20 (tie) 2 4.5 2 1 1 3 2 1 3 1.5
Italy * 2.35 29 (tie) 2 5 2 1 2 2 2 2 3 2.5
Japan * 2.45 35 (tie) 2 4 2.5 1 3 3 2 2 3 2
Argentina 2.50 38 (tie) 4 3 2.5 1 2 2 1 3 3 3.5
South Korea 2.50 38 (tie) 3 3.5 3.5 1 2 3 2 1 3 3
France * 2.70 45 (tie) 2 5 3 1 3 3 3 2 3 2
Mexico 2.90 60 (tie) 2 3.5 2 4 3 2 2 3 4 3.5
South Africa 2.90 60 (tie) 4 4.5 2.5 2 2 3 2 3 3 3
Saudi Arabia 3.00 72 (tie) 4 3 4 1 3 4 3 3 3 2
Brazil 3.10 79 (tie) 4 3.5 3 3 3 3 2 3 3 3.5 Indonesia 3.35 105 (tie) 3 2.5 2.5 4 3 4 2 4 4 4.5 Turkey 3.35 105 (tie) 2 4.5 2.5 5 3 3 3 3 4 4.5 China 3.55 121 (tie) 5 3 4 1 4 4 3 4 4 3.5 India 3.55 121 (tie) 5 3.5 3 2 3 4 4 3 4 4 Russia 3.70 131 (tie) 4 3.5 2.5 5 3 4 3 4 4 4 G7 avg 2.19 23.14 2.00 4.36 2.21 1.00 2.14 2.14 2.14 1.43 2.71 1.79 (G7 std) (0.33) (14.37) (0.00) (0.56) (0.39) (0.00) (0.69) (0.90) (0.38) (0.53) (0.49) (0.39) G20 avg 2.72 57.95 2.95 3.79 2.61 2.00 2.53 2.74 2.32 2.37 3.16 2.76 (G20 std) (0.62) (41.68) (1.13) (0.71) (0.66) (1.45) (0.70) (1.05) (1.12) (1.12) (0.69) (1.12) Source: Heritage Foundation and author calculations; * indicates G7 nation.
eign Investment but is only a half-point away from the worst score for Fiscal Bur-den.
Compared to the rest of the G20, G7 nations have less economic freedom on average only for Fiscal Burden. Conversely, the greatest differential in terms of more economic freedom occurs primarily in Monetary Policy and Black Markets.
The five most populated nations in the world are represented in the G20, three of which comprise the bottom of the G20 in terms of economic freedom. Russia, China, and India are all classified as “mostly unfree.” China and India receive the worst scores possible for Trade and Russia for Monetary Policy. However, they each have at least as much economic freedom in terms of Fiscal Burden as any of the G7 nations, and China also receives the top score in Monetary Policy.
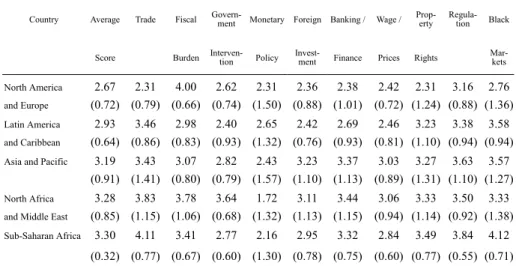
Table 2. 2002 Regional Averages (Standard Deviations)
Country Average Trade Fiscal Govern-ment Monetary Foreign Banking / Wage / Prop-erty Regula-tion Black
Score Burden Interven-tion Policy Invest-ment Finance Prices Rights Mar-kets North America and Europe 2.67 (0.72) 2.31 (0.79) 4.00 (0.66) 2.62 (0.74) 2.31 (1.50) 2.36 (0.88) 2.38 (1.01) 2.42 (0.72) 2.31 (1.24) 3.16 (0.88) 2.76 (1.36) Latin America and Caribbean 2.93 (0.64) 3.46 (0.86) 2.98 (0.83) 2.40 (0.93) 2.65 (1.32) 2.42 (0.76) 2.69 (0.93) 2.46 (0.81) 3.23 (1.10) 3.38 (0.94) 3.58 (0.94)
Asia and Pacific 3.19 (0.91) 3.43 (1.41) 3.07 (0.80) 2.82 (0.79) 2.43 (1.57) 3.23 (1.10) 3.37 (1.13) 3.03 (0.89) 3.27 (1.31) 3.63 (1.10) 3.57 (1.27) North Africa and Middle East
3.28 (0.85) 3.83 (1.15) 3.78 (1.06) 3.64 (0.68) 1.72 (1.32) 3.11 (1.13) 3.44 (1.15) 3.06 (0.94) 3.33 (1.14) 3.50 (0.92) 3.33 (1.38) Sub-Saharan Africa 3.30 (0.32) 4.11 (0.77) 3.41 (0.67) 2.77 (0.60) 2.16 (1.30) 2.95 (0.78) 3.32 (0.75) 2.84 (0.60) 3.49 (0.77) 3.84 (0.55) 4.12 (0.71)
Table 2 presents regional averages for each category. All the nations in North America and Western Europe are considered at least “mostly free.” Central and Eastern European nations are primarily a mixture of “mostly free” and “mostly un-free,” but Yugoslavia and Belarus are considered “repressed.” North American and European nations, while having the most freedom on average overall of any of the regions, including the most freedom on average for 7 of the 10 categories, has the least freedom on average for Fiscal Burden.
South America’s freedom rankings are split. All of the Eastern nations are “mostly unfree” while each of the Western nations are “mostly free,” except Ecuador is “mostly unfree” while Chile is “free.” The small island Caribbean nations are “mostly unfree,” while Haiti and the Dominican Republic are “mostly free” and Cuba is “repressed.” Taken as a whole, the Latin American and Caribbean nations have the most freedom on average of any region for Fiscal Burden and Government Intervention but the worst average for Monetary Policy.
Asian and Pacific nations represent a mixture across all four descriptive group-ings, including five of the eight most “repressed” nations in the world. In particular,
North Korea has the worst possible score in every category, as it has in every year since the rankings began in 1995
—
the only nation to achieve such a dubious dis-tinction. The least freedom on average in Foreign Investment is found in this region. North Africa and the Middle East represent an almost equal number of “mostly free,” “mostly unfree,” and “repressed” nations. They have the most freedom on average of any region in Monetary Policy but the least freedom on average in Gov-ernment Intervention, Banking and Finance, and Wages and Prices.Sub-Saharan Africa has the worst average for freedom overall of any region, as well as the worst average in four individual categories. This region is dominated by “mostly unfree” nations, but Zimbabwe is “repressed” and several nations are so unstable they are not rated at all.
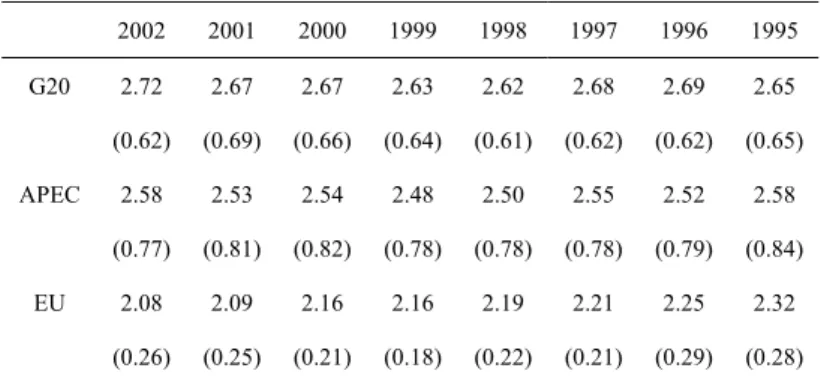
Table 3. Annual Averages and Standard Deviations for Average Score among Member Nations of Select Economic Organizations
2002 2001 2000 1999 1998 1997 1996 1995 G20 2.72 2.67 2.67 2.63 2.62 2.68 2.69 2.65 (0.62) (0.69) (0.66) (0.64) (0.61) (0.62) (0.62) (0.65) APEC 2.58 2.53 2.54 2.48 2.50 2.55 2.52 2.58 (0.77) (0.81) (0.82) (0.78) (0.78) (0.78) (0.79) (0.84) EU 2.08 2.09 2.16 2.16 2.19 2.21 2.25 2.32 (0.26) (0.25) (0.21) (0.18) (0.22) (0.21) (0.29) (0.28)
Most nations also belong to some sort of regional economic cooperative or-ganization. Of the 19 individual G20 nations presented in Table 1, eight belong to the Asia-Pacific Economic Cooperation (APEC) and five belong to the European Union (EU). Table 3 presents the average score for each organization among all the member nations, dating back to 1995—the first year of Heritage ratings. The trends in economic freedom are striking in their contrast across these three economic international organizations.
Economic freedom has been declining among the G20 nations for the past five years, and 2002 represents the least amount of freedom attained. For APEC, eco-nomic freedom has alternated between increases and decreases and currently rates the same as in 1995. Among the EU, the picture is one of overall steady improve-ment in each year.
6. What Does It All Mean?
Economic freedom indicators, as conceived by Heritage and Fraser, were ini-tially designed specifically to show the importance of freedom to overall economic performance. Indeed, studies have consistently shown nations are better off with a higher degree of economic freedom. Economic freedom indicators are strongly
cor-related with both the level and growth rate of GNP, national investment, life expec-tancy, literacy rates, and political and civil rights. It is not clear, however, if the cor-relations properly measure causal cor-relationships. To the extent that economic freedom is a normal good, greater prosperity may lead to a desire for more freedom once ba-sic needs are met.
Furthermore, the underlying components of a freedom index have different impacts and some may actually have inverse correlations, suggesting scholars need to be careful in offering policy prescriptions. While economic freedom, as a general concept, appears to be beneficial, not all freedoms are created equal, and some re-strictions on particular freedoms may still be warranted to enhance growth pros-pects.
This suggests correlations using the average score of freedom may be mislead-ing. It would be more illuminating to consider each of the individual categories in turn to determine which particular freedoms help or hinder wealth and welfare. Ag-gregating the categories into an overall index value is then tricky. In Heckelman and Stroup (2000), we advocated a hedonic regression approach, whereas Caudill et al. (2000) utilized principal components methods. Under either procedure, categories can receive either positive or negative weights, and thus the aggregated index score no longer retains its original interpretation. Lower aggregated scores would not strictly represent greater freedom.
The development of freedom ratings has allowed scholars to empirically show the relationship between various types of economic freedoms and other measures of wealth and welfare. More work in this important area is necessary to yield im-provements to the methodological design of the freedom indicators and for contin-ued independent analysis of the constructed indices and their underlying compo-nents.
References
Bhagwati, J. N. and T. N. Srinivasan, (1980), “Revenue Seeking: A Generalization of the Theory of Tarriffs,” Journal of Political Economy, 61, 1069-1087. Barro, R. J., (1991), “A Cross-Country Study of Growth, Saving, and Government,”
in National Saving and Economic Performance, B. D. Bernheim and J. B. Sho-ven eds., Chicago: University of Chicago Press, 271-304.
Barry, N., (1984), “The Austrian Perspective,” in D. Whynes ed., What is Political
Economy? Eight Perspectives, Oxford: Blackwell, 33-58.
Buchanan, J. M., (1989), Explorations into Constitutional Economics, College Sta-tion: Texas A&M University Press.
Buchanan, J. M. and R. A. Musgrave, (1999), Public Finance and Public Choice:
Two Contrasting Visions of the State, Cambridge: MIT University Press.
Caudill, S. B., F. C. Zanella, and F. G. Mixon, (2000), “Is Economic Freedom One Dimensional? A Factor Analysis of Some Common Measures of Economic Freedom,” Journal of Economic Development, 25, 17-40.
Po-litical Freedom, and Economic Well-Being: A Causality Analysis,” The Cato
Journal, 18, 247-262.
Grubel, H. W., (1998), “Economic Freedom and Human Welfare,” The Cato
Jour-nal, 18, 287-304.
Hanke, S. H. and S. J. Walters, (1997), “Economic Freedom, Prosperity, and Equal-ity: A Survey,” The Cato Journal, 17, 117-146.
Heckelman, J. C., (2000), “Economic Freedom and Economic Growth: A Short-run Causal Investigation,” Journal of Applied Economics, 3, 71-91.
Heckelman, J. C. and M. Stroup, (2000), “Which Economic Freedoms Contribute to Growth?” Kyklos, 53, 527-544.
Johnston, B. T., K. R. Holmes, and M. Kirkpatrick, (1997), “Freedom’s Steady March,” Wall Street Journal, December 1, A-22.
Krueger, A., (1974), “The Political Economy of the Rent-Seeking Society,”
Ameri-can Economic Review, 64, 291-303.
Magee, S. P., (1999), “Endogenous Protection: The Empirical Evidence,” in
Per-spectives on Public Choice, D.C. Mueller ed., Cambridge: Cambridge
Univer-sity Press, 526-561.
Messick R. E., (1996), World Survey of Economic Freedom 1995-96, Freedom House.
Mueller, D. C., (1989), Public Choice II, Cambridge: Cambridge University Press. North, D. C., (1990), Institutions, Institutional Change and Economic Performance,
Cambridge: Cambridge University Press.
O’Driscoll, G., K. R. Holmes, and M. A. O’Grady, (2002), 2002 Index of Economic
Freedom, Washington DC: The Heritage Foundation and The Wall Street
Journal.
Olson, M., (2000), Power and Prosperity, New York: Basic Books.
Rabushka, A., (1991), “Preliminary Definition of Economic Freedom,” in Economic
Freedom: Toward a Theory of Measurement, W. Block ed., Vancouver: Fraser
Institute, 87-108.
Rose-Ackerman, S., (1978), Corruption: A Study in Political Economy, New York: Academic Press.
Scully, G. W. and D. J. Slottje, (1991), “Ranking Economic Liberty across Coun-tries,” Public Choice, 69, 121-152.
Stiglitz, J. E., (2000), Economics of the Public Sector, 3rd edition, New York: W.W. Norton.
Wintrobe, R., (1999), “Modern Bureaucratic Theory,” in Perspectives on Public