Industrial & Engineering Chemistry Research is published by the American Chemical Society. 1155 Sixteenth Street N.W., Washington, DC 20036
Article
Effects of Relative Volatility Ranking on Design and Control of
Reactive Distillation Systems with Ternary Decomposition Reactions
Chin-Shih Chen, and Cheng-Ching Yu
Ind. Eng. Chem. Res., 2008, 47 (14), 4830-4844 • DOI: 10.1021/ie701787e • Publication Date (Web): 14 June 2008 Downloaded from http://pubs.acs.org on November 28, 2008
More About This Article
Additional resources and features associated with this article are available within the HTML version:
• Supporting Information
• Access to high resolution figures
• Links to articles and content related to this article
Effects of Relative Volatility Ranking on Design and Control of Reactive
Distillation Systems with Ternary Decomposition Reactions
Chin-Shih Chen and Cheng-Ching Yu*
Department of Chemical Engineering, National Taiwan UniVersity, Taipei 106-17, Taiwan
Design and control of reactive distillation systems of ternary decomposition reactions with two different relative volatility rankings, IK T LK + HK and HK T LK + IK, have been explored. Systems with intermediate boiling reactant have a behavior that is similar to that of the quaternary system with intermediate boiling reactants, if not simpler. Systems with heavy reactant are quite different. Two possible flowsheets (two-column and one-column configurations) have been discussed. The two-column flowsheet is workable for a wide range of chemical equilibrium constants. The one-column configuration is feasible for systems with high chemical equilibrium constants. Economical comparisons reveal that the one-column configuration is preferred for systems with large equilibrium constants while the two-column configuration is more economical in the region of low equilibrium constants. For the control of nonlinear reactive distillation systems, fast measurement (temperature measurement) is essential for tight control. Control performance deteriorates if significant measurement delay is present. Thus, parallel cascade control offers an attractive alternative for the control of reactive distillation systems in an offset free manner.
1. Introduction
Luyben1,2studied the design and control of reactive
distil-lation with “synthesis” reactions, A + B T C. In this work, we focus on the design and control of reactive distillation systems for ternary decomposition reaction A T B + C. The reaction considered is reversible, liquid phase, and endothermic. Two different relative volatility rankings are studied. The components are labeled as light key (LK), intermediate key (IK), and heavy key (HK) according to their boiling point ranking. The first case is when the reactant is the intermediate key, i.e., IK T LK + HK. Two examples are tert-butyl alcohol (TBA) decomposing into isobutene and water,3,4and the decomposition of cumene
hydroperoxide to produce phenol and water.5The second case
is when the reactant is the heavy key, i.e., HK T LK + IK. Notable examples include MTBE decomposition,6phenylethanol decomposition,7and glycerol decomposition.8 The ranking of boiling points and azeotropic temperature has an important effect on the process configurations and design.9 Note that many of the real systems mentioned have one or more azeotropes. An ideal system, on the other hand, can provide process insight, because physical parameter values can be manipulated in a continuous manner. In this work, two ideal cases will be explored separately to see how design parameters affect on the reactive distillation design, followed by control studies.
2. Ternary Decomposition Reaction: Intermediate Boiling Reactant
2.1. Column Configuration. This is the most favorable
relative volatility ranking, IK T LK + HK, in reactive distillation. The reactant (IK) is kept in the reactive zone, which is placed in the middle of the column, while the light and heavy products (LK and HK) can be withdrawn from the top and bottom of the column. Thus, the reactant concentration remains high in the reactive zone (midsection of the column) and products are removed continuously via separation in the
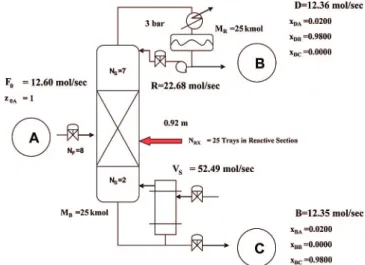
rectifying and stripping sections. Figure 1 gives the flowsheet where the reactive zone is placed in the midsection of the column.
2.2. Chemistry and Phase Equilibrium Parameters. Table
1 gives kinetic and vapor-liquid phase equilibrium parameters used in the numerical case considered here. The reaction on the nthtray can be expressed as:
Rn) MRX(kFxnA- kBxnBxnC) (1)
The forward reaction is first order in the mole fraction of A, and the backward reaction is proportional to the mole fractions of B and C. The equilibrium constant KEQis set to 0.2 as a
result of imbalance in reaction stoichiometry. Also note that this is an endothermic reaction as one would expect from a decomposition reaction (cracking). For phase equilibrium, constant relative volatility is assumed and tray temperature can be computed from tray liquid composition using the Antoine vapor pressure equations.
2.3. Design Parameters and Procedure. From a process
configuration perspective, the decomposition reaction A T B
* To whom correspondence should be addressed. Tel: +886-2-3366-3037. Fax: +886-2-2362-3040. E-mail: [email protected].
Figure 1. Ternary reactive distillation for decomposition reaction, A T B + C (IK T LK + HK), with RB/RA/RC) 4/2/1.
10.1021/ie701787e CCC: $40.75 2008 American Chemical Society Published on Web 06/14/2008
+ C with the reactant A being the intermediate boiler (e.g., relative volatility B/A/C ) 4/2/1) is actually quite similar to the quaternary reaction system A + B T C + D with intermediate boiling reactants A and B (e.g., C/A/B/D ) 8/4/ 2/1). In both cases, the reactive zone is placed in the middle of the column with a rectifying section and a stripping section at the ends of the column. High-purity heavy product C can be obtained from the bottoms, and the light product B is further purified and withdrawn from the top. The vapor boilup and reflux ratios are candidate manipulated variables to control the product purities in both ends of the column. As compared to the quaternary system, there is an important difference. This is a single-feed system. Therefore, the feed location can be assumed to be in the middle of the reactive zone.
The vapor rate (Vn) on the reactive tray is affected by the
heat of reaction (λ). Knowing the heat of vaporization (∆HV),
the vapor leaving reactive tray n can be expressed as
Vn) Vn-1- λ
∆HV
Rn (2)
The reaction is endothermic, soλ is positive. Thus vapor rates
decrease as we move up the column.
One mole of reactant produces two moles of products, and this tends to increase in the molar liquid flowrates in the reaction section. In addition, the liquid rate (Ln) is increased by the effects
of heat of reaction.
Ln) Ln-1+ λ
∆HV
Rn+ Rn (3)
The decomposition reaction is endothermic because a large molecule decomposes to two smaller molecules, which requires extra energy to break the chemical bond. Because a higher pressure leads to a higher equilibrium conversion as well as higher forward/backward reaction rates, a high column pressure is always preferable as far as design is concerned. In this work, we limit the column temperature to 120°C and, consequently, the column pressure is set.
Before getting into exploring process parameters, the design procedure is outlined. The design variables are the numbers of reactive (Nrx), rectifying (NR), and stripping (NS) trays and the
feed tray location (NF). All combinations are exhausted to find
the final design. The objective function for design is the minimum total annual cost (TAC), and the specifications are at least 98 mol % purities of the top and bottoms products. The TAC is the summation of the operating cost and the discounted capital cost (divided by the payback year). Here, a payback year of 3 is used. The formula for the TAC computation is taken from Kaymak and Luyben.10The optimization is carried out in a sequential manner and the design steps are as follows: (1)Place
the reactive zone in the midsection of the column and pick a number for the reactive trays (Nrx). (2)Guess the number of trays
in the rectifying section (NR) and the stripping section (NS).
(3)Guess the feed tray location (NF). (4)Estimate the holdup on
the reactive trays (Mrx). Perform dynamic simulation using
relaxation until the product specifications are met, followed by column sizing to find the column diameter and the corresponding reactive holdup (Mrx). Iterate the simulation runs until the
reactive holdup converges. A weir height of 10 cm is assumed. (5)Return to step 3 and modify the feed locations (NF) until the
TAC is minimized. (6)Return to step 2 and change NRand NS
until the TAC is minimized. (7)Return to step 1 and vary Nrx
until the TAC is minimized.
The optimized flowsheet is shown in Table 2. Figure 2 gives the composition profiles for the design. The effects of design parameters are explored next.
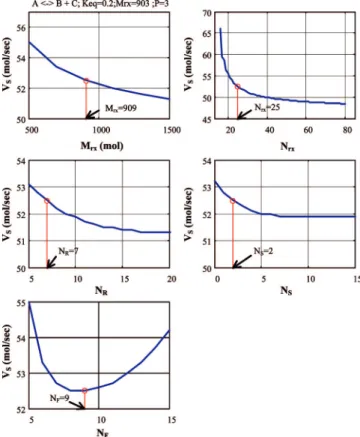
2.3.1. Holdup on Reactive Trays. The effects of five
different design variables on the vapor boilup rate are shown in Figure 3. Note that the changes are made around the nominal steady state. The top left graph shows that increasing holdup on reactive trays improves the steady-state designs for the ternary decomposition reaction A T B + C with relative volatility B/A/C ) 4/2/1. The reactant concentration (xA)
increases as the holdup decreases, while the temperature remains fairly constant. Also note that the vapor rate decreases as reactive holdup increases. This is the same result as found in the quaternary system. There are no counterintuitive effects of reactive tray holdup.
2.3.2. Number of Reactive Trays. There is an optimal
number of reactive trays at which vapor boilup is minimized in
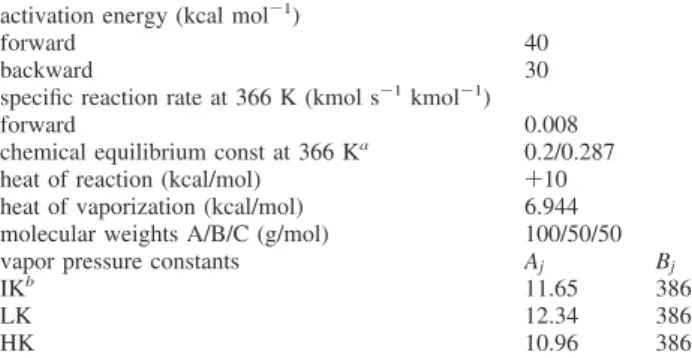
Table 1. Kinetic and Vapor-Liquid Equilibrium Parameters activation energy (kcal mol-1)
forward 40
backward 30
specific reaction rate at 366 K (kmol s-1kmol-1)
forward 0.008
chemical equilibrium const at 366 Ka 0.2/0.287
heat of reaction (kcal/mol) +10 heat of vaporization (kcal/mol) 6.944 molecular weights A/B/C (g/mol) 100/50/50
vapor pressure constants Aj Bj
IKb 11.65 3862
LK 12.34 3862
HK 10.96 3862
a0.2 for IK ) LK + HK reaction and 0.287 for HK ) LK + IK. bLK ) light key, IK ) intermediate key, and HK ) heavy key.
Table 2. Steady-State Conditions and Design Parameters for TAC Optimum Case with IK T LK + HK
fresh feed flowrate of A (mol/s) 12.60 distillate flowrate (mol/s) 12.36 bottoms flowrate (mol/s) 12.35 vapor boilup (mol/s) 52.49 reflux flowrate (mol/s) 22.68
stripping trays 2
reactive trays 25
rectifying trays 7
liquid holdup on reactive trays (mol) 909.3
pressure (bar) 3
vapor pressure constants Aj Bj
A 12.34 3862
B 11.65 3862
C 10.96 3862
product composition (mole fraction) reflux bottoms
A 0.0200 0.0200
B 0.9800 0.0000
C 0.0000 0.9800
Figure 2. Composition profiles for A T B + C with reactive zone between two dashed lines, the feed tray indicated in NFA, and fraction of total
the quaternary system.9,11 This effect does not occur in the ternary “synthesis” reaction system (A + B T C)1Does it occur
in the ternary “decomposition” reaction (A T B + C)? The upper right graph in Figure 3 shows that adding more reactive trays (Nrx) improves the steady-state design of the
ternary decomposition reaction. Vapor boilup rate decreases as reactive trays are added. Results show that reactant concentration remains high throughout the reactive section as we increase the reactive trays. Because the tray numbers are all different, the column height is normalized by the total number of trays, and the corresponding reactive zone is indicated on the top of the graphs. As a result of a much wider reactive section with relatively uniform reactant concentration as Nrxincreases, more
light product (B) is observed toward the column base, and, similarly, more heavy product (C) is also found toward the column overhead.
2.3.3. Number of Rectifying and Stripping Trays. In the
quaternary system, increasing the number of fractioning trays decreases vapor boilup, but in the ternary “synthesis” system, there is an optimal number of stripping trays. For the ternary “decomposition” with intermediate key component, the effects of rectifying and stripping sections on vapor boilup are shown in the middle two graphs in Figure 3. For the case of changing rectifying trays, the result shows that adding rectifying trays lowers the profile of the heavy component (C) (i.e., less C toward the top). Other than that, the reactant composition remains fairly constant in the reactive zone for all cases. And if we keep adding rectifying trays, little to no effect on the vapor boilup is observed as shown in Figure 3. Similar behavior can be seen for changing the stripping trays. That implies that as long as we have enough separation trays, adding more trays has little effect on reactive distillation performance.
2.3.4. Location of Feed Tray. Feed tray location is an
important design parameter in reactive distillation, especially in the ternary decomposition system. As shown in the bottom
graph in Figure 3, there is an optimal feed tray location in this design, and it is located in the lower section of the reactive zone. A feed tray located too high or too low increases the vapor boilup. The reason for this is that a balance between temperature and composition is needed to facilitate chemical reaction. For the case of varying feed tray location, the result shows that the case of NF) 9 gives a higher reactant concentration as well as
a higher column temperature around tray 10 as compared to NF
) 15.
3. Ternary Decomposition Reaction: Heavy Key Reactant with Two-Column Configurations
3.1. Column Configurations. Reactions with the heavy key
reactant decomposing into lighter products, HK T LK + IK, is the more general case in ternary decomposition reactions. This type of relative volatility may have adverse effects on column design because the heavy reactant tends to stay in the lower part of the column. This makes light product removal from column base difficult.
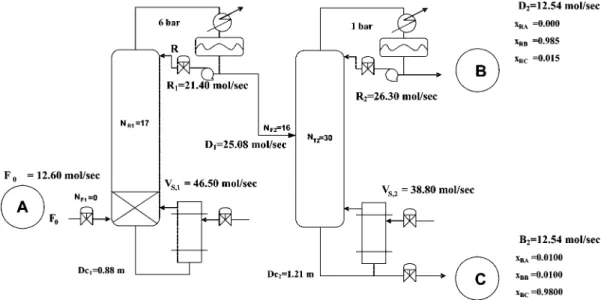
A straightforward approach is to simply use two columns. The heavy reactant is kept in the lower section of the first reactive column, and both of the lighter products are withdrawn together from the top. A second column separates the two products. Figure 4 gives the process flowsheet. Reactant A is fed to the column base of the first column, while both products B and C are taken out from overhead and separated in a second distillation column. The first column is a reactive distillation column with one feed and one product stream, and the reactive zone is placed in the lower section with an reactive column base where a large amount of catalyst can be used (10 times the catalyst used in a tray). Thus, this column has catalyst in the base and also catalyst on reactive trays.
3.2. Chemistry and Phase Equilibrium Parameters. Table
1 gives kinetics and vapor-liquid phase equilibrium parameters used in this case. Parameters are almost the same as in the previous case, except for the volatility ranking: reactant A becomes the heaviest. Another difference is the chemical equilibrium constant, which is changed from 0.2 to 0.28.
3.3. Design Parameters and Procedure. The TAC is used
to obtain the optimal design. For the design specifications in the second column, we set light product to 98.5 mol % B in the distillate and heavy product (intermediate key) to 98% C in the bottoms. As for the reactive distillation column, the conversion of A is set to 98%, and the composition of the column overhead is 49.75 mol % B and 49.75 mol % C. Because this is a sequential configuration with the two columns not coupled together, design steps can be carried out separately.
For the reactive distillation column: (1) Place the reactive zone in the base of the column with an initial estimate of reactive holdup and fix the number of reactive trays (Nrx). (2) Guess the
number of trays in the rectifying section (NR) and fix the feed
tray location (NF) location at the column base (tray 0). (3)
Perform dynamic simulation using relaxation until the conver-sion is met, followed by column sizing to find column diameter and corresponding reactive holdup (Mrx). Iterate simulation runs
until reactive holdup converges, using a weir height of 10 cm on reactive trays. (4) Return to step 2 and change NRuntil the
TAC is minimized. (5) Return to step 1 and vary Nrxuntil the
TAC is minimized.
For the distillation column: (1) Guess a total number of trays and feed tray location. (2) Perform dynamic simulation until specifications are met. (3) Return to step 2 and change NTand
NFuntil the TAC is minimized. Figure 3. Effect of design variables on vapor boilup rate Vswith nominal
Table 3 gives the optimized flowsheet, and the composition profile is given in Figure 5A,B. The reactive distillation consists of 17 rectifying trays and no reactive trays. The only reactive section is the column base. The heavy reactant A shows a decreasing trend toward the column top, and both products B (LK) and C (IK) have the same composition in the distillate. The reflux ratio is less than 1 while the boilup ratio is 2 as a result of reaction stoichiometry.
3.3.1. Reactive Holdup. Increasing the reactive holdup in
the column base decreases the vapor boilup, but by a very small fraction, as shown in the upper left graph in Figure 6. However, increasing reactive trays and increasing their reactive holdup in a tray has the opposite effect, which will be explained next.
3.3.2. Number of Reactive Trays. The optimum design has
no reactive trays, just a reactive base. However, if five reactive trays are used, as shown in the upper right graph in Figure 6, increasing the reactive tray has less than 1% influence on the vapor boilup. This is quite different from the system considered previously with an intermediate boiling reactant. For a case with five reactive trays, simulation results indicate that the reverse reaction dominates from tray 3 upward. Adding more trays does not help with the conversion. As opposed to the case of IK T LK + HK, both products in the HK T LK + IK case move in the same direction toward the top of the reactive distillation. High product concentrations promote the reverse reaction and
Figure 4. Two-column flowsheet for decomposition reaction, A T B + C (HK T LK + IK), with RB/RC/RA) 4/2/1. Table 3. Steady-State Conditions and Design Parameters for TAC
optimum Case with HK T LK + IK with Two-Column Configuration
Column 1 (Reactive Distillation Column) fresh feed flowrate of A, F0A(mol/s) 12.60
distillate flowrate, D1(mol/s) 25.08
vapor boilup, VS,1(mol/s) 46.50
reflux flowrate, R1(mol/s) 21.40
reactive trays, Nrx,1 0
rectifying trays, NR,1 17
(KEQ)366 0.2866
liquid holdup in column base (10 Mrx) (mol) 8910
pressure, P1(bar) 6
vapor pressure constants Aj Bj
A 10.96 3862
B 12.34 3862
C 11.65 3862
product composition (mole fraction) distillate xDj
A 0.0050
B 0.4975
C 0.4975
Column 2 (Distillation Column) distillate flowrate, D2(mol/s) 12.54
bottoms flowrate, B2(mol/s) 12.54
vapor boilup, VS,2(mol/ s) 38.80
reflux flowrate, R2(mol/s) 26.30
stripping trays, NS,2 15
rectifying trays, NR,2 15
liquid holdup in column tray, M2(mol) 1653.0
pressure, P2(bar) 1
product composition (mole fraction) distillate xDj bottoms xBj
A 0.0000 0.0100
B 0.9850 0.0100
C 0.0150 0.9800
Figure 5. (A) Composition profiles for the reactive distillation of the two-column flowsheet with reactive zone placed in the two-column base, the feed tray NFAindicated, and fraction of total conversion (Ri/Rt) also marked,
and (B) composition profiles for the distillation column of the two-column flowsheet.
lead to net negative reaction in the reactive trays. Additional reactive trays would keep compositions at their chemical equilibrium values, which would not change from tray to tray. The simulation result reveals that there is very little change in temperature over a wide section of the column, especially in the lower section. This implies these additional trays are not necessary for this process (Figure 6).
3.3.3. Number of Rectifying Trays. Adding more rectifying
trays would decrease the vapor boilup as shown in the lower right graph in Figure 6. Rectifying trays help keep the reactant in the reactive section, but the difference is relatively small.
4. Ternary Decomposition Reaction: Heavy Reactant with One-Column Configurations
We have studied the effects of design parameter in the two-column configuration. It is always possible to produce high-purity products using this two-column flowsheet (shown in Figure 4). Now we consider a more simple process configuration that has only a single column, as shown in Figure 7. If we consume most of the heavy reactant (HK, A) toward the bottom of the column, the heavier product (IK, C) can be obtained from the column base, while the lighter product (LK, B) can be withdrawn from the overhead. Then, the question becomesscan
the same purity level be obtained for both products using a single reactive distillation column? Feasibility analysis is useful in exploring this question.
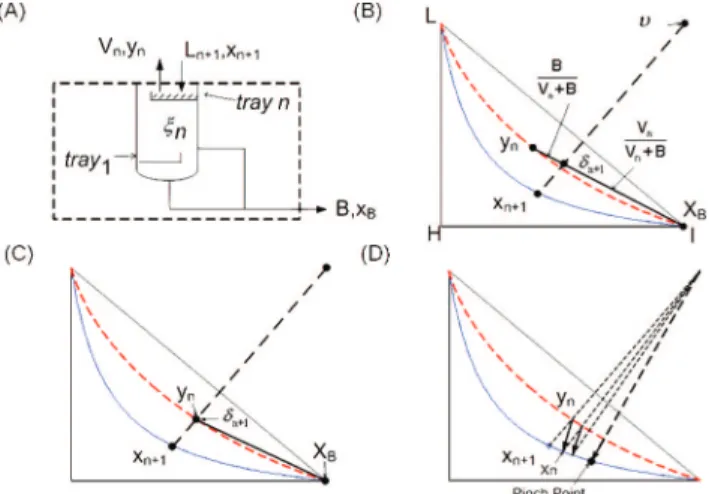
4.1. Feasibility Analysis. Feasibility analysis helps us to
determine whether a single reactive distillation process will produce on-spec products or not. It is carried out at the very beginning of the design and can provide guidance for conceptual design. One useful approach is the difference point method12,13
where tray-by-tray calculations are carried out to determine the feasibility. An advantage of the method is that the interaction between reaction and separation can be visualized. The entire procedure can be carried out using relatively simple calculations. More importantly, the theory is based on basic material balances. A very brief introduction is given here, and readers can refer to the original references for greater detail. Let us use the case A T B + C (HK T LK + IK) to illustrate the analysis. In the ternary composition space shown in Figure 8, H denotes the heavy key component, I means the intermediate key component, and L stands for the light key. We count the tray from bottoms up, i.e., reboiler is tray 0, followed by tray 1 and so on (Figure 8A). Consider the material balance around the envelope shown in Figure 8A, where there are n trays with reaction in this section and all flowrates are molar flows. There are two streams leaving the system (vapor flowrate Vnand bottoms flow rate B) and one liquid flow entering
the system (Ln+1).ξnis the total extent of reaction on all the trays
from tray 1 to n, including the column base.
Figure 6. Effect of design variables on vapor boilup rate Vsin the reactive
distillation column with nominal steady-state values marked with vertical line.
Figure 7. One-column flowsheet for decomposition reaction, A T B + C (HK T LK + IK), with RB/RC/RA) 4/2/1.
Figure 8. Feasibility analysis: (A) material balances on the envelope, (B) locateδn+1from eq 10 and the ynfrom eq 11, (C) under total boilup, and (D) stepping down the column under total boilup.
Figure 9. Transformed composition analysis: (A) projecting xIand xLonto
L-I edge as X1, (B) projecting corresponding vapor composition onto L-I
edge as Y1, (C) X1) Y1indicating reactive azeotrope, and (D) reactive
The variables yn, xB, and xn+1are corresponding composition
vectors of Vn, B, and Ln+1, respectively,υ is the vector chemical
stoichiometric, i.e., (B,C,A) ) (1,1,-1), andυTis the sum of
chemical stoichiometric, i.e., υT ) 1. So, the overall molar
balance and component material balances can be expressed as
Ln+1- Vn- B + ξnυT) 0 (4) Ln+1Fx n+1- Vny F n- Bx F B+ ξnυ F) 0 (5) Because υT ) 1, it will be dropped for the subsequent
development. Moving negative terms in eqs 4 and 5 to the right-hand side (RHS), we have
Vn+ B ) Ln+1+ ξn (6) VnFy n+ Bx F B) Ln+1x F n+1+ ξnυ F (7) Dividing the left-hand side (LHS) of eq 7 with the LHS of eq 6 and the RHS of eq 7 with the RHS of eq 6, δn+1 can be
defined. δn+1)Vny F n+ Bx F B Vn+ B ) Ln+1Fx n+1+ ξnυ F Ln+1+ ξn (8)
Rearranging the first two terms in eq 8, we have
δn+1) Vn Vn+ By F n+ B Vn+ Bx F B (9)
Similarly, manipulating the first and third terms in eq 8, one obtains δn+1) Ln+1 Ln+1+ ξnx F n+1+ ξn Ln+1+ ξnυ F (10)
Given the product specification (xB), flowrates (Vn, B, Ln+1) and
xn+1, nowξncan be computed directly from the overall material
balance (eq 4). Then, yncan be computed from eq 5. Using the
ternary mixing rule, the variables xn+1,υ, and δn+1 lie on a
straight line in the ternary space. Applying the lever-arm rule,
δn+1can be located according to eq 10 as shown in the dashed
straight line in Figure 8B. Next, yncan be found graphically
using the lever-arm rule according to eq 9. If the column is operated under total boilup (Vn/Bf∞),δn+1coincides with yn.
Thus, the pointsν, yn, and xn+1form a straight line as shown in
Figure 8C. This is useful because we can perform the material balance at the limiting condition. Once ynbecomes available,
we can find the corresponding xnfrom the tie line (vapor-liquid
equilibrium). Hence, one can step down the column all the way to xB, if it is feasible. Figure 8D shows how one performs the
tray-by-tray calculation toward the column base. However, when the reaction direction is the same as the separation direction (tie line), we have a pinch point and the desired product specification (xB) will not be reached (Figure 8D).
It is interesting to note that the pinch point in Figure 8D is exactly the “reactive azeotrope” which was discovered by Doherty and Malone and discussed in the book by the same authors.14A mathematical approach is taken, and the framework
for the analysis is based on the “transformed composition” that
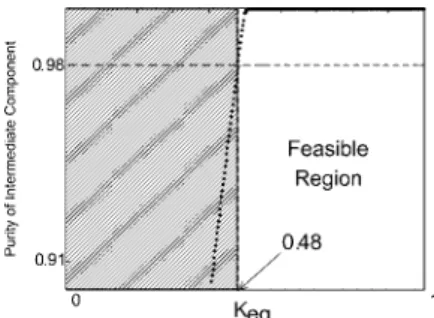
Figure 10. Bifurcation diagram for chemical equilibrium constant (KEQ)
and corresponding feasible region when product spec set to 0.98. Table 4. Steady-State Conditions and Design Parameters for TAC optimum Case with HK T LK + IK with One-Column
Configuration
fresh feed flowrate of A, F0A(mol/s) 12.60
distillate flowrate, D (mol/s) 12.60 bottom flowrate, B (mol/s) 12.45 vapor boilup, VS(mol/s) 73.90
reflux flowrate, R (mol/s) 44.10
reactive trays, NRX 79
rectifying trays, NR 11
feed tray location, NF 79
(KEQ)366 0.2866
liquid holdup on reactive tray, MRX(mol) 1067.6
pressure, P (bar) 6
vapor pressure constants Aj Bj
A 10.96 3862
B 12.34 3862
C 11.65 3862
product composition (mole fraction) distillate xDj bottoms xBj
A 0.0000 0.0080
B 0.9800 0.0120
C 0.0200 0.9800
Figure 11. Composition profiles of the one-column flowsheet with reactive zone placed in between the dashed lines, the feed tray NFAindicated and
fraction of total conversion (Ri/Rt) also marked in shaded area.
Figure 12. Effect of design variables on vapor boilup rate Vsin the reactive
distillation column with nominal steady-state values marked with vertical line.
is invariant from the standpoint of reaction. Let us use the HK TLK + IK system to illustrate the approach. The transforma-tion can be expressed as
XI)xI+ xH
1 + xH (11)
YI)yI+ yH
1 + yH (12)
where xIand xHare liquid mole fractions and yIand yHare vapor
mole fractions of the IK and HK components. Because mole fractions add up to unity (xL +xI + xH ) 1), eq 11 can be
rewritten as XI)xI+ xH 1 + xH) xI+ (1 - xI- xL) 1 + (1 - xI- xL)) 1 - xL (1 - xL) + (1 - xI) (13) It is clear that XIfalls between 0 and 1 (1 g XIg0). When xI ) 1, we have unity for the transformed variable, XI) 1 and,
similarly, xL)1 gives XI ) 0. Consider the ternary space in
Figure 9A where the solid line represents the chemical equi-librium line and the dashed line is the corresponding vapor line (in vapor-liquid equilibrium with liquid composition in the
chemical equilibrium line). The transformation of eqs 12 and 13 projects a composition in the 2-dimensional space (xI,xL)
onto L-I edge (XI) along the direction ofυ with the value of XI.
Let us use plane geometry to illustrate this. Assume XIis the
projection of (xI,xL). Figure 9A shows that the two rectangles
formed by A-υ-B-(xI,xL) and A′-υ-B′-XIare similar, and
the two triangles formed by A′-XI-L and B′-I-XI are
equilateral right triangles. The following condition is satisfied:
XI 1 - XI) r(1 - xL) r(1 - xI)) 1 - xL 1 - xI (14) where r is the ratio of the two lines formed by A-(xI,xL) and
A′-XI. Rearranging eq 14 gives exactly the same equation we
used in the transformation (eq 13). In other words, the transformation of eqs 11 and 12 is indeed the projection of (xI,xL)
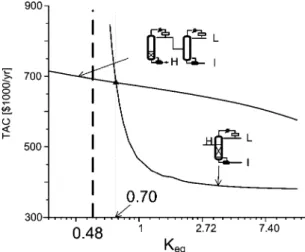
on the L-I edge, and Figure 9A shows the projection XIis simply Figure 13. TAC comparison for the two-column and one-column flowsheets.
Figure 14. U matrix from SVD analysis for the reactive distillation system with decomposition reaction A T B + C (IK T LK + HK) (Figure 1).
Figure 15. Control structure for the reactive distillation system with decomposition reaction A T B + C (IK T LK + HK): (A) CS1, (B) CS2, and (C) CS3.
the intersection of the straight line formed byυ and (xI,xL).
Figure 9B shows the projections of liquid (XI) and
corre-sponding equilibrium vapor (YI) compositions for the
trans-formed variables. The singular point with Xi) Yiat chemical
equilibrium is the reactive azeotrope as shown in Figure 9C. The feature of this point is that the direction of the reaction is the same as the direction of the material balance line from tray-by-tray calculation at infinite reflux ratio. A more familiar expression for the reactive azeotrope is the maximum (or minimum) value on a TXY diagram, except that X and Y are the transformed composition, as shown in Figure 9D. Therefore, given a chemical reaction system and corresponding vapor-liquid equilibrium, we can compute the reactive azeotrope numerically with simple transformation.
Certainly, the “reactive azeotrope” is the achievable bottoms product purity. Figure 10 shows the computed reactive azeo-trope, assuming chemical equilibrium. Assuming the temperature is 393 K, the chemical equilibrium has to be greater than 0.48 to reach 98% specification. That implies one-column configu-ration will be feasible for KEQg0.48.
4.2. Column Configuration. Figure 7 gives possible the
process flowsheet. This is a reactive distillation with a rectifying section. To keep the composition near the chemical equilibrium, a reactive stripping section is always necessary. The base of the column has 10 times the amount of catalyst used on the reactive trays. Heavy key reactant is fed to the top of reactive sections, and the light product can easily be obtained from the top of column. The purity of intermediate key product increases stage-by-stage in the reactive stripping sections all the way to the bottoms.
4.3. Design Parameters and Procedure. By setting the
product specifications of 98%, light key product in the top and intermediate key product in the bottoms, the reflux ratio and the boilup rate are manipulated to control product purities. Distillate and bottoms flows are manipulated to control the inventory of reflux drum and column base.
The design procedure based on TAC is as follows: (1) Place the reactive zone in the lower section of the column and fix the number of reactive trays (Nrx). Note that column base is packed
with 10 times the amount of catalyst used on a reactive tray.
(2) Guess the number of trays in the rectifying section (NR).
(3) Fix the reactant feed tray (NF). (4) Perform dynamic
simulation using relaxation via feedback control to meet the product specifications. (5) Return to step 3 and change NFuntil
the TAC is minimized. (5) Return to step 2 and change NRuntil
the TAC is minimized. (6) Return to step 1 and vary Nrx
until the TAC is minimized.
The optimal design is shown in Table 4. Figure 11 gives the composition profiles.
4.3.1. Reactive Tray Holdup. Increasing the reactive tray
holdup decreases the vapor boilup, because the products are going toward the opposite direction as the result of consuming all reactant A as shown in Figure 12. There is no counterintuitive effect.
4.3.2. Number of Reactive Trays. Increasing the number
the reactive trays dramatically reduces the vapor boilup as shown in the upper right graph in Figure 12. This is the result of approaching the reactive azeotrope toward the bottoms of the column, which can only be achieved gradually by widening the reactive stripping section.
4.3.3. Number of Rectifying Trays. Increasing the number
the rectifying trays decreases the vapor boilup as shown in the lower left graph in Figure 12, but not by much. The almost invariant temperature profiles from simulation runs confirm this insensitivity. There is no counterintuitive effect.
4.3.4. Location of Feed Tray. The lower right graph in
Figure 12 shows that there is an optimal feed tray location. This optimum location is the top of the reactive section. Above this point, the effect of rectifying section to keep the reactant in the reactive sections is lessened, and below this point there is an effect similar to reducing the number of reactive trays. Either position will increase the vapor boilup.
4.4. Comparison between These Two flowsheets. After
investigating two possible flowsheets, one will be interested in choosing the appropriate one for a given process. It turns out that the chemical equilibrium constant plays a critical role for selecting the better one, as shown in Figure 13. The TAC of single-column flowsheet decreases dramatically into the feasible region. When the chemical equilibrium constant is greater than 0.70, the one-column configuration prevails. On the contrary, if the chemical equilibrium constant is small, the two-column configuration is more economical. When the equilibrium constant is reduced further, passed the limit of feasibility, the two-column configuration is the only choice. As mentioned earlier, the achievable bottoms composition is the reactive azeotrope (Figure 10) and, for the case of equilibrium constant smaller than 0.48, 98% purity level cannot be achieved using one-column scheme.
5. Dynamics and Control
5.1. Intermediate Boiling Reactant. For the decomposition
reaction A T B + C, we consider the case when the reactant is the intermediate boiler, i.e., IK T LK + HK. With a one-reactant-two-product reaction system, the column has a bottoms product and a top product since the two products B and C are the lightest boiler and the heaviest boiler, respectively. Figure 1 shows the flowsheet. Steady-state conditions and design parameters are given in Table 2. Three alternative control structures are explored in the following sections. The objective is to maintain the specified purities of the top product at 98 mol % B and of the bottoms product at 98 mol % C. Load disturbances considered are production rate changes and feed composition variations.
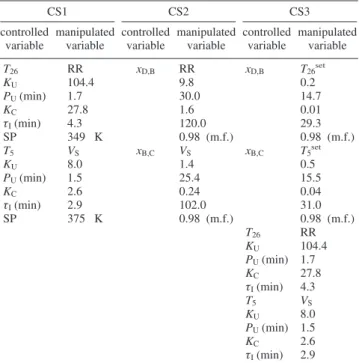
Table 5. Controller Tuning Parameters for Decomposition Reaction IK T LK + HK CS1 CS2 CS3 controlled variable manipulated variable controlled variable manipulated variable controlled variable manipulated variable T26 RR xD,B RR xD,B T26set KU 104.4 9.8 0.2 PU(min) 1.7 30.0 14.7 KC 27.8 1.6 0.01 τI(min) 4.3 120.0 29.3 SP 349 K 0.98 (m.f.) 0.98 (m.f.) T5 VS xB,C VS xB,C T5set KU 8.0 1.4 0.5 PU(min) 1.5 25.4 15.5 KC 2.6 0.24 0.04 τI(min) 2.9 102.0 31.0 SP 375 K 0.98 (m.f.) 0.98 (m.f.) T26 RR KU 104.4 PU(min) 1.7 KC 27.8 τI(min) 4.3 T5 VS KU 8.0 PU(min) 1.5 KC 2.6 τI(min) 2.9
There is only one reactant in the ternary decomposition reaction. Unlike the quaternary two-feed-two-product systems and ternary synthesis reactions with two-feed and one-product, the stoichiometric balance of the reactants is no longer a problem. The control strategy will focus on holding product purities at set points. Thus, the control problem is similar to that of conventional quaternary distillation columns.11,15
5.1.1. Control Structure CS1. A two-temperature control
structure is considered first. Selecting the vapor boilup and reflux
ratio as manipulated variables, the control problem then is to find the best locations for the two temperature control trays. The steady-state changes in tray temperatures throughout the column for several small changes in vapor boilup and reflux ratio and steady-state gain matrix can be obtained from this sensitivity analysis.
Singular value decomposition is used to select the control trays. Figure 14 shows the U vectors from the SVD analysis. The most sensitive locations are trays 26 and 5. Figure 15A
Figure 16. Control performance for the reactive distillation system with decomposition reaction A T B + C (IK T LK + HK) under (20%:∆F0changes
shows the control structure. Reflux drum level is controlled by manipulating distillate flowrate, and base level is controlled by manipulating bottoms flowrate. A third-order measurement lag with a time constant of 10 s is assumed in each temperature controller. The controllers are tuned by running relay-feedback tests. Values of ultimate gains and periods are given in Table
5. Tyreus-Luyben16tuning is used in most cases, but some
loops are detuned to give larger closed-loop damping coefficients. Results for the CS1 control structure are given in Figure 16A. In Figure 12 the disturbances are positive and negative 20% step changes in the feed flowrate at time equals to 100 min. The temperature dynamics are very fast and steady state can be reached in a few minutes. Composition dynamics are a little slower and settles in 50 min. However, 0.1 mol % steady-state offsets in product purities are observed.
5.1.2. Control Structure CS2. In order to eliminate
steady-state offsets in product compositions, dual composition control is implemented here. Figure 15B shows that the distillate composition is controlled by changing reflux ratio and bottoms composition is maintained by adjusting vapor boilup. Because composition analyzer has a slower response, a measurement deadtime of 4 min is assumed in the simulation. Relay feedback tests are performed to find settings for the PI controllers. Table 5 shows that because of the deadtime in the composition measurement, the reset times for the top and bottoms loops now become 120 and 102 min, as compared to 4.3 and 2.9 min in the case of temperature control.
Results for the CS2 control structure are given in Figure 16B. For feed flow disturbances, it takes longer than 10 h to reach steady state while keeping both product purities on spec. For feed composition disturbances, the dynamics are similar to that of feed flow changes. In summary, CS2 has the advantage of eliminating steady-state offsets, but the system needs more time to reach steady state and produces larger product purity
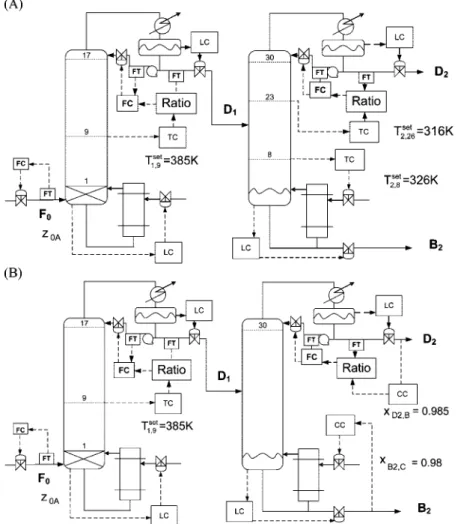
Figure 17. Control structure of the two-column flowsheet for reactive distillation system with decomposition reaction, HK T LK + IK, with (A) CS1 and (B) CS2.
Table 6. Controller Tuning Parameters for Decomposition Reaction HK T IK + LK with Two-Column Configuration
CS1 CS2 controlled variable manipulated variable controlled variable manipulated variable Column 1 (Reactive Distillation Column)
T1,9 RR1 T1,9 RR1 KU 36.4 KU 36.4 PU(min) 1.7 PU(min) 1.7 KC 12.1 KC 12.1 τI(min) 3.5 τI(min) 3.5 SP 385 K SP 385 K
Column 2 (Distillation Column)
T2,23 RR2 xD2,B RR2 KU 220.3 KU 12.7 PU(min) 1.7 PU(min) 44.9 KC 47.0 KC 4.2 τI(min) 5.4 τI(min) 89.8 SP 316 K SP 0.985 T2,8 VS2 xB2,C VS2 KU 51 KU 0.6 PU(min) 2.2 PU(min) 35.8 KC 17 KC 0.2 τI(min) 4.3 τI(min) 71.6 SP 326 K SP 0.98
variations in the transient state. This behavior is similar to the control of highly nonlinear processes where the deadtime leads to significant deviation from the nominal operating point which takes greater effort to bring back to the setpoints using linear controllers.16,17
5.1.3. Control Structure CS3. In order to maintain product
purities while having tight control performance, temperature/ composition cascade control structure is explored here (CS3). Figure 15C shows that the set point of tray 26 temperature is adjusted by the output of a composition controller by keeping
xDon set point. Similarly, the set point of tray 5 is changed by
the output of the bottoms composition controller. Using the same controller settings from CS1 in the temperature loops, relay feedback tests are used to obtain settings for the composition controllers. Values of ultimate gains and periods for both temperature and composition loops are given in Table 5.
Results for the CS3 control structure are given in Figure 16C. The dynamics are almost as fast as that of the temperature control, CS1, while eliminating steady-state errors. The results
clearly indicate the advantage of temperature/composition cascade control for reactive distillation systems when offset-free composition control is required.
Before leaving the section, it should be emphasized here that we also test feed composition disturbances (5% B in the feed and 5%C in the feed), and the general trend for different control structure applies. For the sake of brevity, the responses of feed composition disturbances are not included here.
5.2. Heavy Reactant with Two-Column Configuration.
The reaction, HK T LK + IK, is a more general case in ternary decomposition reactions. Steady-state design shows that there are two design options: a two-column configuration and a single reactive distillation column configuration. We have shown that, in terms of steady-state economics, these two configurations have their own applicable range as shown in Figure 13. The two-column configuration is favored when the chemical equi-librium constant is small and the single reactive distillation column configuration is preferred when a large chemical
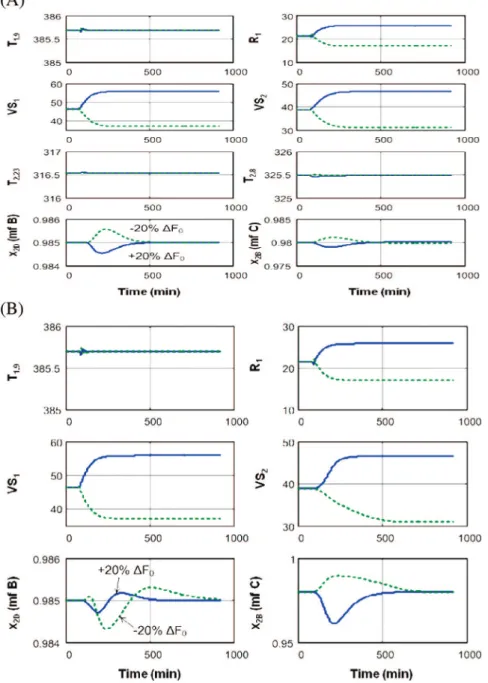
Figure 18. Control performance of the two-column flowsheet for reactive distillation system with decomposition reaction, HK T LK + IK, under (20% ∆F0changes using (A) CS1 and (B) CS2.
equilibrium constant is encountered. Now the question is: do these two configurations give comparable dynamic behavior? We first explore the two-column configuration as shown in Figure 4. In the first distillation column, the heavy reactant (A) is fed to the column base of the reactive distillation (RD) column while the light and intermediate boiling products (B and C) are withdrawn from the top. The binary mixture is then sent into a distillation column for further separation. Figure 4 gives the process flowsheet of the optimum design in terms of TAC.
Steady-state conditions and design parameters are given in Table 3. Figure 5A gives the composition profile of the reactive distillation column and Figure 5B shows the composition profile of the second distillation column.
5.2.1. Control Structure CS1. As discussed in the previous
section, temperature control gives much faster responses as compared to composition control. In this two-column config-uration, temperature control is used in the reactive distillation column followed by temperature or composition control for the product column, the second column. Because we are dealing with binary separation in the second column, dual-temperature control is considered first. Figure 17A gives the temperature control schemes. For the RD column, the most sensitive tray, tray 9 (T1,9), is chosen for temperature control. The temperature
is maintained at 385 K by manipulating the reflux ratio. For the distillation column, trays 23 and 8 (T2,23and T2,8) are chosen
as control trays by using singular value decomposition analysis. Relay-feedback tests are performed to find controller settings for these three temperature control loops. Table 6 gives controlled and manipulated variables and controller parameters. The performance of this control structure is given in Figure 18A for (20% changes in feed flowrate. Relative fast transients can be achieved, and little deviation in the top and bottoms compositions of column 2 is observed. Specifically, the devia-tions in product composidevia-tions are all less than 0.01%. Because we have two columns in series, the product compositions settle in ∼7 h while the temperatures return to set points in ∼3 h. The results indicate that the process is well controlled using temperature control.
5.2.2. Control Structure CS2. We can eliminate
composi-tion offsets altogether by implementing dual-composicomposi-tion control in the second distillation column. The control scheme is shown in Figure 17B. The temperature control of the RD column remains unchanged. But dual-temperature control of the second column is replaced by dual-composition control. Recall that a 4-min analyzer deadtime is assumed for composition measure-ments. Top product purity is maintained at 98.5% B by manipulat-ing the reflux ratio, and the bottoms product composition is controlled at 98% C by adjusting the vapor boilup. Again, relay-feedback tests are carried out to find ultimate gains and ultimate periods, followed by Tyreus-Luyben tuning with possible detun-ing. The tuning parameters are given in Table 6.
Figure 18B shows that much slower responses result for composition control. Product composition responses also show large deviations during transients as well as asymmetric behavior for positive and negative feed flow changes. For this two-column configuration, temperature control gives acceptable performance as compared to that of the composition control (in the product column).
5.3. Heavy Reactant with One-Column Configuration.
Now we will explore the control structure and dynamic performance of the single column configuration for the same reaction, HK T LK + IK. The design for this configuration is based on overcoming the unfavorable boiling point ranking reaching the reactive azeotrope at the bottom of the column. If we consume most of the heavy reactant by the time it reaches the bottoms of the reactive distillation column, the intermediate boiling product can be withdrawn from column base at the desired purity. This can only be achieved for systems with large chemical equilibrium constant as discussed earlier. In previous sections, the two-column configuration is shown to be control-lable with simple temperature control. Will the single-column configuration be dynamically controllable, especially when
Figure 19. Control structure of the one-column flowsheet for reactive distillation system with decomposition reaction HK T LK + IK, with (A) CS1, (B) CS2, and (C) CS3.
reaching “reactive azeotrope” at one end of the reactive distillation column?
Table 4 gives the steady-state conditions and design param-eters. For keeping the composition near chemical equilibrium, the entire lower section of the column contains reactive trays and the column base has 10 times the amount of catalyst used on each reactive tray. Figure 7 shows the flowsheet. As compared to the two-column configuration, this is a very tall column with 90 trays, versus 17 trays in the RD column for the two-column configuration. Figure 11 gives composition profiles.
Three control structures are considered here: single temper-ature control, two-tempertemper-ature control, and tempertemper-ature/ composition cascade control. The control objective is to keep the product purity at 98 mol % at both ends.
5.3.1. Control Structure CS1. Because we have a reactive
azeotrope toward the bottom of the column, it serves as a composition control mechanism in the lower part of the column. Figure 19A shows a control structure where the Tray 85 temperature is controlled using reflux ratio and the vapor boilup is ratioed to the feed flow. Figure 20A shows that almost offset
Figure 20. Control performance of the one-column flowsheet for reactive distillation system with decomposition reaction HK T LK + IK, under (20%∆F
free (composition) control can be achieved for feed flow disturbances and fast responses can also be observed. For all disturbances, the steady-state offsets in product compositions are less than 0.3%.
5.3.2. Control Structure CS2. Using the reflux ratio and
vapor boilup as manipulated variables, the two-temperature control structure is shown in Figure 19B. Two temperature control trays, tray 85 and tray 5, are selected on the basis of singular value decomposition analysis. Using relay-feedback tests, values of ultimate gains and periods are obtained as shown in Table 7. Tyreus-Luyben tuning is used, but some loops are detuned for less oscillatory responses.
Figure 20B shows the performance of this CS2 control structure under the feed flow disturbances. Tight control can be achieved with a settling time of∼2 h. For all disturbances, steady-state error in product composition is less than 0.2%, and mostly in the top product composition. As compared to CS1, the energy consumption of two-temperature control is less.
5.3.3. Control Structure CS3. The composition offsets can
be eliminated using temperature/composition cascade as sug-gested in the case of IK T LK + HK. Will the parallel cascade control also be effective for this one- column configuration with heavy reactant, HK T IK + LK?
With the same temperature controllers, CS2, implemented, composition measurements are made. The set point of tray 85 temperature is adjusted to maintain top product purity, and the set point of tray 5 temperature is changed to keep the bottoms product composition as shown in Figure 19C. Values of ultimate gains and ultimate periods are given in Table 7, and the results show that the ultimate periods of the composition controllers are 1 order of magnitude larger than that of the temperature controllers.
For feed flow disturbances, Figure 20C shows that tight composition control can be achieved in an offset-free manner. Because of the almost offset-free temperature control, little adjustment in the temperature set points is made.
6. Conclusion
This work explores the design and control of reactive distillation systems of ternary decomposition reactions with two
different relative volatility rankings, IK T LK + HK and HK TLK + IK. Systems with intermediate boiling reactant have a behavior that is similar to that of the quaternary system with intermediate boiling reactants. That is, the reactant is kept in the reactive zone, which is placed in the middle section, and the light and heavy products are withdrawn from top and bottoms, respectively. Systems with heavy reactant are quite different. Two possible flowsheets (two-column and one-column configurations) are discussed. In the two-column flowsheet, the reactive zone is placed in the lower section of the reactive distillation column and two light products are withdrawn from the overhead, followed by a conventional distillation to separate these two products. It is workable for all possible chemical equilibrium constants. The one-column configuration is feasible for systems with higher chemical equilibrium constants as shown in the feasibility analysis. Economical comparisons of these two flowsheets are also given. Control of nonlinear reactive distil-lation systems is studied next. Compared to the A + B T C + D and A + B T C systems, the decomposition reaction system is relatively easy to control because stoichiometric balance is no longer an issue. Following systematic control structure design, good control performance can be achieved. For IK T LK + HK, the most intuitive control structure could handle this process. Both temperature and temperature/composition cascade controls work out well. For HK T LK + IK, we have two process alternatives: two-column configuration and single RD column configuration. The results show that both process configu-rations give reasonable dynamic performance as long as prompt process measurements are available. Thus, the parallel cascade control is a candidate control structure. Moreover, single-end control will work well for the one-column configuration because we have reactive azeotrope toward the column base.
Acknowledgment
Financial support from the Ministry of Economic Affairs and from National Taiwan University Excellence Research Project (NTU-ERP-95R0066-BE04-04) is acknowledged.
Literature Cited
(1) Luyben, W. L. Effect of Kinetic and Design Parameters on Ternary Reactive Distillation Columns. Ind. Eng. Chem. Res. 2007, 46, 6944–6952. (2) Luyben, W. L. Control of Ternary Reactive Distillation Columns with and without Chemically Inert Components. Ind. Eng. Chem. Res. 2007,
46, 5567–5590.
(3) Qi, Z. W.; Sundmacher, K. Multiple Product Solutions of Tert-Butyl Alcohol Dehydration in Reactive Distillation. Ind. Eng. Chem. Res. 2006,
45, 1613–1621.
(4) Zhao, G. S.; Yang, B. L.; Yang, X. H. Catalytic Dehydration of Tert-Butyl Alcohol Using Cation Exchange Resin. J. Chem. Eng. Chin.
UniV. 2004, 18, 719–723.
(5) Doron, L.; Jose, S. Apparatus for Producing Phenol Using Reactive Distillation; U.S. Patent 6,441,252, 2002.
(6) Huang, K. J.; Wang, S. J. Design and Control of a Methyl Tertiary Butyl Ether (MTBE) Decomposition Reactive Distillation Column. Ind. Eng.
Chem. Res. 2007, 46, 2508–2519.
(7) Lange, J. P.; Otten, V. Dehydration of Phenyl-Ethanol to Styrene: Zeolite Catalysis under Reactive Distillation. J. Catal. 2006, 238, 6–12.
(8) Chin, C. W.; Dasari, M. A.; Suppes, G. J.; Sutterlin, W. R. Dehydration of Glycerol to Acetol Via Catalytic Reactive Distillation. AlChE
J. 2006, 52, 3543–3548.
(9) Tung, S. T.; Yu, C. C. Effects of Relative Volatility to the Design of Reactive Distillation Systems. AIChE J. 2007, 53, 1278–1297.
(10) Kaymak, D. B.; Luyben, W.L. Quantitative Comparison of Reactive Distillation with Conventional Multiunit Reactor/Column/Recycle Systems for Different Chemical Equilibrium Constants. Ind. Eng. Chem. Res. 2004,
43, 2493–2507.
(11) Al-Arfaj, M. A.; Luyben, W. L. Comparative control study of ideal and methyl acetate reactive distillation. Chem. Eng. Sci. 2002, 57, 5039–5050. Table 7. Controller Tuning Parameters for Decomposition Reaction
HK T LK + IK with One-Column Configuration
CS1 CS2 CS3 controlled variable manipulated variable controlled variable manipulated variable controlled variable manipulated variable T85 RR T85 RR xD T85set KU 37.5 37.5 0.3 PU(min) 1.58 1.58 14.7 KC 12.5 12.5 0.01 τI(min) 3.1 3.1 29.5 SP 372 K SP 372 K 0.98 T5 VS xB T5set KU 4681 0.05 PU(min) 1.2 22.2 KC 1560 0.002 τI(min) 2.4 44.3 SP 391 K 0.98 T85 RR KU 37.5 PU(min) 1.58 KC 12.5 τI(min) 3.1 T5 VS KU 4681 PU(min) 1.2 KC 1560 τI(min) 2.4
(12) Lee, J. W.; Hauan, S.; Westerberg, A. W. Feasibility of a reactive distillation column with ternary mixtures. Ind. Eng. Chem. Res. 2001, 40, 2714–2728.
(13) Chin, J.; Kattukaran, H. J.; Lee, J. W. Generalized Feasibility Evaluation of Equilibrated Quaternary Reactive Distillation Systems. Ind.
Eng. Chem. Res. 2004, 43, 7092–7102.
(14) Doherty, M. F.; Malone, M. F. Conceptual Design of Distillation
Systems; McGraw-Hill: New York, 2001.
(15) Hung, S. B.; Tang, Y. T.; Chen, Y. W.; Lai, I. K.; Hung, W. Z.; Huang, H. P.; Lee, M. J.; Yu, C. C. Control of Different Reactive Distillation Configurations for Acetic Acid Esterification. AIChE J. 2006, 52, 1423– 1440.
(16) Luyben, W. L.; Luyben, M. L. Essentials of Process Control; McGraw-Hill: New York, 1997.
(17) Lin, Y. D.; Huang, H. P.; Yu, C. C. Relay Feedback Tests for Highly Nonlinear Processes: Reactive Distillation. Ind. Eng. Chem. Res. 2006, 45, 4081–4092.
ReceiVed for reView December 31, 2007 ReVised manuscript receiVed April 25, 2008 Accepted April 30, 2008