Transport Mechanisms of Coarse, Fine, and Very Fine
Particulate Matter in Urban Street Canopies with Different
Building Layouts
Tsang-Jung Chang, Hong-Ming Kao, Yu-Ting Wu, and Wei-Hua Huang
Department of Bioenvironmental Systems Engineering, National Taiwan University, Taipei, Taiwan,
Republic of China
ABSTRACT
A particulate matter (PM) transport model is developed to investigate coarse PM (PM10), fine PM (PM2.5), and very fine
PM (PM1) transport mechanisms in urban street canopies
under low-wind conditions. Two common building layouts (i.e., the open and staggered street canopies) are considered. Large eddy simulations with the subgrid-scale stress model and the wall function are used to simulate urban street-canopy flows. The Lagrangian particle tracking approach, considering the effects of the drag force, gravitational force, Brownian motion, and Saffman lift force on particles is adopted to study PM transport behaviors in urban street canopies. The box counting method is used to calculate the canopy-averaged PM10/PM2.5/PM1mass concentrations and
transport mechanisms at each tracking time. The simulated results show that the removal efficiencies of PM10, PM2.5,
and PM1in the open street canopies are all better than those
in the staggered street canopies. As a result, the open street canopies having higher PM removal ability lead to a swifter shift of the particle size distributions towards smaller size and less deviation than the staggered street canopies. The major particle removal mechanism for the open street can-opies is particle escape, whereas wall deposition plays the most important role for the staggered street canopies. In comparison with the effectiveness of PM10/PM2.5/PM1
re-moval for both building layouts, PM10particles are easier to
overcome the root mean square vertical turbulent velocity and need less time to deposit. Fine particles would follow airflow paths and need longer time to deposit. As a result, PM2.5and PM1are more difficult to be removed than PM10.
INTRODUCTION
In urban areas, one of the major sources of air pollution is the airborne particulate matter (PM) emitted from motor vehicle exhaust. PM mostly disperses with canopy air-flows around urban streets, and not only generates infe-rior air quality but also causes injury to the human respi-ratory system. Several studies have indicated that coarse PM (PM10, aerodynamic diameters less than 10m) can
be inhaled and deposited in the human respiratory sys-tem to cause serious long-term health effects such as car-diovascular disease or acute health effects such as allergies and irritation of the eyes, nose, and throat.1,2In
particu-lar, the finer particle fractions of PM10such as PM2.5(fine
PM) and PM1(very fine PM) can penetrate deeper into the
pulmonary alveolus and therefore cause an increase in daily mortality and asthma.3–5In many Asian cities, such
as Taipei, Tokyo, Shanghai, and Hong Kong, extensive transportation systems are built within narrow streets with clusters of buildings or skyscrapers. PM10, PM2.5, and
PM1 are easily congregated to deteriorate air quality
around urban street canopies, causing city dwellers to have a high potential for a disorder of the respiratory system, especially at low wind speed conditions. Thus, studies on transport behavior and mechanism of PM10,
PM2.5, and PM1at low wind speed conditions are crucial
in Asia to promote a more comfortable and healthy urban pedestrian environment.
Academic researches regarding PM transport behavior and mechanism in urban areas have been carried out by full-scale experiments,6 – 8wind tunnel experiments,8 –11and
microscale numerical studies.12–24Generally, experimental
studies can provide useful knowledge of pollutant disper-sion and PM transport behavior on the sample points for given experimental configurations. It is very difficult to si-multaneously obtain temporal and spatial information on the distributions of airflow velocity, PM size, and concen-tration for the entire urban areas. With increased computing power, microscale computational fluid dynamics (CFD) are capable and convenient for analyzing airflow patterns and PM concentrations because CFD models can reproduce the entire flow and concentration fields over a street-canopy domain rather than at specific points.
PM transport behaviors and mechanisms in urban areas are influenced by many factors, such as inflow con-ditions (wind speed, wind direction and turbulence), building geometry (height, width, roof type), surrounding
IMPLICATIONS
In many Asian cities, an extensive transportation system is built within narrow streets with clusters of buildings. Pol-luted PM10/PM2.5/PM1 are easily congregated to
deterio-rate air quality around urban street canopies, leading to urbanites with a high potential for disorders of the respira-tory system, especially at low wind speeds. Therefore, there is a high demand in Asia for investigating PM10/PM2.5/
PM1transport mechanisms under low wind speed
condi-tions. This work numerically investigates the canopy airflow patterns and PM10/PM2.5/PM1transport mechanisms of the
open and staggered street canopies. The results will help in understanding PM transport behaviors in urban street canopies.
building layouts (street width and configuration), thermal stratification (solar insulation and orientation, building and street thermal capacitance), and traffic conditions (traffic intensity, vehicle emissions, vehicle movement). One potential advantage of the use of microscale CFD is that CFD models can provide an opportunity to examine the effects of the above various factors individually, which can directly improve the understanding of PM transport behavior and mechanisms in urban street can-opies. Among the microscale CFD studies12–24(e.g.,
Wal-ton and Cheng,12Walton et al.,13and Caton et al.14) have
used large eddy simulations to investigate pollutant dis-persion mechanisms within an isolated urban street can-yon. Lee and Park15and So et al.16have studied wind flow
and pollutant dispersion in a two-dimensional (2D) street canyon with different aspect ratios. Xie et al.17conducted
investigations on the effect of solar radiation on pollutant distribution in an urban street canyon. Xia and Leung18
and Chang and Wu19used the Lagrangian particle model
together with a 2D wind field model to simulate particle dispersion for different building configurations within urban street canopies. Liu and Ahmadi20and Ahmadi and
Li21 developed a Lagrangian particle tracking model to
study PM transport behaviors near Peace Bridge, Buffalo, NY, and an isolated building, respectively. Seven particle sizes (50, 20, 10, 5, 1, 0.1, and 0.01 m) were used to investigate the relationship between particle size and PM transport and deposition behavior. However, these works did not integrate their results of various single-size parti-cles into PM10/PM2.5/PM1transport mechanisms. For
re-searches regarding pollutant dispersion and PM transport behaviors around urban street canopies with different building layouts, some pioneer works like Hanna et al.,22
Cheng et al.,23and Zhang et al.24have only reported the
three-dimensional (3D) canopy airflow patterns of the open and staggered street canopies. Their works did not extend to analyzing PM10/PM2.5/PM1 transport
mecha-nisms in urban street canopies with different building layouts. To fill this gap, the study presented here investi-gates the canopy airflow patterns and PM10/PM2.5/PM1
transport mechanisms in urban street canopies with dif-ferent building layouts under low wind speed conditions. METHODOLOGY
The numerical methodology for investigating PM10/
PM2.5/PM1 transport mechanisms in urban street
cano-pies consists of the 3D Eulerian street-canocano-pies flow model and the 3D Lagrangian particle tracking model. The street-canopies flow model firstly conducts the large eddy simulations (LES) of the Eulerian turbulent flows, in which wind velocities and pressure are obtained by solv-ing the time-dependent Navier–Stokes equations. Next, the particle tracking model adopts the Lagrangian scheme to determine PM trajectories. Finally, the box counting method is used to calculate the canopy-averaged PM10/
PM2.5/PM1mass concentrations at each tracking time by
analyzing the calculated PM trajectories at each time step. 3D Eulerian Street-Canopies Flow Model Because of the rapid advance in computational facilities, microscale CFD has received more and more attention and has successfully been applied to several wind engineering
problems in street canopies.20 –24Generally, a fully
devel-oped turbulent flow within urban street canopies contains eddies of many length scales. The study presented here utilizes LES to investigate the turbulent canopy flow. When LES filtering is applied, large eddies are directly solved in the computational grid and small eddies are filtered out to the subgrid-scale Reynolds stress without being neglected.25,26
The filtered equations of mass and momentum in LES can be expressed in the following:
u¯i xi⫽ 0 (1) u¯i ⫹ u¯iu¯j xj ⫽ ⫺ 1 p¯ xi⫹ xj
冉
共 ⫹ t兲冉
u¯i xj⫹ u¯j xi冊冊
(2) t⫽ 共Cs⌬¯兲2共2S˜ij䡠 S˜ij兲1/2 (3)where uiis the component of filtered instantaneous fluid
velocity in the x1direction, p is air pressure, t is time, is
air density, is air kinematic viscosity, vtis subgrid eddy
viscosity,⌬ ⫽ (⌬x⌬y⌬z)1/3is the filter length scale, and ˜S ij
is the fluid strain rate. In eq 3, Cs, a Smagorinsky constant
usually between 0.1 and 0.2,25 is 0.15 in the study
pre-sented here. The bar “–” is spatial grid filtering. The LES is primarily valid for turbulent core flows (i.e., the flow in the regions somewhat far from walls).25 Thus, the wall
function model27 near the solid boundary and the
non-slip boundary on the wall are adopted as well. The study presented here uses the finite volume method. The nu-merical details can be found in Chang et al.28,29It should
be noted that because solving eqs 1–3 produces the time-dependent velocity, the time-averaged velocity冓ui冔 can be
acquired from the statistic analysis of the instantaneous velocities uiaccording to ui⫽ 冓ui冔 ⫹ ui⬘, where ui⬘ denotes
the component of filtered turbulent velocities.
Three kinds of flow boundary conditions are adopted, including the inflow boundary, outflow boundary, and wall boundary. At the inflow boundary, the inflow veloc-ity is in power-law profile and remains unchanged with time. At the outflow and upper boundaries, the velocity gradient is set to be zero. The non-slip boundary is applied to all building walls, roofs, and ground.
3D Lagrangian Particle Tracking Model In the study presented here, a Lagrangian scheme is se-lected to record all positions of PM transport at each time step. A series of aerial snapshots of the particle movement are used to generate continuous pictures of the trajectory simulations. The PM size range that we focus on is particle diameters less than 10 m (PM10). Under such PM size
range, several particle driving forces have to be consid-ered: the gravitational force FG, the drag force FD, the
Saffman lift force FS, and the Brownian motion force
FB.30 –32The governing equations are
dxiP
dt ⫽ uip (4)
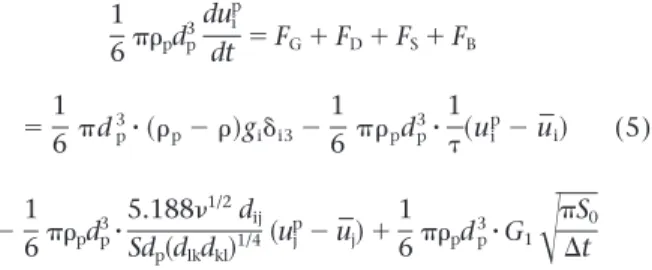
1 6pdp 3dui p dt ⫽ FG⫹ FD⫹ FS⫹ FB ⫽16dp3䡠 共p⫺ 兲gi␦i3⫺ 1 6pdp3䡠 1 共uip⫺ u¯i兲 (5) ⫺16pdp3䡠 5.1881/2d ij Sdp共dlkdkl兲1/4共uj p⫺ u j ¯兲 ⫹1 6pdp3䡠 G1
冑
S0 ⌬t where xip is the coordinate of particles, u i
pis particle
ve-locity,pis particle density, dpis particle diameter, S is the
density ratio between particle and adjacent fluid,␦ is the
unit Kronecker delta function,⌬t is the particle time step, is the relaxation time of the particle,33and d
ij(⫽ (ui,j⫹
uj,i)/2) is the deformation rate tensor. FBsignificantly
af-fects the motion of submicron particles and is simulated as a Gaussian white noise random process with a random variable Gi(zero-mean and unit variance) and an
appro-priate spectral intensity S0.31Each particle trajectory can
be tracked by solving eqs 4 and 5 by using a fourth-order predictor-corrector method. The numerical details can be found in Chang et al.28
For the study presented here, several assumptions are made to simplify the simulation of PM transport process without losing its accuracy. The additional hydrodynamic
Figure 1. (a) Schematic diagram of the matrix of cubes and the measured locations in the experiment of Meinders and Hanjalic.34
Time-averaged velocities and Reynolds stresses (b) in the x direction on the vertical (xy) plane, (c) in the y direction, and (d) in the z direction on the horizontal (xz) plane. The inflow velocity (Ub) is 5 m/sec.
forces (such as virtual mass, Basset, and Faxen) and particle-particle interactions are expected to be small and are ne-glected. The size of particles is defined by the aerodynamic diameter of particles. Airborne particles have no influence on the surrounding airflow field. There is no heat and mass transfer between particles and air. In the transport process, particle coagulation, electrostatic force, and phase change are not considered.
Two types of particle boundary conditions are herein used, namely the trap boundary and the outflow boundary. The trap boundary means that once a particle touches the non-slip surface boundaries such as the ground, roof, or building walls, the particle is trapped and the particle track-ing process is terminated. The outflow boundary is used for the boundaries of the given computational domain. When a particle passes through the outflow boundary, the particle tracking is terminated. It should be noted that, because of
the properties of PM and building surfaces used in this study, the critical velocity33for which bounce will occur if
that velocity is exceeded is larger than the low wind speed condition of 2.5 m/sec herein used. Thus, particle adhesion is a dominant mechanism of particle-surface interaction. This is the reason why we use the trap boundary condition rather than the rebound boundary condition.
Particle Mass Concentration Calculation On the basis of the above calculated instantaneous particle trajectories at each time step, the particle mass concentra-tions can be next calculated by using the box counting method.18For the box counting method, the entire domain
of interest is discretized in control volumes of suitable di-mensions and the particle mass concentration is calculated by counting the mass of the Lagrangian particles in these control volumes. Therefore, this method can obtain the
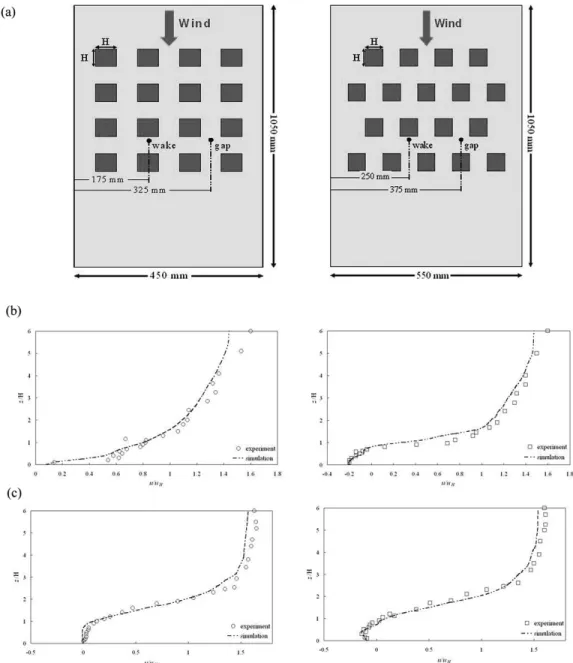
Figure 2. (a) Schematic diagram of the two cubical layouts and the measured locations in the experiment of Macdonald et al.,35 (b)
time-averaged velocities at gap and wake regions of the open street canopies, and (c) time-averaged velocities at gap and wake regions of the staggered street canopies. The inflow velocity uHis 50.5 mm/sec.
average concentrations of these control volumes and trans-port mechanisms at each tracking time. In the study pre-sented here, the entire street canopy is regarded as a single control volume. The canopy-averaged PM10/PM2.5/PM1
mass concentrations at each tracking time can be deter-mined by using the following simple expression:
Cave⫽
MS
V (6)
where MSis the total mass of suspended particles in the
street canopy, and V denotes the volume of the street-canopy domain.
MODEL VERIFICATION
To ensure the reliability of the 3D street-canopies flow model, model verification is first performed by comparison with the reliably measured airflow velocities of Meinders and Hanjalic.34 The outline of the cube array used by
Meinders and Hanjalic is displayed in Figure 1a. A sum of 25 cubes of side length H is placed in the experimental field with the size of 21 H in length, 19 H in width, and 3.4 H in height. The cube configuration consists of five aligned col-umns of five cubes, where each has cube spacing of 3 Hr in the x and z direction. The inflow velocity is 5 m/sec. The corresponding Reynolds number based on the height of the cube is 3,800. The time-averaged velocities and the Reynolds stress profiles at five positions shown in Figure 1a were measured. Figure 1, b– d, shows the comparison with the time-averaged velocities and the Reynolds stresses of the x-direction on the vertical (xy) plane, and the y direction and z direction on the horizontal (xz) plane. The agreement between the numerical results and experimental measure-ment is quite satisfactory.
The study presented here is next validated by the hy-draulic flume experiment of Macdonald et al.35In this
ex-periment, two cubical layouts of the open and staggered array are used as displayed in Figure 2a. The cubic configu-ration comprises 16 cubes for the open cube array and 18 cubes for the staggered cube array. The height of the cubes is the same as the spacing between two adjacent cubes. The power-law velocity profile of u(z)/uH⫽ (z/H)0.29at uH⫽ 50.5
mm/sec is adopted as the velocity of the incoming flow. The airflow velocity profiles at gap and wake for each cube array shown in Figure 2a were measured. Figure 2, b and c, shows the comparison with the time-averaged veloc-ity profiles between the numerical and experimental results at gap and wake for the open and staggered cube array. The numerical results are also in good agreement with the ex-perimental measurement.
DESCRIPTIONS OF NUMERICAL SCENARIO SIMULATIONS
Case Specification
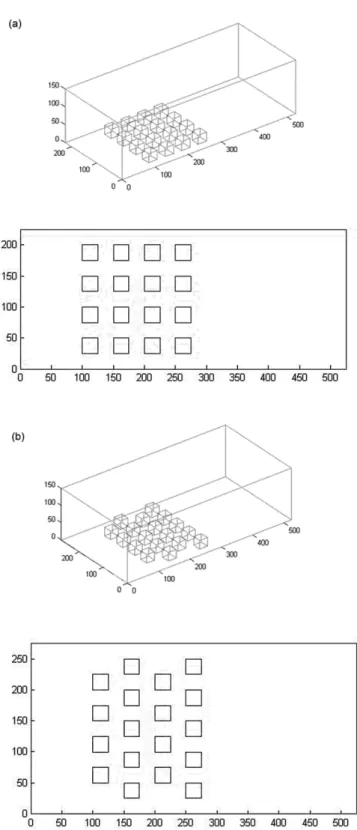
The study case considered in the research presented here is located in Downtown Taipei. Two building layouts com-monly seen in Taipei city (i.e., the open and staggered street canopies) are considered to investigate the effect of different building layouts on PM10/PM2.5/PM1 transport
mecha-nisms. The height of all the buildings (H) is set as 25 m, which is approximately seven to eight stories. The widths of all of the streets are also 25 m. The open and staggered street canopies are the same as the experiment of Macdonald et
al.35with the scale of 500 to 1. The geometrical
configura-tion is displayed in Figure 3. The computaconfigura-tional domain for 3D flow field and particle trajectory tracking is approxi-mately 525⫻ 225 ⫻ 150 m for the open street canopies, and 525⫻ 275 ⫻ 150 m for the staggered street canopies. Fur-thermore, the major interest of the study is to investigate the transport mechanisms of size-dependent PM with different building layouts in urban street canopies. Some simplifica-tions have been made in the numerical simulasimplifica-tions. The
Figure 3.Schematic diagram of the (a) open and (b) staggered street canopies.
isothermal condition with a domain temperature of 20 °C is assumed. The incoming velocity is in power-law profile of u(z)/uH⫽ (z/H)
0.29with a low-wind condition of u
H⫽25m⫽
2.5 m/sec. The perpendicular wind direction to building walls only is considered.
A PM10profile was measured in Downtown Taipei in 2005
under a similar wind condition as the current numerical sim-ulations by using a portable laser dust monitor (Series 1100, Grimm Labortechnik GmbH & Co. KG). The measured PM10,
PM2.5, and PM1mass concentrations are 48.1, 24.4, and 14
g/m3, respectively, which are used as the initial PM 10mass
concentrations. The measured profile, following a lognormal distribution with a geometric mean diameter (GMD) of 1.09 m and a geometric standard deviation (GSD) of 1.27, is adopted as the initial PM10size profile. The profile is separated
into ten size groups from aerodynamic diameter ranging from 0.5 to 10m (see Table 1). The PM concentration is considered as a constant in each size group. The particle mass carried by each sample particle for each size group can be seen in Table 1.29In Figure 4, the initial PM
10is instantaneously released in
the major road, which is situated in the upwind direction of the buildings. Particles are uniformly and statically distributed over the major road space with a volume source of 25⫻ 225 ⫻ 5 m for the open street canopies and 25⫻ 275 ⫻ 5 m for the staggered street canopies. The height of the release (5 m) is determined by the observed fact in the study site that high PM10levels have been observed at the window of the second
floor (⬃5 m high) of the building in front of the major road. The street-canopy domain is defined as 230⫻ 225 ⫻ 30 m (see Figure 4) for the open street canopies, and 230⫻ 275 ⫻ 30 m for the staggered street canopies. The above domains are for the purpose of calculating the canopy-averaged particle mass con-centrations at each tracking minute as shown in eq 6 and the PM10transport mechanisms in Table 2. Three widely used
particle size indexes of PM1, PM2.5, and PM10are determined
by numerically integrating the appropriately weighted mo-ment of the respective particle size group.
Particles are driven into buildings by the incoming wind, resulting in the redistribution of PM concentrations in the open or staggered street canopies. The box counting method is next used to calculate the canopy-averaged mass concentrations at each time step. The time variations of PM10/PM2.5/PM1 canopy-averaged mass concentrations
within the entire street-canopy domain (see Figure 4) can be calculated by using the simulated results of particle trajec-tories together with the average particle concentration equa-tion in eq 6.
It is important to note that in the study presented here, after carrying out the LES procedure for several flow-through
times to ensure that the final time-averaged results are in-dependent of the initial conditions, the time-averaged ve-locities and turbulent statistics are collected over 600 sec. In the Lagrangian particle tracking process, the determination of time step size in the study presented here depends on the particle diameter. The time step is selected as one order smaller than the relaxation time of particles. Six hundred ensembles are undertaken to obtain the ensemble-averaged trajectories for each sample particle at each time step. Sensitivity Analysis of Grid and Particle Number In CFD, the numerical accuracy depends on the numerical schemes, boundary conditions, grid resolutions, etc. Before conducting the numerical simulations of the study case, the grid sensitivity analysis is performed to evaluate the numer-ical discretization errors and the suitable grid density that can reach an acceptable value. Four grid resolution tests from coarse to fine (ranging from 100,000, 300,000, and 500,000 to 1,000,000 grids) are used to establish the grid density necessary to ensure grid-independent solutions. The scaled residual value of 10⫺4is used for all variables. The results show that the solutions are convergent when the grid number exceeds 500,000. Consequently, to reach a balance between adequate numerical accuracy and acceptable com-putation expense, this study uses 500,000 grids to carry out the airflow computation.
In the Lagrangian scheme, the PM mass concentrations are generally determined by the statistical analysis of the trajectories of the particles. By using the abovementioned 500,000 grids, particle number sensitivity analysis is next performed. The study presented here chooses three particle sizes of 10, 5, and 1m diameter to perform the sensitivity analysis for the open and staggered street canopies. For each particle size, four particle numbers of 100, 500, 1000, and 2000 particles are tested. The results show that the more number of particles released, the more stable are the PM mass concentrations. The solutions are convergent as the particle number exceeds 1000. To balance satisfactory nu-merical accuracy and suitable computational time, the op-timal number of the released sample particles for each par-ticle size is 1000. As a result, the total sample parpar-ticles required for the ten size groups in the study presented here is thus 10,000 (see Table 1).
RESULTS AND DISCUSSION
Airflow and Particle Transport between Buildings
The instantaneous and time-averaged airflow velocities of the 500,000 nonuniform grids are obtained by solving eqs
Table 1. Particle mass distributed in each PM size group (10,000 sample particles).
(1) (2) (3) (4) (5) (6) (7) (8) (9) (10)
Size range (m) 0.5–1 1–2 2–3 3–4 4–5 5–6 6–7 7–8 8–9 9–10 Average diameter (m) 1 1.5 2.5 3.5 4.5 5.5 6.5 7.5 8.5 9.5 Open street canopies
Particle mass carried by each sample particle (g) 49.10 24.90 23.04 14.24 11.78 10.74 10.14 9.32 7.94 7.90 Staggered street canopies
Particle mass carried by each sample particle (g) 60.02 30.43 28.16 17.40 14.40 13.13 12.39 11.39 9.70 9.65
Notes: PM1mass concentration⫽ 关total mass of (1)兴/canopy volume; PM2.5mass concentration⫽ 关total mass of (1) ⫹ (2) ⫹ 0.5 ⫻ (3)兴/canopy volume; PM10
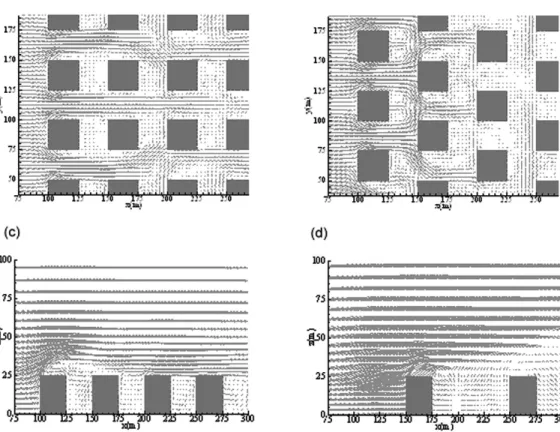
1–3. To demonstrate the airflow characteristics of the open and staggered street canopies, two representative planes at the pedestrian level (z⫽ 1.5 m [xy plane] and y ⫽ 137.5 m [xz plane]), as shown in Figure 5, are chosen to display the airflow patterns of the street canopies. In Figure 5a, for the open street canopies, the incoming flows from the main street are impeded by the first column of the buildings so that the canopy flows go straightforwardly along the streets of the aligned buildings, leading to the strong jet flows in the gap (street) region and the weak eddy flows in the wake region. On the other hand, in Figure 5b, the canopy flows are subject to the blockage of the staggered buildings so that the airflow paths have to skirt around the buildings, result-ing in a pair of counter-rotatresult-ing vortexes in the back of the buildings. In Figure 5, c and d, the airflow pattern of the open street canopies is skimming flows, whereas the airflow pattern of the staggered street canopies looks like wake in-terference flows. Thus, the wake region in the open street canopies receives less air exchange than that in the stag-gered street canopies.
The side-view snapshots of 5-m PM trajectories in the open and staggered street canopies for various particle track-ing times are shown in Figure 6. One can clearly see particle dispersion behaviors in both of the street canopies. For the open street canopies, particles are driven by the unimpeded canopy flows so that particles are straightforwardly moving from the upwind to downwind buildings. In the case of the staggered street canopies, particles are hindered by the
buildings, resulting in more particle deposition on the build-ing walls.
Canopy-Averaged PM10, PM2.5, and PM1Mass
Concentrations
On the basis of the above calculated PM trajectories, the canopy-averaged PM10/PM2.5/PM1 concentrations are
ob-tained by using eq 6. Figure 7 gives the time variations of the canopy-averaged PM10/PM2.5/PM1mass concentrations for
the open and staggered street canopies. In the case of the open street canopies, particles are driven through the unim-peded canopy flows. All of PM10, PM2.5, and PM1 mass
concentrations are substantially reduced because of the large ventilated areas. At the 15th minute of the particle tracking time, almost all of the particles are cleaned out. For the staggered street canopies, the unimpeded canopy airflow only occurs in the first column of the buildings so that good PM removal can only be seen in this area. The rest of the canopy space is poorly ventilated, in which particles are not easily removed, resulting in poor PM removal. Because of the small ventilated areas, all of the PM10, PM2.5, and PM1
mass concentrations cannot be effectively reduced com-pared with the open street canopies. PM10PM2.5, and PM1
mass concentrations are still 23, 28, and 30%, respectively, of the initial concentrations at the 15th minute.
Moreover, it can also be observed from Figure 7 that PM10 mass concentrations in both of the street canopies
quickly decline with time. However, PM2.5and PM1mass Figure 4.Schematic diagram of the initial condition of the instantaneous particle release.
Table 2. PM10transport mechanisms for the open and staggered street canopies (%)
Time (min)
Open Street Canopies Staggered Street Canopies
Escape Wall Deposition Ground Deposition Roof Deposition Escape Wall Deposition Ground Deposition Roof Deposition 1 16.7 5.5 12.6 0.0 5.5 10.8 6.7 0.0 3 25.4 11.7 17.9 0.0 9.7 22.4 10.4 0.0 5 34.3 12.9 21.5 0.0 12.4 35.3 11.3 0.0 7 38.9 14.6 23.0 0.1 12.8 36.2 12.6 0.0 10 45.0 15.9 25.3 0.2 16.4 37.0 13.4 0.2 15 56.3 16.5 26.1 0.3 22.3 38.5 16.3 0.2
concentrations are relatively slowly decreasing. Obviously PM10 is easier to remove compared with PM2.5and PM1.
This result is reasonable because coarse particles (⬎2.5 m), possessing larger inertia and relaxation time to maintain their velocities for longer time duration, are easier to drive out of the street canopies than PM2.5through deposition
and escape mechanisms. On the contrary, PM2.5particles
have smaller inertia and relaxation time, so they are more easily influenced by the complicated airflow patterns within the street canopies such as incoming momentum jets, vari-ous length-scale vortexes, and diverging/converging/circu-lating flows, and are thus trapped in the eddies. This phe-nomenon can result in the accumulation of PM2.5and PM1
within the street canopies rather than PM10.
It is important to note that PM2.5suspended in
street-canopy space is harmful to human health and induces sig-nificant influence on the respiratory system of human be-ings. Therefore, for the purpose of health protection for urban passengers, using PM10 level as the only PM
index is not enough. PM2.5and PM1levels should also
be considered. In Taiwan, air quality is monitored through the Taiwan Area Air Quality Monitoring Network (TAQMN), which comprises 74 stationary automatic air quality monitoring stations and 2 mobile monitoring sta-tions. The hourly PM10 and PM2.5 concentrations are
measured. However, the current air pollution control act revised by the Taiwan Environmental Protection Agency in 2002 only regulates PM10as a 24-hr average (125m/
m3) and 1-yr average (65m/m3) for air quality standards.
Thus, we emphasize the importance of considering PM2.5
and PM1in addition to PM10.
PM10Transport Mechanisms
In the study presented here, the carried particles are redis-tributed along with the canopy flows for the two street canopies. During the PM redistribution process, particles would suspend in the air, settle down on the building roof or the ground, inertially impact or intercept on the building walls, or escape out of the simulated domain. The particle transport mechanisms are usually classified into three parts: suspension, escape, and deposition (including ground, roof, and wall deposition). Herein, deposition and escape are re-garded as the particle removal mechanisms.32 The above
deposition mechanism represents the combined results of inertial impaction, turbulence-eddy impaction, intercep-tion, gravitational sedimentaintercep-tion, and the Brownian mo-tion, which can be thoroughly simulated by the present numerical model.
Table 2 demonstrates the cumulative mass fractions of particle escape, wall deposition, ground deposition, and roof deposition for both of the street canopies. It can be seen from Figure 7 and Table 2 that most particles go along with the unimpeded canopy flow and directly run away from the open street canopies. Particles are effectively removed out of the domain of the street canopies. At the 15th minute of the tracking time, only 1% of PM10is still suspended within the
street canopies, and the remaining 99% of PM10is removed
by escape (56.3%), wall deposition (16.5%), ground deposi-tion (26.1%), and roof deposideposi-tion (0.3%). Obviously, parti-cle escape is the most important removal mechanism com-pared with particle deposition (42.9%). On the other hand, for the staggered street canopies, because of the blockage
Figure 5.Time-averaged velocities at z⫽ 1.5 m for the (a) open and (b) staggered street canopies, and at y ⫽ 137.5 m for the (c) open and (d) staggered street canopies.
effect of the buildings, the incoming airflow paths are hin-dered, resulting in 23% of PM10still being suspended within
the street canopies at the 15th minute. Only 77% of PM10is
removed, in which wall deposition (38.5%) is the major removal mechanism compared with particle escape (22.3%), ground deposition (16.3%), and roof deposition (0.2%). The cumulative mass fraction of deposited particles (55%) is about as 2.5 times as that of escaped particles. In comparing PM transport mechanisms for the two street canopies, it can be found that the effect of different building layouts not only affects the magnitude of PM10/PM2.5/PM1mass
con-centrations, but also changes the particle removal mecha-nisms under the same inflow condition. Therefore, the building layout is indeed an important factor of PM trans-port in urban areas.
On the basis of the above results, the study presented here further compares the initial particle size distribution and the particle size distributions at the 1st, 5th, 10th, and 15th minutes of the tracking time for the two street cano-pies. The GMD and the GSD of the particle size profiles for the open street canopies at the 1st, 5th, 10th, and 15th min are (1.09m, 1.26), (1.07 m, 1.22), (1.01 m, 1.10), and (1.01m, 1.10), respectively; whereas they are (1.09 m, 1.26), (1.08m, 1.24), (1.02 m, 1.10), and (1.01 m, 1.10),
respectively, for the staggered street canopies. In compari-son with the initial condition of (1.09m, 1.27), both of the flow patterns of the two street canopies lead to the apparent shift of the particle size distributions towards smaller size and less deviation during the particle tracking process. The open street canopies having higher PM removal ability would result in a swifter shift. In addition, it can be inferred from the above results that, because of the shift of the particle size distribution towards smaller size, PM10is much
easier to remove than finer particles like PM2.5and PM1for
the two street canopies. It should be noted that, because of the measurement limitation of the portable laser dust mon-itor herein used, the study presented here considers aerody-namic diameters ranging only from 0.5 to 10m. As shown in Table 1, there is only one size group of PM1 in the
calculation, which thus provides limited information on PM1. Further study on PM1is desirable.
Finally, in addition to building layouts, PM10/PM2.5/
PM1transport behaviors and mechanisms in urban areas are
also affected by inflow conditions, building geometry, and traffic conditions. Further extensive work investigating the effects of the above various factors individually will be use-ful. In addition, the results of modeling mean and turbulent characteristics of the flow in the study presented here were
Figure 6.PM transport trajectories in the (a– e) open and (f–j) staggered street canopies at the (a and f) 1st, (b and g) 3rd, (c and h) 5th, (d and i) 10th, and (e and j) 15th min of tracking time.
validated upon data of the wind tunnel experiments, but the results of particle transport calculations were not validated. The real atmospheric conditions in urban streets are more complicated than our study cases. It is hoped that the study presented here can be a stimulus for experimenters to conduct additional laboratory and field experiments and to compare their findings with our numerical results.
CONCLUSIONS
On the basis of the simulated results, the research pre-sented here has led to the following conclusions:
(1) A size-dependent PM transport model, adopting the Eulerian LES of turbulent flow and the Lagrangian particle trajectory tracking, has been verified by the reliable experimental measurement. It is an effec-tive method to investigate the complicated canopy flow patterns and PM10/PM2.5/PM1transport
mech-anisms in the street canopies.
(2) For the open street canopies, particles are effectively driven by unimpeded canopy flows from the up-wind to downup-wind buildings. All PM10, PM2.5, and
PM1mass concentrations are substantially reduced.
However, in the case of the staggered street
canopies, the unimpeded canopy airflow only oc-curs in the first column of the buildings. All PM10,
PM2.5, and PM1 removals are less effective. As a
result, the open street canopies having higher PM removal ability lead to a swifter shift of the par-ticle size distributions towards smaller size and less deviation than the staggered street canopies. (3) Whether in the open or staggered street canopies, PM10 is easier to remove compared with PM2.5
and PM1. This phenomenon is responsible for the
fact that fine particles are more influenced by the canopy airflows, resulting in more accumulation of PM2.5 and PM1 within urban street canopies
than PM10. Thus, from the purpose of health
pro-tection for urban passengers, using PM10level as
the only PM index is not enough. PM2.5and PM1
levels should also be considered.
(4) Particle escape is the most important removal mechanism for the open street canopies, whereas wall deposition is the major removal mechanism for the staggered street canopies.
ACKNOWLEDGMENTS
The authors gratefully acknowledge support of this work by a 3-yr project of the National Science Council, Taiwan, Republic of China, under Grant Nos. NSC 95-2625-Z-002-025, 96-2625-Z-002-014, and 97-2625-M-002-003. REFERENCES
1. Pope, C.; Burnett, R.; Thun, M.; Calle, E.; Krewski, D.; Ito, K.; Thurston, G. Lung Cancer, Cardio-Pulmonary Mortality, and Long-Term Expo-sure to Fine Particulate Air Pollution; J. Am. Med. Assoc. 2002, 287, 1132-1141.
2. Penttinen, P.; Timonen, K.L.; Tiittanen, P.; Mirme, A.; Ruuskanen, J.; Pekkanen, J. Ultrafine Particles in Urban Air and Respiratory Health among Adult Asthmatics; Eur. Respir. J. 2001, 17, 428-435.
3. Dockery, D.W.; Pope, C.A. Acute Respiratory Effects of Particulate Air Pollution; Ann. Rev. Pub. Health 1994, 15, 107-132.
4. Anderson, P.J.; Wilson, J.D.; Hiller, F.C. Respiratory Tract Deposition of Ultrafine Particles in Subjects with Obstructive or Restrictive Lung Disease; Chest 1990, 97, 1115-1120.
5. Harrison, R.M.; Yin, J. Particulate Matter in the Atmosphere: Which Particle Properties are Important for Its Effects on Health?; Sci. Total
Environ. 2000, 249, 85-101.
6. Hitchins, J.; Morawska, D.; Gilbert, D.; Jamriska, M. Dispersion of Particles from Vehicle Emission around High- and Low-Rise Buildings;
Indoor Air 2002, 12, 64-71.
7. Berkowicz, R. Using Measurements of Air Pollution in Streets for Eval-uation of Urban Air Quality-Meteorological Analysis and Model Cal-culations; Sci. Total Environ. 1996, 189/190, 259-265.
8. Xie, S.; Zhang, Y.; Qi, L.; Tang, X. Spatial Distribution of Traffic-Related Pollutant Concentrations in Street Canyons; Atmos. Environ.
2003, 37, 3213-3224.
9. Sagrado, A.P.G.; Beeck, J.V.; Rambaud, P.; Olivari, D. Numerical and Experimental Modeling of Pollutant Dispersion in a Street Canyon; J.
Wind Engineer. Indust. Aerodynam. 2002, 90, 321-339.
10. Ahmad, K.; Khare, M.; Chaudhry, K.K. Wind Tunnel Simulation Stud-ies on Dispersion at Urban Street Canyons and Intersections—a Re-view; J. Wind Engineer. Indust. Aerodynam. 2005, 93, 697-717. 11. Mfula, A.M.; Kukadia, R.F.; Griffiths, R.F.; Hall, D.J. Wind Tunnel
Modeling of Urban Building Exposure to Outdoor Pollution; Atmos.
Environ. 2005, 39, 2737-2745.
12. Walton, A.; Cheng, A.Y.S. Large-Eddy Simulation of Pollution Disper-sion in an Urban Street Canyon. Part II: Idealized Canyon Simulation;
Atmos. Environ. 2002, 36, 3615-3627.
13. Walton, A.; Cheng, A.Y.S.; Yeung, W.C. Large-Eddy Simulation of Pollution Dispersion in an Urban Street Canyon. Part I: Comparison with Field Data; Atmos. Environ. 2002, 36, 3601-3613.
14. Caton, F.; Britter, R.E.; Dalziel, S. Dispersion Mechanisms in a Street Canyon; Atmos. Environ. 2003, 37, 693-702.
15. Lee, I.Y.; Park, H.M. Parameterization of the Pollutant Transport and Dispersion in Urban Street Canyons; Atmos. Environ. 1994, 28, 2343-2394.
16. So, E.S.P.; Chan, A.T.Y.; Wong, A.Y.T. Large-Eddy Simulations of Wind Flow and Pollutant Dispersion in a Street Canyon; Atmos. Environ.
2005, 39, 3573-3582.
17. Xie, X.; Huang, Z.; Wang, J.; Xie, Z. The Impact of Solar Radiation and Street Layout on Pollutant Dispersion in Street Canyon; Atmos.
Envi-ron. 2005, 40, 201-212.
18. Xia, J.Y.; Leung, D.Y.C. Pollutant Dispersion in Urban Street Canopies;
Atmos. Environ. 2001, 35, 2033-2043.
19. Chang, T.J.; Wu, Y.T. Wind-Driven Rain Distributions around Street Canopies; J. Am. Water Res. Assoc. 2003, 39, 545-562.
20. Liu, C.; Ahmadi, G. Computer Simulation of Pollutant Transport and Deposition near Peace Bridge; Particulate Sci. Technol. 2005, 23, 109-127. 21. Ahmadi, G.; Li, A. Computer Simulation of Particle Transport and Deposition near a Small Isolated Building; J. Wind Engineer. Indust.
Aerodynam. 2000, 84, 23-46.
22. Hanna, S.R.; Tehranian, S.; Carissimo, B.; Macdonald, R.W. Compar-isons of Model Simulations with Observations of Mean Flow and Turbulence within Simple Obstacle Arrays; Atmos. Environ. 2002, 36, 5067-5079.
23. Cheng, Y.; Lien, F.S.; Yee, E.; Sinclair, R. A Comparison of Large Eddy Simulations with a Standard k-εReynolds-Averaged Navier-Stokes Model for the Prediction of a Fully Developed Turbulent Flow over a Matrix of Cubes; J. Wind Engineer. Indust. Aerodynam. 2003, 91, 1301-1328. 24. Zhang, A.; Gao, C.; Zhang, L. Numerical Simulation of the Wind Field
Around Different Building Arrangements; J. Wind Engineer. Indust.
Aerodynam. 2005, 93, 891-904.
25. Ferziger, J.H.; Peric, M. Computational Methods for Fluid Dynamics, 3rd ed.; Springer: Berlin, 2002.
26. Smagorinsky, J. General Circulation Experiments with the Primitive Equations. I. The Basic Experiment; Mon. Weather Rev. 1963, 91, 99-164.
27. Ciofalo, M. Large-Eddy Simulations of Turbulent Flow with Heat Transfer in Simple and Complex Geometries Using Harwell-Flow3D;
Appl. Math. Model. 1996, 20, 262-271.
28. Chang, T.J.; Hsieh, Y.F.; Kao, H.M. Numerical Investigation of Airflow Pattern and Particulate Matter Transport in Naturally Ventilated Multi-Room Buildings; Indoor Air 2006, 16, 136-152.
29. Chang, T.J.; Kao, H.M.; Hsieh, Y.F. Numerical Study of the Effect of Ventilation Pattern on Coarse, Fine, and Very Fine Particulate Matter Removal in Partitioned Indoor Environment; J. Air & Waste Manage.
Assoc. 2007, 57, 179-189.
30. Chang, T.J.; Yen, B.C. Gravitational Fall Velocity of Sphere in Viscous Fluid; J. Engineer. Mech. ASCE 1998, 124, 1193-1199.
31. Li, A.; Ahmadi, G. Dispersion and Deposition of Spherical Particles From Point Sources in a Turbulent Channel Flow; Aerosol Sci. Technol.
1992, 16, 209-226.
32. Chang, T.J.; Hu, T.S. Transport Mechanism of Airborne Particulate Matter in Partitioned Indoor Environment; Building & Environ. 2008,
43, 886-895.
33. Hinds, W.C. Aerosol Technology: Properties, Behavior, and Measurement of
Airborne Particles, 2nd ed.; John Wiley & Sons: New York, 1999.
34. Meinders, E.R.; Hanjalic, K. Vortex Structure and Heat Transfer in Turbulent Flows over Wall-Mounted Matrix of Cubes; Int. J. Heat Fluid
Flow 1999, 20, 255-267.
35. Macdonald, R.W.; Carter, S.; Slawson, P.R. Measurements of Mean
Ve-locity and Turbulence Statistics in Simple Obstacle Arrays at 1:200 Scale;
Thermal Fluids Report 2000-1; Department of Mechanical Engineer-ing; University of Waterloo: Waterloo, Ontario, Canada, 2000.
About the Authors
Tsang-Jung Chang is a professor in the Department of Bio-environmental Systems Engineering, National Taiwan Univer-sity, Taipei, Taiwan, Republic of China. Hong-Ming Kao is a Ph.D. student and Yu-Ting Wu and Wei-Hua Huang are former graduate students in the same department. Yu-Ting Wu is currently a Ph.D. student in the Department of Civil Engineering, University of Minnesota, Minneapolis, MN. Wei-Hua Huang is an engineer in Taiwan Semiconductor Manufacturing Co. Ltd., Hsinchu, Taiwan. Please address correspondence to: Tsang-Jung Chang, Department of Bioenvironmental Systems Engineering, National Taiwan University, 1, Section 4, Roosevelt Road, Taipei 106, Taiwan, Republic of China; phone: ⫹886-2-23622977; fax:⫹886-2-23635854; e-mail: tjchang@ntu.edu.tw.