行政院國家科學委員會專題研究計畫 成果報告
動態對比劑顯影與顯微磁振造影影像在乳癌顯微循環及血
管新生性之研究(2/2)
計畫類別: 個別型計畫 計畫編號: NSC91-2314-B-002-234- 執行期間: 91 年 08 月 01 日至 92 年 10 月 31 日 執行單位: 國立臺灣大學醫學院放射線科 計畫主持人: 張允中 計畫參與人員: 黃俊升, 陳志宏, 曾文毅, 嚴逸芬 報告類型: 完整報告 處理方式: 本計畫可公開查詢中 華 民 國 93 年 2 月 16 日
行政院國家科學委員會補助專題研究計畫
■ 成 果 報 告
□期中進度報告
動態對比劑顯影與顯微磁振造影影像
在乳癌顯微循環及血管新生性之研究(2/2)
Dynamic Contrast-enhanced and Microscopic MR imaging for
Microcirculation and Angiogenesis of Breast Cancer (2/2)
計畫類別:
■
個別型計畫 □ 整合型計畫
計畫編號:NSC 91 - 2314 - B - 002 - 234
執行期間:91 年 8 月 1 日至 92 年 10 月 31 (延) 日
計畫主持人:
張允中
共同主持人:黃俊升
曾文毅
陳志宏
嚴逸芬
計畫參與人員:
成果報告類型(依經費核定清單規定繳交):□精簡報告
■
完整報告
本成果報告包括以下應繳交之附件:
□赴國外出差或研習心得報告一份
□赴大陸地區出差或研習心得報告一份
■
出席國際學術會議心得報告及發表之論文各一份
□國際合作研究計畫國外研究報告書一份
處理方式:除產學合作研究計畫、提升產業技術及人才培育研究計畫、列管
計畫及下列情形者外,得立即公開查詢
□涉及專利或其他智慧財產權,□一年□二年後可公開查詢
執行單位:
放射線科
中 華 民 國 93 年 2 月 13 日
(二)中、英文摘要及關鍵詞(keywords)。 Abstract
During the second-year project, magnetic resonance (MR) angiogenetic parameters derived from dynamic contrast enhanced (DCE) MRI was applied to the whole tumor.
We evaluated angiogenic compositions and tumor response in the course of neoadjuvant chemotherapy in patients with locally advanced breast cancer (LABC) using DCE MRI. Thirteen patients with LABC underwent serial DCE MRI (61 MR studies) during the course of chemotherapy. DCE MRI was quantified using a two-compartment model at pixel-by-pixel basis. Analysis of
parametric histograms of amplitude, exchange rate kout and peak enhancement over the whole tumor
was performed. The distribution patterns of histograms were correlated with the tumor response. Initial kurtosis and standard deviation of amplitude before chemotherapy correlated with tumor response. Comparing the initial values with the values after the first course of chemotherapy, tumor response was associated with decrease in standard deviation of amplitude, and increase in kurtosis and decrease in standard deviation of kout. Comparing the initial values with the values after completing the
chemotherapy, tumors with better response were associated with increase in kurtosis (r2=0.39), decrease in mean (r2=0.71) and standard deviation (r2=0.59) of amplitude, and decrease in mean of peak enhancement (r2=0.50).
Our results suggested that tumors with better response tended to alter their internal compositions from heterogeneous to homogeneous distributions and to decrease in peak enhancement after
chemotherapy. Serial analyses of parametric histograms of DCE MRI-derived angiogenic parameters can monitor the response of angiogenic compositions of a tumor throughout the course of
chemotherapy, and is capable of predicting tumor response early in the course. Keywords: magnetic resonance image, breast, chemotherapy
中文摘要
本研究第二年計劃,使用由磁振造影動態顯影衍生之血管新生性參數於整個乳房腫瘤之分 析。我們評估局部侵襲性乳癌在化學治療當中以動態顯影磁振造影所獲相關血管新生性組成及 腫瘤反應。在本研究中總共包含 13 個病患,接受了 61 次磁振造影檢查。所獲得之資料使用二
隔間模式以像素為基礎加以分析。而整個腫瘤參數組織圖之分析包括輻度(amplitude)、交換速
率(exchange rate, Kout)及最高顯影。腫瘤治療之反應與參數組織圖之分佈情況加以比較。我們
發現初次檢查獲得輻度之 Kurtosis 及標準差與腫瘤反應相關,比較接受完第一次化學治療與初 次化學治療前之參數值,我們發現腫瘤反應與輻度標準差下降,交換速率 Kout的 Kurtosis 增加 與 Kout標準差之下降有關,而完成化學治療與初次化學治療前之比較,結果顯示輻度分佈之 Kurtosis 增加(r2 = 0.39)、平均值下降(r2 = 0.71)、標準差下降(r2 = 0.59)及最高顯影之平均 值下降(r2 = 0.50)與腫瘤反應有關。 我們的研究結果顯示有較佳腫瘤治療反應者通常在治療中其內在組成會由較不均勻變為較 均勻之分佈,而最高顯影之強度亦會在治療後下降,系列參數組織圖之分析可以監測在整個化 學治療過程中血管新生性組成之變化,而且可以於治療早期預測腫瘤反應。 關鍵字:磁振造影、乳房、化學治療
(三)報告內容:請包括前言、研究目的、文獻探討、研究方法、結果與討論(含結論與建議)… 等。
Materials and methods 1. Patient recruitment
(1) Thirteen patients (50.92 ±7.95 years of age) of LABC who fulfilled the criterion of tumor staging as T3 or T4 according to American Joint Committee on Cancer (AJCC) were enrolled in our study. None of these patients had distant metastasis before initiating neoadjuvant chemotherapy. All patients received at least 3 serial breast MR studies at the following time points: before receiving incision biopsy and initiating chemotherapy, following completion of the first course of
chemotherapy, and before final surgical tumor resection (n= 8) or core biopsy (n= 5).
(2) All of the 13 cases received incision biopsy after completing the first MR study of breasts. Twelve cases were invasive ductal carcinoma and one case was invasive lobular carcinoma.
(3) The chemotherapy regimens included CEF (cyclophosphamide, epirubicin, fluorouracil) in 3 patients; palcitaxel plus cisplatin in 3 patients; weekly docetaxel plus oral UFUR (tegafur/uracil) in 6 patients, in which three of them received AC (doxorubicin, cyclophophamide) later due to
unsatisfied response of docetaxel treatment; and vinorelbin plus weekly high dose 5-flurouracil/leucovorin 24 hours infusion in one patient.
(4) Patients were followed for 15±6.9 months (median 13 months) after completing their final MRI scan.
2. MR technique and protocol of dynamic enhancement
(1) Dynamic enhancement of MRI for bilateral breasts was performed in a 1.5T superconductive MR scanner (Sonata, Siemens, Erlangen, Germany) with dedicated breast coils. Patients were prone in position and received intravenous bolus injection of the contrast medium
(Gadonilium-diethyltriaminepentaacetic acid, Gd-DTPA, with the dose of 2 mmole/kg) at the rate of 4 ml per second via automatic injector (Optistar MR injector, Mallinckrodt, MO, USA). (2) A rapid scanning with 3D fast low angle shot (FLASH) pulse sequence coupled with elliptical
scanning technique and partial Fourier acquisition were performed. Scan parameters were TE/TR = 3.1/12ms, flip angle =25 degrees, field of view = 110 mm × 320 to 360 mm, image matrix =
176×512, slice thickness= 4-5 mm, no gap, 30 slices, 14 seconds per acquisition, and total 46-50 acquisitions. The parameter setting resulted in a pixel resolution of approximately 625-700 µm. Both breasts were covered in dynamic study for the possibility of detecting multifocal or bilateral breast cancers in our patients. Bolus injection was started at the fourth acquisition in order to achieve steady state of magnetization and to avoid flow-related enhancement.
3. Analysis of dynamic MR data
(1) Time-intensity curves obtained from DCE MRI were analyzed at pixel-by-pixel basis with a two-compartmental model proposed by Brix et al. (Brix et al 1991). Two angiogenic parameters, namely, amplitude and redistribution rate constant (kout), were determined by fitting the
redistribution rate constant (kout) represents the exchange rate of contrast agent between the
intravascular and extravascular extracellular space (Buckley et al 1994, Knopp et al 1999). Color maps of amplitude and kout were generated for all imaging slices. We defined the tumor margin by
manually tracing the subtraction images of dynamic enhancement showing best margin of the tumor. Total tumor volume was determined by summing the traced tumor volumes over all slices. Tumor response, defined as the ratio of the tumor volume at the final MRI scan to the tumor volume at the first scan, was then computed. Data analysis was performed with Matlab 6.1
(MathWorks Inc., Natick, MA, USA) and Mathematica 4.1 (Wolfram Media, Inc., Cahmpaign, IL, USA).
(2) Histograms of DCE MRI-derived angiogenic parameters of the whole tumor, including amplitude, kout and peak enhancement were also obtained. To describe distribution patterns of tumor
compositions, we calculated statistical indices including mean, standard deviation, skewness and kurtosis from the histograms of each angiogenic parameters.
結果與討論 Results
(1) There were 61 MR studies in total with the minimum of 3 studies for each case. The interval between the first and final MR studies was 4.88±2.87 months.
(2) There were eight cases with tumor reduction more than 50% of initial tumor volume (responders) and five with tumor reduction less than 50% of initial tumor volume (nonresponders). The tumor size was 188.88±140.54 ml before chemotherapy and was 70.27±73.90 ml after completing the course of chemotherapy.
(3) Color maps of amplitude showed that better tumor response was marked by a change from
heterogeneous to homogeneous tumor compositions and decrease in peak enhancement. In contrast, there was little perceptible change of internal tumor compositions in the non-responders. In the responders, the histograms of amplitude showed progressive decrease and left shift of the peak and narrowing of the base. Such change was not observed in the histograms of kout or histograms of
both amplitude and kout in the nonresponders.
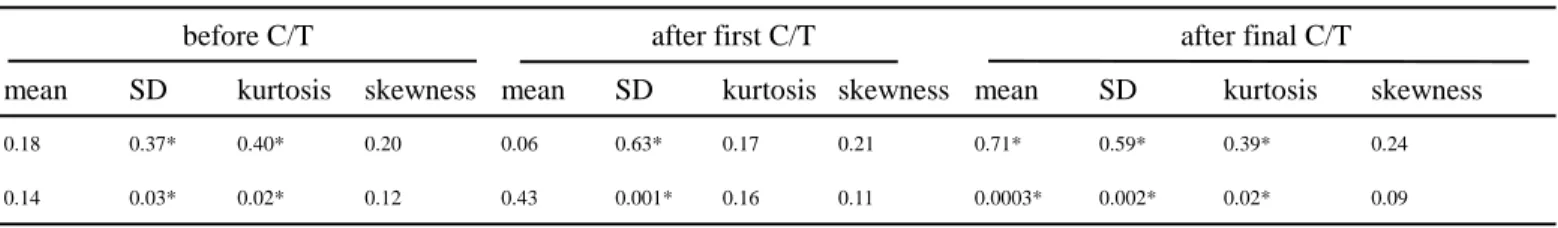
(4) As listed in Table 1, kurtosis and standard deviation of amplitude before chemotherapy correlated with tumor response, (r2=0.40 and r2=0.37, respectively). After the first course of chemotherapy the changes in standard deviation of amplitude, and in kurtosis and standard deviation of kout
correlated with tumor response (r2=0.63, 0.33 and 0.33, respectively). In comparing the final preoperative MRI study with the initial study, better tumor response was indicated by significant change in amplitude, showing increase in kurtosis (r2=0.39), decrease in mean (r2=0.71) and decrease in standard deviation (r2=0.59), and in peak enhancement showing decrease in mean (r2=0.50).
Discussion
(1) In this study, we analyzed signal time curves at pixel by pixel basis over bilateral whole breasts. This approach allowed complete mapping of tumor angiogenic compositions and facilitated visual
perception of tumor response to chemotherapy. We further characterized tumor heterogeneity in terms of histograms of angiogenic parameters. Using this metric we found that tumor heterogeneity in LABC was associated with tumor response to neoadjuvant chemotherapy.
(2) Neoadjuvant chemotherapy of LABC can result in satisfactory local control, and even increased overall survival, especially in patients with a complete clinical or histopathological response (Eltahir et
al 1998). Mammography has been widely accepted as an important tool in detecting breast cancer but
play a limited role in assessing the response of breast cancer to neoadjuvant chemotherapy. Its efficacy is even inferior to physical palpation in patients with dense breasts (Vinnicombe et al 1996, Weatherall
et al 2001). Although serial biopsy during neoadjuvant chemotherapy provides a window to observe
tumor response over time, small amount of tissue specimen is subjected to sampling bias in tumors with heterogeneous internal compositions. Recent studies also showed that DCE MRI is potentially useful in assessing tumor response to neoadjuvant chemotherapy (Abraham et al 1996, Rieber et al (1997, 2000), Wasser et al 2003, Delille et al 2003). It has been demonstrated that kinetics of
Gd-DTPA uptake is contributed from microvessel density (MVD), vessel size and permeability (Buada
et al 1996, Carriero et al 2002, Hulka et al 1997). To better explain kinetics of Gd-DTPA uptake, a
pharmacokinetic two-compartment model was proposed to characterize time intensity curves in terms of amplitude, reditribution rate constant (kout) (Knopp et al 1999, Brix et al 1991, Buckley et al 1994).
In this model, amplitude was related to MVD, and exchange rate kout was related to vascular
permeability that was proportional to vascular endothelial growth factor (VEGF) (Knopp et al 1999). Pixel-by-pixel analysis of Gd-DTPA uptake time curves not only improves the specificity of diagnosis, it can produce parametric images that provide information about tumor heterogeneity, permeability and vascularity (Mussurakis et al 1997). DCE MRI is a useful tool to monitor the response of tumor angiogenesis and tailor the choice of therapeutic regimens for patients with LABC.
(3) Most of the DCE MRI studies analyzed averaged signal time curves from a tumor region in a single slice. However, this approach cannot indicate the heterogeneity of tumor compositions that may be one of the key factors affecting tumor response to chemotherapy. In our study, we compared the final tumor response with the dynamics of angiogenic compositions during serial neoadjuvant
chemotherapy. Better tumor response was associated with a larger change of tumor compositions from heterogeneous to homogeneous distributions, and larger decrement of peak enhancement over the whole tumor. Before chemotherapy, lower kurtosis and higher standard deviation of amplitude correlated with better tumor response (r2=0.40 and r2=0.37, respectively). After the first course of chemotherapy, better responders showed larger decrease of standard deviation of amplitude, larger increase of kurtosis and decrease of standard deviation of kout. In the final MR study, better responders
showed larger increase of kurtosis, decrease of mean and standard deviation of amplitude and decrease of mean of peak enhancement. Our results suggest that the change in internal compositions may arise from different susceptibility of individual compositions to chemotherapy. Particularly, compositions with higher amplitude may be more susceptible to chemotherapy.
(4) A recent study by Wasser et al. revealed the potential capability of DCE MRI to assess therapeutic effects of neoadjuvant chemotherapy in breast cancer (Wasser et al 2003). Furthermore, a reduction of tumor size after chemotherapy was associated with a decrease of both kep (equivalent to kout) (Padhani
and Husband 2001) and amplitude, where kep was a more sensitive indicator that began to drop right
after the first cycle of chemotherapy. On the other hand, reduction of contrast enhancement was not a sign of tumor responsiveness (Wasser et al 2003). In our study, tumors with better response were more heterogeneous in the histograms of amplitude before chemotherapy (table 1). Histograms of kout
showed increased kurtosis and decreased standard deviation after the first course of chemotherapy. These findings suggest that compositions of tumor angiogenesis become more homogenous under effective chemotherapy. However, we did not find significant decrease in the mean values of kout or
amplitude. The disparity of this result from the previous study might be related to variable
chemotherapy regimens employed in our study. Comparing with amplitude, we found that the response of kout was rather inconsistent, suggesting that kout might respond differently to different chemotherapy
regimens.
(5) In conclusion, we demonstrated the usefulness of parametric histograms derived from DCE MRI to characterize heterogeneity of tumor compositions and to study the response of tumor angiogenesis to neoadjuvant chemotherapy. Using this method, in-vivo angiogenic compositions of the whole breast tumor mass can be monitored by serial MRI studies during the whole course of neoadjuvant
chemotherapy. This method will be clinically useful in understanding pathophysiologic changes, predicting tumor response and guiding therapeutic approach.
References
Abraham D C, Jones R C, Jones S E, Cheek J H, Peter G N, Knox S M, Grant M D, Hampe D W, Savino D A and Harms S E 1996 Evaluation of neoadjuvant chemotherapeutic response of locally advanced breast cancer by magnetic resonance imaging Cancer 78 91-100
Boetes C, Mus R, Holland R, Barentsz J O, Strijk S P, Wobbes T, Hendriks J H, and Ruys S H 1995 Breast tumors: comparative accuracy of MR imaging relative to mammography and US for demonstrating extent Radiology 197 743-747
Brix G, Semmler W, Port R, Schad L R, Layer G and Lorenz W J 1991 Pharmacokinetic parameters in CNS Gd-DTPA enhanced MR imaging J. Comput. Assist. Tomogr. 15 621-628
Buadu L D, Murakami J, Murayama S, Hashiguchi N, Sakai S, Masuda M, Toyoshima S, Kuroki S and Ohno S 1996 Breast lesions: correlation of contrast medium enhancement patterns on MR images with histopathologic findings and tumor angiogenesis Radiology 200 639-647
Buckley D L, Kerslake R W, Blackband S J, Horsman A 1994 Quantitative analysis of multi-slice Gd-DTPA enhanced dynamic MR imaging using an automated simplex minimization procedure
Magn. Reson. Med. 32 646-651
Carriero A, Ambrossini R, Mattei P A, Angelucci D and Bonoma L 2002 Magnetic resonance of the breast: correlation between enhancement patterns and microvessel density in malignant tumors J.
Exp. Clin. Cancer Res. 21(S3) 83-87
Chie W C, Chang S H, Huang C S, Tzeng S J, Chen J H, Fan B Y and Chang K J 2002 Prognostic factors for the survival of Taiwanese breast cancer patients J. Formos. Med. Assoc. 101 98-103
Cleator S, Parton M and Dowsett M 2002 The biology of neoadjuvant chemotherapy for breast cancer
Endocrine-related Cancer 9 183-195
Delille J P, Slanetz P J, Yeh E D, Halpern E F, Kopans D B, Garrido L 2003 Invasive ductal breast carcinoma response to neoadjuvant chemotherapy: noninvasive monitoring with functional MR imaging- pilot study. Radiology 228 63-69
Ellis P A, Smith I E, McCarthy K, Detre S, Salter J and Dowsett M 1997 Preoperative chemotherapy induces apoptosis in early breast cancer Lancet 349 849
Eltahir A, Heys S D, Hutcheon A W, Starkar T K, Smith I, Walker LG, Ah-See A K and Eremin O 1998 Treatment of large and locally advanced breast cancer using neoadjuvant chemotherapy Am. J. Surg. 175 127-132
Fischer U, Kopla L and Grabbe E 1999 Breast carcinoma: effect of preoperative contrast-enhanced MR imaging on the therapeutic approach Radiology 213 881-888
Gilles R, Guinebretière J M, Toussaint C, Spielman M, Rietjens M, Petit J Y, Contesso G, Masselot J and Vanel D 1994 Locally advanced breast cancer: contrast-enhanced subtraction MR imaging of response to preoperative chemotherapy Radiology 191 633-638
Heys S D, Eremin J M, Sarkar T K, Hutcheon A W, Ah-See A, Eremin O 1994 Role of multimodality therapy in the management of locally advanced carcinoma of the breast J. Am. Coll. Surg. 179 493-504
Hulka C A, Edmister W B, Smith B L, Tan L, Sgroi D C, Campbell T, Kopans D B and Weisskoff R M 1997 Dynamic echo-planar imaging of the breast: experience in diagnosing breast carcinoma and correlation with tumor angiogenesis Radiology 205 837-842
Knopp M V, Weiss E, Sinn H P, Mattern J, Junkermann H, Radeleff J, Magener A, Brix G, Delorme S, Zuna I and van Kaick G 1999 Pathophysiologic basis of contrast enhancement in breast tumors J.
Magn. Reson. Imaging 10 260-266
Koning C and Hart G 1998 Long-term follow-up of a randomized trial on adjuvant chemotherapy and hormonal therapy in locally advanced breast cancer Int. J. Radiation Oncology Biol. Phys. 41 397-400
Kuhl C K, Mielcareck P, Klaschik S, Leutner C, Wardelmann E, Gieseke J, Schild H H 1999 Dynamic breast MR imaging: are signal intensity time course data useful for differential diagnosis of
enhancing lesions? Radiology 211 101-110
Mumtaz H, Hall-Craggs M, Davidson T, Walmsley K, Thurell W, Kissin M W and Taylor I 1997 Staging of symptomatic primary breast cancer with MR imaging Am. J. Roentgenol. 169 417-424 Mussurakis S, Buckley D L, Drew P J, Fox J N, Carleton P J, Turnbull L W, Horsman A 1997
Dynamic MR imaging of the breast combined with analysis of contrast agent kinetics in the differentiation of primary breast tumors Clin. Radiol. 52 516-526
Padhani A R and Husband J E 2001 Dynamic contrast-enhanced MRI studies in oncology with an emphasis on quantification, validation and human studies Clin. Radiol. 56 607-620
Pierce L, Adler D, Helvie M, Lichter A and Merajver S 1996 The use of mammography in breast preservation in locally advanced breast cancer Int. J. Radiation Oncology Biol. Phys. 34 571-577
Rieber A, Zeitler H, Rosenthal H, Görich J, Kreienberg R, Brambs H J and Tomczak R 1997 MRI of breast cancer: influence of chemotherapy on sensitivity Br. J. Radiol. 70 452-458
Rieber A, Brambs H J, Gabelmann A, Heilmann V, Kreienberg R and Kühn T 2002 Breast MRI for monitoring response of primary breast cancer to neo-adjuvant chemotherapy Eur Radiol 12 1711-1719
Rodenko G N, Harms S E, Pruneda J M, Farrell Jr R S, Evans W P, Copit D S, Krakos P A and FlamigD P 1996 MR imaging in the management before surgery of lobular carcinoma of the breast: correlation with pathology Am. J. Roentgenol. 167 1415-1419
Tabar L, Yen M F, Vitak B, Chen H H, Smith R A. Duffy S W 2003 Mammography service screening and mortality in breast cancer patients: 20-year follow-up before and after introduction of screening
Lancet 361(9367) 1405-1410
Taylor J S, Tofts P S, Phil D, Port R, Evelhoch J L, Knopp M, Reddick W E, Runge V M and Mayr N 1999 MR imaging of tumor microcirculation: promise for the new millennium J. Magn. Reson.
Imaging 10 903-907
Tofts P S, Berkowitz B and Schnall M 1995 Quantitative analysis of dynamic Gd-DTPA enhancement in breast tumors using a permeability model Magn. Reson. Med. 33 564-568
Vinnicombe S, MarVocar A D, Guy R L, Sloane J P, Powles T J, Knee G and Husband J E 1996 Primary breast cancer: mammographic changes after neoadjuvant chemotherapy with pathologic correlation Radiology 198 333-340
Wasser K, Klein S K, Fink C, Junkermann H, Sinn H P, Zuna I, Knopp M V and Delorme S 2003 Evaluation of neoadjuvant chemotherapeutic response of breast cancer using dynamic MR with high spatial temporal resolution Eur. Radiol. 13 80-87
Weatherall P T, Evans G F, Metzger G J, Saborrian M H and Leitch A M 2001 MRI vs. histologic measurement of breast cancer following chemotherapy: comparison with X-ray mammography and palpation J. Magn. Reson. Imaging 13 868-875
Weidner N, Semple J P, Welch W R and Folkman J 1991 Tumor angiogenesis and metastasis- correlation in invasive breast cancer N. Engl. J. Med. 324 1-8
Table 1. Statistical analysis between different MRI-derived angiogenic parameters and tumor response at different time points
amplitude vs. tumor response
before C/T after first C/T after final C/T
mean SD kurtosis skewness mean SD kurtosis skewness mean SD kurtosis skewness
r20.18 0.37* 0.40* 0.20 0.06 0.63* 0.17 0.21 0.71* 0.59* 0.39* 0.24
p 0.14 0.03* 0.02* 0.12 0.43 0.001* 0.16 0.11 0.0003* 0.002* 0.02* 0.09
kout vs. tumor response
before C/T after first C/T after final C/T
mean SD kurtosis skewness mean SD kurtosis skewness mean SD kurtosis skewness
r2 0.01 0.01 0.17 0.21 0.07 0.33* 0.33* 0.11 0.06 0.17 0.25 0.12
p 0.70 0.76 0.16 0.11 0.38 0.04* 0.04* 0.26 0.43 0.16 0.08 0.25
peak enhancement vs. tumor response
before C/T after first C/T after final C/T
mean SD kurtosis skewness mean SD kurtosis skewness mean SD kurtosis skewness
r20.10 0.00 0.14 0.07 0.01 0.05 0.00 0.06 0.50* 0.14 0.29 0.04
p 0.28 0.93 0.22 0.38 0.74 0.44 0.84 0.40 0.01* 0.21 0.06 0.51