Content Matters: A study of hate groups detection
based on social networks analysis and web mining
I-Hsien Ting, Shyue-Liang Wang
Department of Information ManagementNational University of Kaohsiung Kaohsiung, Taiwan {iting, slwang}@nuk.edu.tw
Jyun-Sing Wu
Department of Information Management National University of Kaohsiung
Kaohsiung, Taiwan [email protected]
Abstract—In recent years, with rapid growth of social networking websites, users are very active in these platforms and large amount of data are aggregated. Among those social networking websites, Facebook is the most popular website that has most users. However, in Facebook, the abusing problem is a very critical issue, such as Hate Groups. Therefore, many researchers are devoting on how to detect potential hate groups, such as using the techniques of social networks analysis. However, we believe content is also a very important factors for hate groups detection. Thus, in this paper, we will propose an architecture to for hate groups detection which is based on the technique of Social Networks Analysis and Web Mining (Text Mining; Natural Language Processing). From the experiment result, it shows that content plays an critical role for hate groups detection and the performance is better than the system that just applying social networks analysis.
Keywords—hate groups; social networks analysis, web mining, facebook
I. INTRODUCTION (Heading 1)
With the rapid growth of the Internet communication techniques, the World Wide Web has become a very important platform for users to interact with each other. Through these platforms, users can easily share and spread information and ideas.
In recent years, online social networking websites become very popular on which users are able to share different information. YouTube (www.youtube.com) is a website for video sharing; Blogger (www.blogger.com) is designed for sharing the articles whereas Flickr (www.flickr.com) shares photos. Facebook (www.facebook.com), as well as MySpace (www.myspace.com) is a platform created for exchanging different kinds of messages, including photo, music and articles etc. These websites also become the busiest ones in the world.
Along with the people’s interactions with each other on these social networking websites, more and more data and different information are aggregated. Among the information on these social networking websites, some are considered as negative ones because they could be utilized to attack and to slander. It is very interesting that this kind of information is are always the information that spreads at the fastest speed.
Hate group is a group of users who attack, hate, and abuse particular objects, such as groups, companies, races or religions (Chau and Xu, 2006). In the age of web 2.0, it is easier for hate group to affect users and to spread their ideas since the WWW is a public platform in which users can interact with each other. Especially in Facebook, the “Groups” function also provides a very good platform for those hate groups to share their ideas and to attract new users. Recently, the groups in Facebook have become a main target and therefore it becomes essential for us to develop a mean to locate hate groups.
In this paper, we intend to propose an architecture which is based on the classification technique of Data Mining. We will firstly observe the existing hate groups and the like groups in Facebook, and extract the features of these groups which include keywords that frequently used in them and the social network structure (Wasserman and Faust, 1994). According to the extracted keywords and social network structure, the activity patterns can then be used to discover potential hate groups.
In previous researches, most of them are focusing on detecting hate groups based on social networks structure. However, in this research, we believe “content” should be also important factors for hate groups detection. Due to it is content sensitive to identify hate or like groups from our observation. Therefore, in this research, we assume the performance of hate groups detection can be improved after considering the content that used in the groups of Facebook. In order to evaluate our assumption, a serial of experiments will be designed to measure the performance of hate groups detection under different environments.
The paper is organized as follows: The first section is the introduction and the background of the paper. In section 2, related literatures about social networks analysis, web mining and related works of hate groups detection based on SNA and WM will be reviewed. In section 3, we will start to propose the approach of the paper which combines the techniques of Web Mining (text mining) and Social Networks Analysis. In section 4, a serial of experiments will be designed to discover hate groups. The paper will be concluded in section 5 along with the discussion of the future directions of this research.
II. LITERATURE REVIEW
A. Social Networks Analysis and Web Mining (1) Social Networks Analysis
Social networks analysis research has a long history about 100 years. In 1994, Wasserman and Faust defined social networks analysis as “Social Networks Analysis is a research methodology based on sociology, it can be used to analyze the model between relationship and the interaction between actors” (Wasserman and Faust 1994). Recently, the methodologies and measurements of social networks analysis have been widely applied in different areas, such as Sociology, Management and Business, Biology and Information Technology, etc. (Jun et al., 2006) (Wilson, 1989). Hanneman and Riddle pointed out a social network is composited by actors, relationships and linkages (Hanneman and Riddle, 2005). In the book “Social Network Analysis: A Hand Book” (Scott, 2000), the basic concept, measurements, and methodologies have been introduced very well. For example, the definitions of the roles in a social network, Bridge, Social, Star, Isolate and Peak. The measurements have also been defined, such as Centrality, Closeness, Network Cluster, Network Diameter, etc.
In social networks analysis, there are several frequent used technologies, including Average Shortest Path Length, Diameter, Density, Centrality (Degree Centrality, Closeness Centrality, Betweenness Centrality), Clustering Coefficient. These measurements are very common used and can be found in many literatures and books. Therefore we are not going to discuss the details of the methodologies in this paper.
(2) Web Mining
Web Mining is a technique that based on traditional techniques of Data mining and the data are mainly from web. Data Mining has given the cleaned data intelligent methods that can be applied in order to extract data patterns. Data Mining is the extraction of hidden predictive information from large databases, is a powerful new technology with great potential to help companies focus on the most important information in their huge database (Kurt, 1999).
Web mining technologies can be used to generate new business opportunities by providing capabilities if given databases of sufficient size and quality: automatic prediction of trends and behaviors, and automatic discovery of previously unknown patterns. The mostly common used techniques in data mining including Classification, Sequential mining, Clustering, Associations, Genetic Algorithm, Decision Tree, etc. In this research, Classification is considered as the most suitable techniques as it can be used to classify data into pre-identified classes. (Han and Kamber, 2001) (Kudo and Skalansky, 2000)
B. Related Works of Hate Groups Detection based on SNA and WM
In order to discover potential hate groups in the World Wide Web, some researchers have already proposed different means to deal with this problem. In 2003, Gerstenfeld et al. analyzed 157 extremist sites and found links between most of these websites (Gerstenfeld et al.). In 2005, Zhou et al. used a software to assist the analysis of the content and links on the
websites of hate groups. In their research, they found the main object of these websites is trying to spread and promote their ideas, such as white supremacists and Neo-Nazis. Chau and Xu used the technique of social networks analysis and web mining to analyze the hate groups in the Internet, which is considered as the major breakthrough of the research in hate group detection. Wiil et al. intended to analyze the hate groups according to the nodes in the social networks and to illustrate the social network structure. Warner and Hirschberg are trying to detect the hate message by using the technique of text mining and semantic analysis. However, most of the researches concentrate on applying social networks analysis and link analysis for hate group detection.
III. THE PROPOSED APPROACH
According to the background and the shortage of current researchers that discussed in the literature review section, we therefore propose a hybrid approach which combines the techniques of text mining and social networks analysis. Figure 1 shows the proposed approach in this research based on the concept above. The details of the steps in figure1 will be introduced in the rest of this section.
Facebook Data Extraction
Raw Data Hate Groups
Data Pre-Processing
Social Network Structure Features and Content Features Extraction
10-Fold Cross-Validation by using Classifiers in Weka
Raw Data Like Groups
SNS Features for Hate Groups Content Features for Hate
Groups
SNS Features for Like Groups Content Features for Like
Groups
A. Facebook Data Extraction
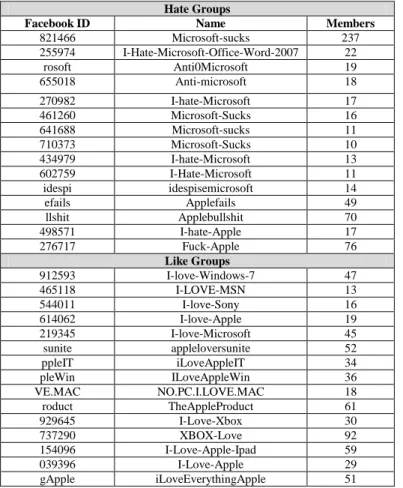
In order to collect training data for the proposed system, we reviewed large amount of groups manually in Facebook according to the keywords that used in the groups to classify the groups into hate group and like group. The keywords for hate groups such as “hate”, “suck”, “shit”, “evil”, “bullshit”, “anti”, “fail”, etc. The keywords for like groups such as “love”, “like”, “good”, “awesome”, etc. We also limited the groups which are related to 3C companies, such as Microsoft, Apple, Sony, or Samsung. Therefore, we also use composite keywords, such as “hate Microsoft”, “Microsoft suck”, etc. After reviewing the groups, we collected both 15 groups for hate groups and like groups and there are at least 10 members in the groups. The public Facebook API (Application Programming Interface) and PHP are used to retrieve data of these groups from Facebook (visit https://developers.facebook.com/apps for details of the Facebook API). The detail of the collected groups is shown in table 1.
Table 1. The Collected Hate Groups and Like Groups
Hate Groups
Facebook ID Name Members
821466 Microsoft-sucks 237 255974 I-Hate-Microsoft-Office-Word-2007 22 rosoft Anti0Microsoft 19 655018 Anti-microsoft 18 270982 I-hate-Microsoft 17 461260 Microsoft-Sucks 16 641688 Microsoft-sucks 11 710373 Microsoft-Sucks 10 434979 I-hate-Microsoft 13 602759 I-Hate-Microsoft 11 idespi idespisemicrosoft 14 efails Applefails 49 llshit Applebullshit 70 498571 I-hate-Apple 17 276717 Fuck-Apple 76 Like Groups 912593 I-love-Windows-7 47 465118 I-LOVE-MSN 13 544011 I-love-Sony 16 614062 I-love-Apple 19 219345 I-love-Microsoft 45 sunite appleloversunite 52 ppleIT iLoveAppleIT 34 pleWin ILoveAppleWin 36 VE.MAC NO.PC.I.LOVE.MAC 18 roduct TheAppleProduct 61 929645 I-Love-Xbox 30 737290 XBOX-Love 92 154096 I-Love-Apple-Ipad 59 039396 I-Love-Apple 29 gApple iLoveEverythingApple 51 B. Data Pre-processing
There are three main tasks in the step of data pre-processing including Data Cleaning, User Matrix Creating and Keywords Extracting. After collecting the data from Facebook, we need to clean the data first, due to the data are always very noisy. We follow the guideline of data cleaning that proposed by Cooley et all. to clean raw data (Cooley et al., 2000).
User matrix is an essential data for Social Networks Analysis which is to measure the relationship and interaction
between each pair of users in a social network (Scott, 2000). Before creating the user matrix, it is important to identify the relationship in a social network. In this research, we are going to discover three different types of relationship and by the relationships to create the user matrix. The three relationships are (1) Post a message in a group, (2) Reply to other members’ post and (3) Like other members’ post. When the above three relationships are discovered between each two users, the relationship of the two users will be added 1. Figure 2 show an example of the users’ interactions and relationships in Facebook.
Fig 2: An example of the users’ interactions and relationships in Facebook
After identifying the relationships in the social networks, the users’ matrix can then be created. A sample users’ matrix is shown in table 2, which is from the real data that we collected from Facebook. In this research, our focus is based on a group of users. Thus, the matrix is created based on the concept of indirected adjacency matrix.
Table 2. A sample users’ matrix
A B C D E F A 0 10 10 10 11 12 B 10 0 0 0 1 1 C 10 0 0 0 1 1 D 10 0 0 0 1 1 E 11 1 1 1 0 2 F 12 1 1 1 2 0
The third tasks of the data pre-processing step is focusing on how to extract keywords from the content of the data and how to measure the importance of the keywords. In this paper, the technique that we used is based on NLP (Natural Language Processing) to extract the keywords as well as the stop-words. The segmentation of keywords is applying the keywords segmentation system that developed by Stanford University (http://nlp.stanford.edu/software/segmenter.shtml).
Fig 3: An example of a sentence that processed by the keyword segmentation system
Figure 3 shows an example of a sentence that processed by the segmentation system.
The TF-IDF (Term Frequency-Inverse Document Frequency) is the commonest way to measure the importance of keywords. The formulations of TF and IDF are shown below as equation 1, 2 and 3.
,
,
Freq i j
TF
Maxfreq l j
……….…(1)log
iN
IDF
n
……….(2)TD
IDF
TF
IDF
……… ..(3)In equation 1, Freq(i, j) denotes the frequency of keyword i in document j and Maxfreq(l, j) means the total keywords of document j. In equation 2, N is total number of documents and ni is the total number of the document that contains keyword i.
C. Social Network Structure Features Extraction
Talking about the social network structure feature extraction, most of the common used SNA (Social Network Analysis) measurements will be extracted, including clustering coefficient, centrality, density and the average shortest path length, closeness centrality, betweenness centrality (Scott, 2000). These measurements are generated by using UCINet 6.0 (http://www.analytictech.com/ucinet/) which imports the preprocessed training data with the format of users matrix.
D. Content Features Extraction
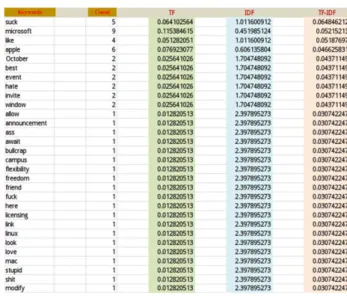
With regard to content features extraction, the message content in the hate groups will be pre-processing by using TF-IDF (term frequency-inverse document frequency) which is a very commonly used natural language processing technique. The keywords in the hate groups will be extracted and ranked according to the TF-IDF value for each keyword. Then, we will also extract keywords and to measure the TF-IDF value for testing data. Table 3 shows the extracted keywords, the TF value, the IDF values and the TF-IDF values. The keywords in table 3 are ranked according to TF-IDF value. In this research, we extracted 450 keywords and table 3 shows the top 30 keywords.
The similarity between the training data and testing data is measured by using cosine similarity (Salton, 1988). The formulation of cosine similarity is shown as equation 4. In the formulation,
A
andB
denotes the keyword vector of document A and B, and n denotes the size ofA
andB
.
n 1 i 2 i n 1 i 2 i n 1 i i i B A B A B A B A B A, Similarity ...(4)Table 3. The extracted keywords ranked by TF-IDF
Keywords Count
E. Group vectors
According to the extracted social network structure features and keyword features, we will then composed the features as a group matrix of hybrid features. The matrix is shown below. In the matrix, D denotes the Density measurement of SNA, ASD denotes the Average Shortest Distance, CC denotes the Clustering Coefficient, CLC denotes the CLosness Centrality, BC denotes the Betweenness Centrality, KS denotes the Keyword Similarity, and IHG denotes is the group classified to a hate group or not and the value is a Boolean value. In this paper, we will arrange a serial of experiments including, content features only, social network structure features only and hybrid features (see section 4 for the detail of the experiments). Equation 5 is the group vector for hybrid features. Equation 6 is the group vector for content features only experiment and equation 7 is the group vector for social network structure features only experiment.
D
ASD
CC
DC
CLC
BC
KS
IHG
Group
,
,
,
,
,
,
,
...(5)
KS
IHG
Group
,
……….…(6)
D
ASD
CC
DC
CLC
BC
IHG
Group
,
,
,
,
,
,
…....…(7)The group matrix will be used for classification. The features will be treated as parameters in WEKA (http://www.cs.waikato.ac.nz/ml/weka/), which is a very famous and popular data mining tool. The experiment on measuring the performance of the proposed approach will be discussed in next section.
IV. EXPERIMENT DESIGN
In the previous section, we have introduced the group matrix which would be used for WEKA to classify groups for hate group detection. In order to evaluate the prediction performance, we design a serial of experiments with different number of keywords. Figure 2 shows the experiment design of this paper.
In Figure 2, we intend to test the prediction performance of the hybrid features under different standards, namely: top 30
keywords, top 50 keywords and top 100 keywords. In WEKA, we selected two classification algorithms, which are J48 (C4.5) Decision Tree Classifier and Naïve Bayes Classifier. Furthermore, 10-flod cross validation is used for validating the accuracy of hate groups detection. After performing the WEKA, the evaluation results are shown in Table 1.
Experiments for Hate Groups Detection Experiment 1: SNA Top 30 Keywords Top 50 Keywords Top 100 Keywords
Experiment Results and Evaluation
Experiment 2: Content Experiment 3: Hybrid Features Top 30 Keywords Top 50 Keywords Top 100 Keywords
Fig 2: The design of the experiments
Table 2. The performance evaluation summarization table of hate groups detection
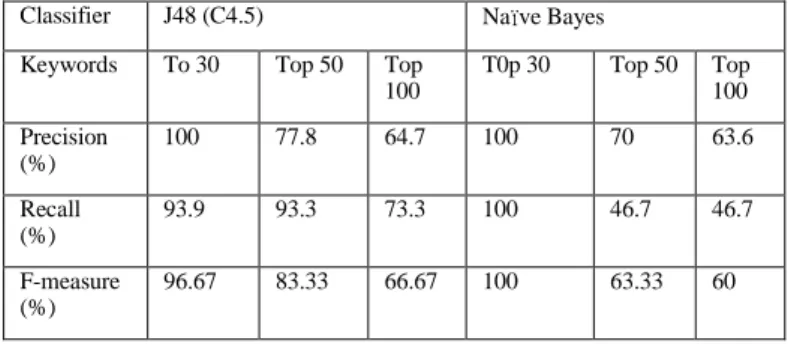
Classifier J48 (C4.5) Naïve Bayes
Keywords To 30 Top 50 Top 100 T0p 30 Top 50 Top 100 Precision (%) 100 77.8 64.7 100 70 63.6 Recall (%) 93.9 93.3 73.3 100 46.7 46.7 F-measure (%) 96.67 83.33 66.67 100 63.33 60
Table 1 is the performance evaluation summarization table of hate groups detection. In this table, 100% precision, recall and F-measure are shown as the best performance when using Naïve Bayes classifier with top 30 keywords. Furthermore, we can also found that the accuracy of performance is decreasing when the number of keywords applied is increasing. Therefore, the few keywords adopted for the hybrid features, the better accuracy of performance will be reached in the hate group detection.
V. CONCLUSION AND FUTURE RESEARCH DIRECTION In this paper, we have proposed an approach for hate groups detection in Facebook. The approach is a hybrid one which combines the features of social network structure and the features of keywords of message. In order to test the performance of hate groups detection, a serial of experiments
have been performed to shows acceptable results and performance. In the experiment, WEKA works as the classification tool as well as J48 and Naïve Bayes do.
In future research, we are going to test the proposed approach with only the features of social network structure or the features of keywords and compare the performances of hybrid approach. In addition, we can also select different classifiers, such as Neural Network etc., to test the performance, In the future, we also plan to develop approaches for detecting hate groups in different websites, such as Twitter, Plurk, and Blogger, etc. Furthermore, the researches of hate groups detection approach in the real world are also a very interesting direction.
ACKNOWLEDGMENT
This work is partially supported by the grant from National Science Council, Taiwan under the grant number of NSC 99-2410-H-390-029-.
REFERENCES
[1] Chau, M., and Xu, J. (2006). Mining Communities and Their Relationships in Blogs: A Study of Online Hate Groups. International Journal of Human-Computer Studies, 65, pp. 57-70.
[2] Cooley, R., Mobasher, B., Srivastava, J. (2000). ASutomatic Personalization Based on Web Usage Mining, Communications of the ACM, 43, pp. 142-151.
[3] Gerstenfeld, P. B., Grant, D. R., Chiang, C. P. (2003) Hate Online: A Content Analysis of Extremist Internet Sites., Analyses of Social Issues and Public Policy, 3, pp. 29-44
[4] Han J., Kamber M., (2001), Data Mining: Concepts and Techniques, Morgan Kaufmann Publishers.
[5] Hanneman, R. A. and Riddle, M. (2005) Introduction to Social Network Methods, Riverside, CA, University of California
[6] Jun, T., Kim, J. Y., Kim, B. J. and Choi, M. Y. (2006) Consumber Refeeeral in A Small World Network, Social Networks, 28, pp.232-246 [7] Kudo, M., Skalansky, J., (2000), “Comparison of Algorithms That
Select Features for Pattern Classifiers”. Pattern Recognition, 33(1), pp. 25-41.
[8] Kurt, T. (1999), “A Introduction of Data Mining” , Direct Marketing Magazine, Feb.
[9] Salton, G. (1988) Automatic Text Processing: The Transformation, Analysis and Retrieval of Information by Computer, Addison-Wesley Publisher
[10] Scott, J. (2000) Social Networks Analysis: A Hand Book, SAGE Publication, London
[11] Warner, W., and Hirschberg, J. (2012). Detecting Hate Speech on the World Wide Web. In Proceedings of the Second Workshop on Language in Social Media, Montreal, Canada.
[12] Wasserman, S., Faust, K., (1994). Social Network Analysis: Methods and Applications. Cambridge University Press, Cambridge.
[13] Wiil U, K,, Gniadek J., Memin N. (2010). Measuring Link Importance in Terrorist Networks, In Proceedings of International Conference on Advances in Social Networks Analysis and Mining, Odense, Denmark [14] Wilson, D. S. (1989) Levels of Selection: An Alternative to
Individualism in Biology and the Human Science, Social Networks, 11, 3, pp.257-272
[15] Zhou, Y., Reid, E., Qin, J., Chen, H., Lai, G. (2005). US Domestic Extremist Groups on the Web: Link and Content Analysis, IEEE Intelligent Systems, 20, pp. 44-51.