Abstract - Although Taiwan’s 3G services startedits operation in 2003, the main profit source for every telecommunication company is still the cheaper fees of airtime minutes. Therefore, this study is directed on how these companies design the marketing tactics closer to the consumers’need underthedualinfluencesofthedecreasing individual’scontribution and thelow utility rate, as well as how to improve customers’willingness to adopt 3G mobile telecommunication services. Unified Theory of Acceptance and Use of Technology (UTAUT) is used as the model to carry out expert interviews and consumers’ questionnaire investigation. This study found that the factors that significantly influenced the “behavioral intention”include “performance expectancy,” “social influence,” and “facilitating conditions,”whilethe traditional known “effort expectancy” did not. Moreover, three non-assumed relationships were discovered during the Structural Equation Modeling analysis, which helped to revise the UTAUT model for 3G telecommunication services. The results of this study can be helpful to Taiwan’smobile telecommunication companies to adjust their corporate strategies and tactics for providing customer-oriented 3G services to both existing and potential customers, such that the overall 3G market can be expanded as well as a win-win situation for the 3G industry and their consumers can be achieved.
Key words - 3G Mobile Telecommunication, Unified Theory of Acceptance and Use of Technology (UTAUT), Structural Equation Modeling
I. INTRODUCTION
According to the latest research report of GSM
Association, the number of global mobile
telecommunication users will surpass 5 billion in 2015, which is three times the current number. Meanwhile, the coverage of the mobile network has already reached 80% of the global population, which is twice of the number in 2000. In Taiwan, as pointed out by the Institute for Information Industry, the cell-phone numbers has reached 22,970,000 in the third quarter of 2006, which is a 100% of popularity rate [1]. Among them, around 8,990,000 users adopted Taiwan’smobile Internet [2]. Specifically speaking, there were 3,840,000 users for 3G data services and PHS users in the third quarter of 2006, which accounted 42.7% of the total users of network Internet. The above figures show that the numbers of cell-phone and mobile Internet of Taiwan usage have always kept at a high level. Nevertheless, the mobile value-added services have been at low level at the same time, which
only accounts for 5% to 10% of mobile
telecommunication industry’sprofit[2].
In the past, Taiwan’s cell telephone market is relatively small on the data services. For user’s contribution to data-service profit, the highest one is 8% by Far EasTone, and then 6% by Chunghwa Telecom and Taiwan Mobile. Among Taiwan’smobile data services, picture and ring tone downloading, game and friend-meeting are the most popular mobile value-added services besides messaging, which reflects that the current mobile services has not been widely accepted by the consumers. This is really a general bottleneck faced by the mobile phones suppliers in the whole world. The major factors that hinder the transition from 2G to 3G mobile phones may be attributed to the size of the screen, the convenience of materials inputting, the restriction of bandwidth allocation and the support of value-added service’scompanies.
To our understanding, the true barrier for increasing 3G mobilephone’susagemaybedueto theincapable of effectively communicating the differences and benefits between 3G and 2G mobile phone to the users [3]. Therefore, this study intents to probe into the relationships
between intention/behavior of adopting 3G
telecommunication services and their determinants using a theoretical-based model, such that the specific results of technology acceptance for 3G services can be useful references for Taiwan’s mobile telecommunication companies to develop their marketing tactics and customer relationship management.
II. LITERATURE REVIEW
A. The current situation of 3G mobile telecommunication industry
Mobile telecommunication system continuously progresses with the advancement of technology and the users’ demands towards transmission speed and application services. A noteworthy point is that the mobile telecommunication system is not only evolved and developed unilaterally, but the 1G, 2G, 3G that this study mentioned are also the classifications of the current mobile telecommunication system according to their transmission speeds and applications. In particular, the so-called third generation mobile telecommunication system is the mobile telecommunication system that combines the multimedia communications, such as wireless communication and global Internet, copes with many
Wu, Y.-L., Tao, Y.-H., and P.-C. Yang, Using UTAUT to explore the behavior of 3G mobile
communication user,
I
I
E
E
E
E
E
E
I
I
n
n
t
t
e
e
r
r
n
n
a
a
t
t
i
i
o
o
n
n
a
a
l
l
C
C
o
o
n
n
f
f
e
e
r
r
e
e
n
n
c
c
e
e
o
o
n
n
I
I
n
n
d
d
u
u
s
s
t
t
r
r
i
i
a
a
l
l
E
E
n
n
g
g
i
i
n
n
e
e
e
e
r
r
i
i
n
n
g
g
a
a
n
n
d
d
E
E
n
n
g
g
i
i
n
n
e
e
e
e
r
r
i
i
n
n
g
g
M
M
a
a
n
n
a
a
g
g
e
e
m
m
e
e
n
n
t
t
,
, Singapore, December 2-5
,
2
2
0
0
0
0
7
7
Using UTAUT to explore the behavior of 3G mobile communication users
Yu-Lung Wu
1, Yu-Hui Tao
2, Pei-Chi Yang
31Department of Information Management, I-Shou University, Kaohsiung County, Taiwan 2Department of Information Management, National University of Kaohsiung, Kaohsiung, Taiwan
kinds of media, such as picture, audio-visual, and video conference, and offers diversified information services including Internet surfing, video conference, and mobile
e-commerce. The third generation of mobile
telecommunication system must possess enough bandwidth and transmission speed in order to offer this kind of multimedia service [4], such that customers can have the best quality of receiving environment in any place and any time [5].
According to the investigation report of Global System for Mobile Entertainment Services Market of Informa Telecoms & Media, the Global System for Mobile Entertainment Services Market is up to US$18.8 billion in 2006, and it is expected to be up to US$39.3 billion by 2011 [6]. In terms of the user population, the new research report,“Worldwide Cellular User Forecasts, 2005-2010”, by Strategy Analytics Wireless Network Strategies Service points out that the global mobile users will be up to 2.5 billion by the end of 2006, and reaches 3.500 billion users before the end of 2010. In addition, Strategy Analytics also predicts that in the following ten years, the industry of the mobile telephone will produce the service profit of US$800 billion.
With the gradual progress of technology and the mobile device of downloading, 3G technology will be commercialized successively. The market of 3G becomes gradually clear in other countries. For example, since the third quarter of 2006 in Japan, the 3G user population has already been up to 57 million. In addition, the transmitting rate of 3G technology increases from 384bps to 2Mbps, so that the potential multimedia network services, such as e-book, electronic comic, mobile TV (audio-visual steam), mobile game, mobile music, etc., are put forward successively. Take South Korea as another example, the consumers are charged for about US$15 per month for the service of watching TV though the cell phone. However, the statistics in 2006 shows that Taiwan 3G users have already exceeded 3 million, the popularity of mobile data service should grow significantly, but the fact is not so. According to “The behavioral investigation of the usage of Taiwan mobile dataservice”conducted by the Institute for Information Industry, the popularity of mobile data service for Taiwanese was 59% in 2006, which is only relatively fair compared with 2004 and 2005. In other words, the mobile data service has not been significantly improved as the rapidly growth of 3G user population. In addition, the profit of Taiwan mobile data service accounts for only 8.3% of average profit per user, which is still incomparable with 20% in Japan and Korea [7]
The third generation of communication service has the same advantage of the traditional e-commerce as well as the unique service characteristics and value-added benefits. If the companies of the third generation of communication service can understand the consumers’ behavior of using 3G services in depth, then they can not only promote the quality of communication service, but also can obtain abundant consumers’ information[8]. Accordingly, investigating the customers’ behavior of
using 3G services can improve the effective customer service and expand the using market [9]. However, the success of mobile value-added service market must be established under the prerequisites of complete customers, content, terminal device, service platform, marketing service and operational models, and none of above-mentioned conditions can be dispensed with.
The cell phone subscribers in Taiwan are full of expectation towards mobile value-added services, but they are currently not satisfied in the actual applications. This polarized response has been shown on the content and application of the mobile value-added services and paying desire. Therefore, how to understand the consumers’ demands and intention/behavior and then bring out the consumers’ actual application of mobile services using formal theory like Unified Theory of Acceptance and Use of Technology is desirable.
B. Unified Theory of Acceptance and Use of Technology (UTAUT)
With regard to the study of“technology acceptance behavior”,TAM mainly offersabasicframework so asto explain the influence of external variables towards behavioral idea [10]. Practically, one must cooperate with the theme characteristics to choose different external variables and probe into the roles that these variables play [11]. With the flourishing development of TAM’s relevant studies, the external variables that counter different fields are more and more as well. Venkatesh et al. [12] have done a review on relevant studies over the years, and found the models that were evidenced based in the past differ from one another which have all been verified in each field and category separately. As a result, they combined the eight models in the previous documents to address the new framework for Unified Theory of Acceptance and Use of Technology (UTAUT). The eight models include Theory of Reasoned Action (TRA), Technology Acceptance Model (TAM), Motivational Model (MM), Theory of Planned Behavior (TPB), C-TAM-TPB, Model of PC utilization (MPCU), Innovation Diffusion Theory (IDT), and Social Cognitive Theory (SCT).
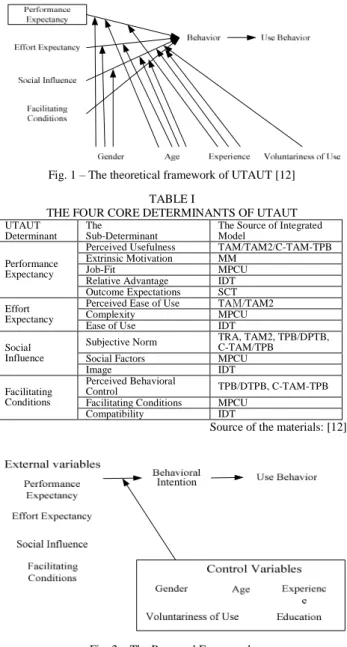
UTAUT model integrates the points that were addressed in the relevant documents into four core determinants: performance expectancy, effort expectancy, social influence, facilitating conditions; and four control variables: gender, age, experience, and voluntariness of use. The evidence-based result shows that this new framework’s explanation strength for technology acceptance behavior is up to 70%, which is more effective than any known models from the past. Its theoretical framework is shown in Fig. 1, and its four core determinants are shown in Table I.
III. THE STUDY FRAMEWORK
Synthesizing the above-mentioned literature reviews, the framework of this study can be integrated and shown
in Fig. 2. The external variables are formed by the four core determinants in UTAUT model; the control variables are in accordance with the UTAUT model’s variables, including gender, age, experience, voluntariness of use, and level of education is added.
Fig. 1 –The theoretical framework of UTAUT [12] TABLE I
THE FOUR CORE DETERMINANTS OF UTAUT
UTAUT Determinant
The
Sub-Determinant
The Source of Integrated Model
Perceived Usefulness TAM/TAM2/C-TAM-TPB Extrinsic Motivation MM
Job-Fit MPCU
Relative Advantage IDT Performance
Expectancy
Outcome Expectations SCT Perceived Ease of Use TAM/TAM2
Complexity MPCU
Effort Expectancy
Ease of Use IDT
Subjective Norm TRA, TAM2, TPB/DPTB,C-TAM/TPB
Social Factors MPCU
Social Influence
Image IDT
Perceived Behavioral
Control TPB/DTPB, C-TAM-TPB
Facilitating Conditions MPCU Facilitating
Conditions
Compatibility IDT
Source of the materials: [12]
Fig. 2 –The Proposed Framework
The major differences between this study and the original UTAUT study [12] lie in the temporal dimension and the connotation of determinants by “external variables”. For the temporal dimension, because Venkatesh et al. [12] focused on the specific application software to train the same participant, it was required to carry out three tests in three periods of time before and after training. This study only has one test because it is designed to survey participants at different stages of the temporal dimension all at once. Also, because theuser’s “familiarization”with regard to thatsoftwarewillchange with time, this can be used to measure the influence of “using experience”towardseach determinant.Therefore, “using experience”in thisstudy refersto theindividual’s
using habit in the past [13]. Finally, education is added into the control variable group because it is conjectured to be relevant as the other control variables in mobile communication adoption.
Due to the page-length limitation, the 5 hypotheses of this study can be referenced in Table III in next Section. Also, the analysis of control variables is omitted in this paper to accommodate the 5-page length limit.
IV. THE STUDY RESULT AND ANALYSIS
In order to understand theconsumers’demandsand intention/behavior, and then bring out the consumers’ actual application of 3G mobile telecommunication service, this study used the questionnaire method to examine the framework of this study. The questionnaire was initially designed in accordance with the operational definitions referred in “2006 WMIS Global Mobile InternetInvestigation”issued by InstituteforInformation Industry in 2006. Then interviews were conducted with
related units of five domestic 3G mobile
telecommunication companies for possible modifications of the final questionnaire. The questionnaire was divided into three sections, including the questions for external variables, the questions for behavioral intention, and the questions for use behavior.
In the end, this study has received 292 valid responses via online questionnaire lasted for 3 weeks, plus another 102 valid responses distributed on-the-spot of telecommunications companies, which summed up to 394 valid responses altogether. The user profile is summarized in Table II, which indicates majority of them were male, between 26-35 age group, working professionals, above college degree level, living in metropolitan area, having over five years of telephone experience, paying over 400 NT$ monthly fees, and spending less than 15 minutes on 3G services.
For the validity analysis, the KMO (Kaiser-Meyer-Olkin) values of this study were all greater than 0.8, which is greater than the suggested minimum value of 0.5 for adequacy. In addition, from Bartlett's test, the test result was also showing good sphericity with the common factors existed between the related matrix of the population. Both tests indicated that these 29 variables were suitable to carry out the factor analysis. For the reliability analysis, SPSS15 software was used and a high overall Cronbach’s α = 0.9521 was obtained. Then the reliability analysis re-test for these three sections was carried out separately, their final values were all showing highly acceptable values of greater than 0.8.
According to the above-mentioned establishment of UTAUT–based framework, “performance expectancy”, “effortexpectancy”,“socialinfluence”,and “facilitating conditions” are the independent variables or exogenous variables, whereas “behavioral intention” and “use behavior” are the dependent variables or endogenous variables, and the “behavioral intention” is also the intermediary variable.
TABLEII
VULATION POPULATION OF TESTANTS
Variables Categories Frequency Percentage (%)
Male 242 61.4 Female 152 38.6 Sex Total 394 100 Under 17 2 0.5 17-25 70 17.8 26-35 258 65.5 36-45 62 15.7 Over 46 2 0.5 Age (year) Total 394 100 Students 114 28.9 IT industry 44 11.2 Manufacturing 26 6.6
Financial and insurance/ real estate industry
16 4.1 Mounties 46 11.7 Services 90 22.8 Medical industry 8 2.0 Media / advertising industry 4 1.0 Others 46 11.7 Occupation Total 394 100 Foreign countries 14 3.6
High school / grade 158 40.1
University / specialist 188 47.7 Over Institute 34 8.6 Education Total 394 100 North 114 28.9 Central 42 10.7 Southern 228 57.9 Eastern 4 1.0 Islands region 6 1.5 Region Total 394 100
Less than a year 2 0.5
1-2 6 1.5 3~4 24 6.1 Over 5 years 362 91.9 Use phone time (year) Total 394 100 Under 200 38 9.6 201-400 60 15.2 401-600 108 27.4 601-1000 86 21.8 Over 1001 102 25.9 The monthly phone rates (NT$) Total 394 100 0-15 minutes 328 83.2 16-30 minutes 20 5.1 31-60 minutes 12 3.0
Between 1 and 2 hours 10 2.5
Between 2 and 3 hours 8 2.0
Over 3 hours 16 4.1 The daily average amount of time spent online 3G Total 394 100
Source of the materials: Arranged by this study
TABLE III
THE MODIFIED SEM STUDY FRAMEWORK
The Relationship of Variables
Path Coefficient
Critica
l Ratio P-value Significance Performance Expectancy→ Behavioral intention 0.419 7.020 (>1.96 ) *** Yes Effort Expectancy →Behavioralintention 0.057 1.192 0.233 No Social Influence
→Behavioralintention 0.362 6.239 *** Yes Facilitating Conditions
→Behavioralintention 0.228 3.054 *** Yes Facilitating Conditions
→Use behavior -0.212 -2.154 * Yes
Behavioral intention
→Use behavior 1.179 6.063 *** Yes
Performance Expectancy →Use behavior
0.529 5.747 *** Yes
Effort Expectancy
→Use behavior 0.141 2.459 * Yes
SocialInfluence →Use
behavior 0.243 3.621 *** Yes
* p-value < 0.05, ** p-value < 0.01, *** p-value < 0.001
The study adopted AMOS7.0, a maximum likelihood-based SEM (structural equation model) software. The overall model fitting focused on each determinant whereas the change of each variable path was according to the modification indicators recommended by SEM with
regard to the data analysis. Particularly, all variable were adjusted so as to lift the explanation ability of the model for the use behavior.
Fig. 3 –The Revised Framework
After modifying the model, all fit indicators’ determinations had reached the desirable standard, which means that the overall model fit was good. In another word, the path diagram of the model fitted well with the actual observed data, the assumption of the cause and effect model diagram that this study addressed had obtained the statistical support. Moreover, some non-assumed variables’relationships,including “performance expectancy/use behavior”, “effort expectancy/use behavior”, and “social influence/use behavior”, were significant. So, these three non-assumed variables’ relationships were added to the study framework. The modified study framework with SEM statistics is shown in Table III whereas the results of the hypotheses are summarized in Table IV.
TABLE IV
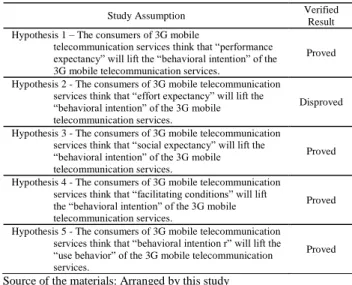
THE VERIFIED RESULT OF SEM STRUCTURAL ASSUMPTION
Study Assumption Verified
Result Hypothesis 1 –The consumers of 3G mobile
telecommunication servicesthink that“performance expectancy” willliftthe “behavioralintention” ofthe 3G mobile telecommunication services.
Proved
Hypothesis 2 - The consumers of 3G mobile telecommunication servicesthink that“effortexpectancy” willliftthe “behavioralintention” ofthe 3G mobile telecommunication services.
Disproved
Hypothesis 3 - The consumers of 3G mobile telecommunication servicesthink that“socialexpectancy” willliftthe “behavioralintention” ofthe 3G mobile telecommunication services.
Proved
Hypothesis 4 - The consumers of 3G mobile telecommunication services think that“facilitating conditions” willlift the “behavioralintention” ofthe 3G mobile telecommunication services.
Proved
Hypothesis 5 - The consumers of 3G mobile telecommunication servicesthink that“behavioralintention r” willliftthe “use behavior” ofthe 3G mobile telecommunication services.
Proved
Source of the materials: Arranged by this study
Among the 5 hypotheses, only hypothesis 2 was disproved. The direct interpretation of this result was that for users of 3G mobile communication services, their "effort expectancy" did not significantly influence their ”behavioral intention”. This is an interesting characteristic of 3G mobile communications services since most other technology adoption models credited the influenceof“easeofuse”factoron “behavioral intention”. This reveals an important but uncommon insight for 3G
mobilecommunication servicesthatonly “easeofuse”is not enough to attract the users.
V. CONCLUSION AND SUGGESTIONS
This study used a well-established UTAUT model to measure the influence of the user’s experience towards each potential determinant of behavioral intention for 3G mobile telecommunication services. The results show that the consumers agreed that “performance expectancy”, “socialexpectancy”,and “facilitating conditions”will lift the “behavioral intention”, and “behavioral intention”will lift the “use behavior” of the 3G mobile telecommunication services. In the non-assumed relationships, “performance expectancy”, “effort expectancy”, and “social influence” were found to influence the “use behavior”as well, which infers a revised UTAUT model specifically for 3G mobile telecommunication services as shown in Fig. 3.
The revised UTAUT model in Fig. 3 sustained that majority of UTAUT paths via the data collected for Taiwan’s 3G mobile telecommunication services, but differences did exist in either the industry type or the geographical area. Therefore, the research implication is that UTAUT is a pretty robust model for technology acceptance prediction, but is still subject to modifications for at least industry type and geographical area as proven in this study.
On the counterpart of managerial implications, among the four determinants, only “effort expectancy” was proven to be insignificantly influencing the “behavioral
intention”. This implies that 3G mobile
telecommunication companies may deploy their R&D or marketing strategies and tactics by following previous UTAUT theory to increasepotentialconsumers’intention to use 3G value-added services by focusing on aspects of performance expectancy, social influence and facilitation conditions. On the other hand, effort expectancy may be a necessary condition, but not the sufficient criterion to lift consumers’ intention to adopt. This is an unusual exception to general technology acceptance situations and thus is worthy of the attention of the 3G mobile telecommunication companies. Another managerial implication is that the 3G companies can skip measuring behavior intention because “performance expectancy”, “effortexpectancy”,and “socialinfluence”were proven to have directly influences on theactual“usebehavior”in this study. Specifically speaking, 3G companies can have the flexibility to base on their marketing target of either behavior intention or use behavior to deploy their strategies and tactics.
Several limitations do exit to scope the above conclusions. First, the analysis of control variables was not included in this paper due to the page limit, thus the complete analyses of the full model in Fig. 3 is left to be
reported in another paper. Second, because currently 3G companies will frequently update the contents and functions of mobile value-added services, it is difficult to follow thetrailofconsumers’using outcomes.Therefore, this study used only one point-in-time method to explore consumers’ use experience for easier data collection. However, the three tests at three different time periods as the original UTAUT study [12] did is preferred in future studies for lifting the rigorousness of the revised model as seen in Fig 3. Finally, the proposed UTAUT model is only valid for Taiwan’s 3G mobile telecommunication services due to the data collection restriction. A generalization of the application scope of this revised UTAUT model would require a global-area data collection process for a more thorough validation.
REFERENCES
[1] Institute for Information Industry, http://www.find.org.tw/, October 23, 2006.
[2] National Communications Commission,
http://www.ncc.gov.tw/.
[3] R. Wei,,“Motivations for using the mobile phone for mass communications and entertainment,” Telemetric and
Informatics, 2005.
[4] Topology Research Institute,“TheReview and analysis of investigating the application trend of cell phones and the competition of 3G telecommunications market,” TRI
Industrial Report, Published by Topology Co., Ltd.,
September 2005, the 40th issue.
[5] S.-C. Zeng, , “The study of the tactics of 3G mobile telecommunications market,” unpublished Master Thesis, Graduate School of Information Management, National Sun Yat-sen University, 2002.
[6] Informa Telecoms & Media, Frost & Sullivan, http://www.informatm.com/itmgcontent/icoms, Dec. 2006. [7] Institute for Information Industry, http://www.find.org.tw/,
April 14, 2007.
[8] N. Nohria and M. Leestma, ”A moving target: The mobile-commerce customer,”MIT Sloan Management Review, Vol.
42, pp.104, Spring 2001.
[9] R. B. Green, V. Hatini, K. A. Johansen, X. J. Liu, and J. A. Lengyel, “Drumstick is a zinc finger protein that antagonizes Lines to control patterning and morphogenesis of the Drosophila hindgut,” Development Vol. 129, pp. 3645-3656, 2002.
[10] F. D. Davis,”Perceived usefulness,perceived easeofuse, and user acceptance of information technology,” MIS
Quarterly, Vol. 13, pp. 319-340, 1989.
[11] V. Venkatesh and M. G. Morris,“Why don’tmen ever stop to ask for directions? Gender, social influence, and their Role in technology acceptance and usageBehavior,”MIS Quarterly, Vol. 24, pp. 115-139, 2000.
[12] V. Venkatesh, M.G. Morris, G.B. Davis and F. D. Davis, “User acceptance of information technology: Toward a unified View,”MIS Quarterly, Vol. 27, pp. 425-478, 2003.
[13] V. Venkatesh and F.D. Davis,“A modelofantecedents of perceived ease of use: Development and test,” Decision