金融改革、金融監管與動態效率關聯性之探討—以台灣或大陸之商業銀行為例 - 政大學術集成
104
0
0
全文
(2) 立. 政 治 大. ‧. ‧ 國. 學. n. er. io. sit. y. Nat. al. Ch. engchi. i Un. v.
(3) 立. 政 治 大. ‧. ‧ 國. 學. n. er. io. sit. y. Nat. al. Ch. engchi. i Un. v.
(4) 立. 政 治 大. ‧. ‧ 國. 學. n. er. io. sit. y. Nat. al. Ch. engchi. i Un. v.
(5) 致謝. 感謝李桐豪老師培養教育我的博士學術之路,豐富我的學術研究生活。因曾在 金融實務界工作過,如果我可以用嚴謹有邏輯的方法,試圖解決金融實務問題,或 許可讓學術研究多一些發現及想像。博士班的訓練培養我蒐集資料和閱讀的習慣、 嚴謹的邏輯及推理分析能力。在和老師討論中,除訓練理性思考事物的觀點、培養 研究的能力及判斷議題的研究價值外,更從老師身上學習到學術研究的素養及學術 紀律的嚴謹。 感謝口試委員王國樑老師、梁連文老師、張興華老師及黃博怡老師(按姓氏筆劃). 政 治 大. 所給予的寶貴意見,使得博士論文在內容架構、研究方法及實證結果解釋上更加完. 立. 善;謝謝淑芳助教在博班期間所給予的任何幫忙及協助;謝謝一起走過資格考投稿. ‧ 國. 學. 的金融博同學們,準備資格考雖然辛苦但相當值得,因為從中學習解決問題的勇氣 及毅力,培養邏輯的推理及思考能力。. ‧. 最後,謹將此論文獻給我最敬愛的父母親。父母親的處事態度帶給我正面思考. y. Nat. sit. 的人生觀,以面對未來的挑戰。從香港滙豐銀行到政治大學金融學系博士,逐漸找. n. al. er. io. 到自己興趣的金融專業領域。希望,今年,跨越的將是我人生另一個新的旅程。. Ch. engchi. i Un. v. 遲淑華 謹致 2013 年 7 月 于 國立政治大學金融學系.
(6) 立. 政 治 大. ‧. ‧ 國. 學. n. er. io. sit. y. Nat. al. Ch. engchi. i Un. v.
(7) 摘要. 為解決臺灣層金融機構經營不善問題,政府於 2001 年 7 月成立金融重建基金 (financial restructuring fund),主要是讓淨值為負的金融機構退出市場。金融重建基金是 以概括承受及公開標售方式處理問題金融機構,在政府提供法規誘因下,銀行在衡量自 身經營狀況後,進而決定是否在「金融重建基金設置及管理條例」實施期間參與合併案。 而是否參與合併對銀行而言是一項重大且長遠之決策,公司經營管理階層及董事會於併 購程序中所應盡之義務,對股東權益之保障益顯得重要。本文先研究「金融重建基金設 置及管理條例」實施期間,台灣銀行參與或不參與金融重建合併機制的公司治理特質及. 政 治 大 再者,金融監理的目的主要是使銀行提高流動性和清償能力,進而防範銀行倒閉, 立 但實施(或較嚴謹)銀行監管是否會減損效率?亦或有助於銀行經營效率的提升?本文接 其對合併靜態與動態效率的影響。. ‧ 國. 學. 著研究中國金融監管的特質及其對上市銀行靜態與動態效率的影響,亦進一步探討金融. ‧. 監管對銀行效率與風險的抉擇(trade-off)關係。有別於過去文獻多著重於公司治理或金融 監管與效率當期效果(concurrent effect)的靜態研究,我們進一步使用 Tone and Tsutsui. y. Nat. sit. (2010)的動態差額變數基礎模型(Dynamic Slacks-Based Measure;DSBM),分析公司治理. al. er. io. 或 金 融 監 管 改 變 對 銀 行 動 態 效 率 (dynamic efficiency) 的 影 響 是 否 存 在 時 間 遞 延. n. iv n C hengchi U 實證結果顯示,無論是否參與金融重建合併機制之主併銀行,在金融重建實施期間,. (time-deferred)效果。. 席次控制比例都明顯增加,這顯示控制股東對於是否參與金融重建機制下的合併具有更 大的決策能力。參與金融重建機制之主併銀行,短期內雖然會造成合併後靜態與動態效 率的減損,但長期在有效掌握公司運作的前提下,合併效率可望逐漸提升改善。此觀察 與控制股東決定合併與否,是以追求銀行長期效率提升為目標的假說一致。本研究亦突 顯公司治理,在金融重建機制下,對銀行合併靜態與動態效率之重要性。 存貸比及流動性比率皆對利潤及動態效率有影響,但大小銀行顯著結果並不一致; 大銀行之撥備覆蓋率愈高,風險愈低,但對小銀行沒有顯著影響;成本收入比愈高,動 態及利潤效率愈差,但對小銀行之風險沒有影響,確會使大銀行之風險增加。這表示小 銀行和上市銀行對資產品質(即不良貸款)之風險控管能力有所不同,相較於小銀行,大.
(8) 銀行較有風險抵禦的能力,但宜留意成本控制問題。不論是資本充足率或是一級資本充 足率皆不會影響銀行的利潤效率,但就小銀行而言,資本充足率愈高,風險愈低;貸款 撥備率及槓桿比率對利潤效率為顯著正向影響,並沒有對銀行之利潤及資產擴張經營模 式形成限制。 所以,金融監管除對中國商業銀行效率有影響,也影響銀行的經營理念、發展策略 和經營發展方式的改變。在《巴塞爾協議Ⅲ》的實施下,大陸商業銀行銀行必須改變依 靠貸款規模擴張獲取利潤的經營發展方式,致力於經營發展方式的轉型。由上述分析得 知,中國銀監會應從金融風險防範的角度,在考量銀行經營現狀下,對不同資產規模的 銀行實施差異化監管。. 立. 政 治 大. ‧. ‧ 國. 學. n. er. io. sit. y. Nat. al. Ch. engchi. i Un. v.
(9) Abstract. The Financial Restructuring Fund provides a bank make the important decision of whether to merge the problem bank, through the market mechanism. To protect shareholder equity, the obligation of bank management and the board of directors in the merger process are important.The study examines how the financial restructuring scheme affects corporate governance of acquiring banks under or without the restructuring scheme, and whether corporate governance makes a difference in static and dynamic efficiency for bank mergers during implementation of the Financial Restructuring Fund Statute in Taiwan. The goal of financial regulation is to enable banks to improve liquidity and solvency. Stricter regulation may be good for bank stability, but not for bank efficiency. This research aims to explore how the previously implemented financial regulations have affected bank efficiency in the past. In addition, we also explored the trade-off relationship between efficiency and risk.. 政 治 大 regulation) that affect the concurrent 立 static efficiency of bank, we further use dynamic slacks-based. Unlike other literatures only investigating the characteristics of corporate governance (bank. measure (DSBM) to study the persistent and intertemporal effects on the dynamic efficiency of bank in. ‧ 國. 學. the long run. In addition, this study used bank assets as a classification standard from the financial risk and differential regulatory perspective. Our results show that major shareholders of acquiring banks. ‧. had greater controlling power to decide whether to merge during the financial restructuring period. During the financial restructuring period, a bank merger using the financial restructuring scheme had. Nat. sit. y. less static and dynamic efficiency in the short run, but gradually increased in the long run. Such an. io. in a bank merger.. n. al. er. observation is consistent with the hypothesis that controlling shareholders pursue long-term efficiency. Ch. i Un. v. The ability to control risks and asset quality for large and small banks is different. The. engchi. large banks have greatly enhanced the ability to resist risk and identify the customer to whom to lend funds. In addition, the large banks should pay more attention to the cost of control than small banks should. The purpose of CBRC regulates the current ratio is to reduce the risks of banks. Based on our empirical results, the current ratio did not affect the risks and led to different efficiency results between large and small banks. We also find the capital adequacy did not a significantly affect bank’s static efficiency. It seems the new capital requirements may not swallow their profits and lead to a decline in return. To attain the requirement of Basel III, China commercial banks must change the profit model which depends on expand the scale of assets and purse the transformation of business development. From the risk-prevention point of view, the CBRC should adopt differentiated financial regulation policies for banks of different asset sizes according to the operating status..
(10) 立. 政 治 大. ‧. ‧ 國. 學. n. er. io. sit. y. Nat. al. Ch. engchi. i Un. v.
(11) Contents Chapter 1 Introduction......................................................................................................................... 1 Chapter 2 Does Financial Restructuring Change the Relationship between Corporate Governance and the Static and Dynamic Efficiency of Bank Mergers in Taiwan.................................................. 5 1. Introduction................................................................................................................................. 5 2. Methodology and Framework .................................................................................................... 8 2.1 Data Envelopment Analysis ................................................................................................ 9 2.1.1 The Slacks-based Measure ........................................................................................................... 9 2.1.2 Dynamic Slack-based Model ..................................................................................................... 11 2.2 Tobit Regression Model and Bootstrapping Method........................................................ 13 2.2.1 Model and Variable ....................................................................................................................... 13 2.2.2 Hypothesis ....................................................................................................................................... 15 3. Empirical Analysis.................................................................................................................... 16 3.1 Implementation of Financial Restructuring...................................................................... 16 3.2 The Static Efficiency of Bank Merger .............................................................................. 17 3.3 Relationship between Efficiency and Corporate Governance Characteristics ................ 19 3.3.1 Correlation Analysis ..................................................................................................................... 19 3.3.2 Quandt and Chow Test ................................................................................................................ 19 3.3.3 Tobit Regression Model and Bootstrapping Method ......................................................... 20 3.3.4 Relationship between Corporate Governance and the Dynamic Efficiency of Bank Merger .................................................................................................................................... 22 4. Conclusion ................................................................................................................................ 24. 立. 政 治 大. ‧. ‧ 國. 學. er. io. sit. y. Nat. al. v. n. Chapter 3 Does Financial Regulation Enhance or Impede the Efficiency of China’s Listed Commercial Banks? A Dynamic Perspective.................................................................................... 27. Ch. engchi. i Un. 1. Introduction............................................................................................................................... 27 2. CBRC’s Regulation of China's Banking Industry.................................................................... 30 3. Methodology and Framework .................................................................................................. 30 3.1 Data Envelopment Analysis .............................................................................................. 32 3.1.1 The Slacks-based Measure ......................................................................................................... 32 3.1.2 The Dynamic Slack-based Model ............................................................................................ 34 3.2 Tobit Regression Model .................................................................................................... 36 3.2.1 Model and Variable ....................................................................................................................... 36 3.2.2 Hypothesis ....................................................................................................................................... 38 4. Empirical Analysis.................................................................................................................... 39 4.1 The Static Efficiency of Listed Bank................................................................................ 39 4.2 The Relationship between the Efficiency and Financial Regulation ............................... 40 i.
(12) 4.2.1 The Correlation Analysis ............................................................................................................ 40 4.2.2 The Financial Regulation in China’s Listed Commercial Banks ................................... 40 4.2.3 Tobit Regression Model .............................................................................................................. 41 4.3 The Relationship between Financial Regulation and the Dynamic Efficiency of Bank . 42 5. Conclusion ................................................................................................................................ 44 Chapter 4 Does Financial Regulation Affect the Profit Efficiency and Risk of Banks? Evidence from China's Commercial Banks ...................................................................................................... 45 1. Introduction............................................................................................................................... 45 2. Basel III and the China Banking Regulation............................................................................ 48 2.1 China’s Own Version of Basel III ..................................................................................... 48 2.2 CBRC’s Regulation of China's Banking Industry ............................................................ 49 3. Literature Review ..................................................................................................................... 51 3.1 Bank Regulation and Efficiency ....................................................................................... 51 3.2 Bank Regulation and Risk ................................................................................................ 51 3.3 Trade - off between Bank Efficiency and Risk................................................................. 52 4. Methodology and Framework .................................................................................................. 53 4.1 The Profit Efficiency Model ............................................................................................. 53 4.1.1 Model Description ......................................................................................................................... 54 4.1.2 Data and Definition ....................................................................................................................... 55 4.2 Definition of Z-Score ........................................................................................................ 57 4.3 Tobit and OLS Regression Model..................................................................................... 58 4.3.1 Model and Variable ....................................................................................................................... 58 4.3.2 Hypothesis ....................................................................................................................................... 60 5. Empirical Analysis.................................................................................................................... 62 5.1 The Correlation Analysis .................................................................................................. 62 5.2 The Relationship between the Financial Regulation and Efficiency and Risk................ 62 6. Conclusion ................................................................................................................................ 65. 立. 政 治 大. ‧. ‧ 國. 學. n. er. io. sit. y. Nat. al. Ch. engchi. i Un. v. Chapter 5 Concluding Remarks and Future Researches................................................................... 69 1. Concluding Remarks ................................................................................................................ 69 2. Future Researches ..................................................................................................................... 71 2.1 Research Method............................................................................................................... 71 2.1.1 To overcome the Nonstochastic Problem of DEA .............................................................. 71 2.1.2 Sensitivity Analysis in DEA ...................................................................................................... 72 2.2 Research Issue ................................................................................................................... 72 Reference ........................................................................................................................................... 73 Appendix............................................................................................................................................ 81. ii.
(13) List of Tables Table 2-1 Definition of input and output variables ....................................................................11 Table 2-2 Definition of explanatory variables ............................................................................14 Table 2-3 Hypotheses ..................................................................................................................15 Table 2-4 The correlation coefficient..........................................................................................19 Table 2-5 The relationship between the static efficiency and the characteristics of corporate governance for the acquiring banks ............................................................................21 Table 2-6 Summaries of hypotheses results ...............................................................................21 Table 2-7 Seat control right, dynamic efficiency, and significant results ..................................24 Table 3-1 The CBRC’s regulation of China's banking industry.................................................31 Table 3-2 Definitions of input and output variables...................................................................34. 政 治 大. Table 3-3 Definition of explanatory variables ............................................................................37 Table 3-4 Hypotheses ..................................................................................................................38. 立. Table 3-5 The static efficiency of the China listed commercial banks ......................................40. ‧ 國. 學. Table 3-6 Summary statistics for variables.................................................................................41 Table 3-7 The relationship between the static efficiency and the characteristics of financial. ‧. regulation for all listed banks .....................................................................................42 Table 3-8 Summaries of hypotheses results ...............................................................................43. Nat. sit. y. Table 4-1 The CBRC’s supervision of China's banking industry ..............................................50. io. er. Table 4-2 Definitions of input and output variables...................................................................56 Table 4-3 Definition of explanatory variables ............................................................................58. n. al. i Un. v. Table 4-4 Hypothesis...................................................................................................................60. Ch. engchi. Table 4-5 The relationship between financial regulation and profit efficiency and risk for large and small banks ..................................................................................................64 Table 4-6 Significant results under the Tobit and OLS regression model:distinguish between large and small banks ....................................................................................65 Table 4-7 Summaries of hypotheses results ...............................................................................67 Table 5-1 A comparison of the research method and empirical results between the second and third essays ...........................................................................................................70 Table A2-1 Descriptive statistics and efficiency difference test:The static efficiency of banks with or without the financial restructuring scheme .....................................81 Table A2-2 Descriptive statistics and mean difference test: The explanatory variable of banks with participating in the financial restructuring scheme..............................82 iii.
(14) Table A2-3 Descriptive statistics and mean difference test: The explanatory variable of banks without participating financial restructuring scheme...................................83 Table A2-4 Descriptive statistics and mean difference test: The dynamic efficiency of banks with or without the financial restructuring scheme .....................................84 Table A3-1 Correlation matrix ....................................................................................................85 Table A4-1 The number of sample banks ...................................................................................86 Table A4-2 The proportions of sample banks’ assets .................................................................86 Table A4-3 Summary statistics for dependent and independent variables ................................87 Table A4-4 The correlation coefficient .......................................................................................88. 立. 政 治 大. ‧. ‧ 國. 學. n. er. io. sit. y. Nat. al. Ch. engchi. iv. i Un. v.
(15) List of Figures Figure 2-1 Dynamic structure (Tone and Tsutsui, 2010)............................................................11 Figure 2-2 The efficiency of acquiring banks with or without participating in the financial restructuring scheme..................................................................................................18 Figure 2-3 Seat control right of acquiring banks with or without participating in the financial restructuring scheme..................................................................................................22 Figure 2-4 Dynamic efficiency of acquiring banks with or without participating in the financial restructuring scheme. .................................................................................22 Figure 3-1 Dynamic structure (Tone and Tsutsui, 2010)............................................................34 Figure 3-2 The static and dynamic efficiency: all listed banks..................................................44. 立. 政 治 大. ‧. ‧ 國. 學. n. er. io. sit. y. Nat. al. Ch. engchi. v. i Un. v.
(16) 立. 政 治 大. ‧. ‧ 國. 學. n. er. io. sit. y. Nat. al. Ch. engchi. i Un. v.
(17) Chapter 1 Introduction To dispose of failed financial institutions, the government promulgated the Financial Restructuring Fund Statute on July 9, 2001. The Fund may entrust a Central Deposit Insurance Company (CDIC) with the handling of financial institutions with unsound operations. This fund completed periodic tasks by the end of 2011. This Fund also serves the purpose of integrating financial markets and stabilizing financial conditions. In a review of merger events in the Taiwan banking industry before 2000, the government directed the merger policy and asked healthy banks to undertake troubled financial institutions. After 2000, the government encouraged mergers and acquisitions among financial institutions. Voluntary mergers inspired by strategic consideration have been developed since. The scheme provides a bank with the opportunity to bid. The scheme does not limit the participants, thereby increasing the bank incentive to participate in mergers. After considering. 治 政 大 of bank management and the market mechanism. To protect shareholder equity, the obligation 立process are important. This study examines how the financial board of directors in the merger their strategy, banks must make the important decision of whether to merge, through the. ‧ 國. 學. restructuring scheme affects corporate governance of acquiring banks under or without the restructuring scheme, and whether corporate governance makes a difference in static and dynamic efficiency for bank mergers during implementation of the Financial Restructuring. ‧. Fund Statute in Taiwan. This study is unique in simultaneously considering Taiwan corporate. sit. y. Nat. governance, bank mergers, and the financial restructuring scheme. China had planned to put China under the global Basel III regime, at the start of 2012 year,. io. n. al. er. a year ahead of the phase-in period stipulated in the Basel agreement. By moving the start date. i Un. v. to January 1 2013, China confirmed that those original plans were too ambitious. The CBRC. Ch. will adopt stricter financial regulations than Basel III1. China had cited worries that the stricter. engchi. rules would dampen domestic lending and hurt the economy at a time of global instability as reason for postponing the implementation from the original target date. It is obvious that financial regulations will directly affect the behavior of commercial banks. China will not postpone the implementation of Basel III and adopt the stricter financial regulation than Basel III and their own unique regulation indicators are the reasons. This is the incentive why the research chooses China as study subject. Whether banks implement regulation will enhance the efficiency or impede efficiency? We attempt to contribute to this assessment by examining whether banks have met the CBRC’s standard of financial regulations and explores how the previously implemented financial regulations have affected bank efficiency in the past. The goal of financial regulation is to 1. In particular, the core tier 1 capital adequacy ratio will be set at 5 percent, 0.5 percent higher than Basel III.The required leverage ratio will be set at 4 percent, 1 percent higher than required by the Basel III agreement. 1.
(18) enable banks to improve liquidity and solvency. Stricter regulation may be good for bank stability, but not for bank efficiency. In addition, we also explored the trade-off relationship between efficiency and risk 2 . Unlike other studies, this study used bank assets as a classification standard from the financial risk and differential regulatory perspective. How can the corporate governance (financial regulation) effects on bank efficiency be measured? Previous studies use static efficiency to measure. Instead, we believe that due to the properties of the corporate governance and financial regulation, if the study uses a static point of view to measure the policy effects on bank efficiency, it may not consider the persistent and intertemporal effects of the policies. Unlike other literatures only investigating the characteristics of corporate governance (financial regulation) that affect the concurrent static efficiency of bank, we further use dynamic slacks-based measure (DSBM) to study the persistent and intertemporal effects on the dynamic efficiency of bank in the long run.. 政 治 大. Our results show that major shareholders of acquiring banks had greater controlling power to decide whether to merge during the financial restructuring period. During the. 立. financial restructuring period, a bank merger using the financial restructuring scheme had less. ‧ 國. 學. static and dynamic efficiency in the short run, but gradually increased in the long run. Such an observation is consistent with the hypothesis that controlling shareholders pursue long-term efficiency in a bank merger.. ‧. The small banks that possess higher loan to deposit ratio are less efficient. The more loans. y. Nat. impede the profit efficiency and enhance the risk. The listed commercial banks that possess. sit. higher loan to deposit ratio are more efficient. The more loans enhance the dynamic efficiency. er. io. and do not affect the risk. The loan to deposit ratio had different effect on profit efficiency for small and listed commercial banks. The higher the provision coverage ratio is, the lower the. al. n. iv n C asset quality for large and small This indicates that the ability tohcontrol i U e n grisks c hand. risk of large bank. But, the ratio did not a significantly affect small bank’s risk.. banks is different. The large banks have greatly enhanced the ability to resist risk. The current ratio had a significant positive effect on the profit efficiency for small banks and negative effect for large banks. The current ratio had a significant effect on profit efficiency for large and small banks, but the significant results are inconsistent. The small banks that possess higher current ratio are more efficient. The more current asset enhances the profit efficiency. The listed commercial banks that possess higher current ratio are less efficient. The more current asset impedes the profit efficiency. The cost to income ratio had a significant negative effect on dynamic and profit efficiency of China commercial banks. The loan loss provision and leverage ratio had a positive effect on profit efficiency for China banks. This indicates that these two ratios did not restrict the business model of asset expansion for banks.. 2. The trade-off between stability and efficiency of financial intermediation particularly interests financial regulators around the globe. Policymakers must consider its trade-off with allocative and dynamic efficiency of financial intermediation. 2.
(19) The ability to control risks and asset quality for large and small banks is different. The large banks have greatly enhanced the ability to resist risk and identify the customer to whom to lend funds. In addition, the large banks should pay more attention to the cost of control than small banks should. The purpose of CBRC regulates the current ratio is to reduce the risks of banks. Based on our empirical results, the current ratio did not affect the risks and led to different efficiency results between large and small banks. We also find the capital adequacy did not a significantly affect bank’s static efficiency. It seems the new capital requirements may not swallow their profits and lead to a decline in return. From the risk-prevention point of view, the CBRC should adopt differentiated financial regulation policies for banks of different asset sizes according to the operating status. Financial regulation affects the profit and dynamic efficiency. To attain the requirement of Basel III, China commercial banks must change the profit model which depends on expand the. 政 治 大 capital adequacy ratio, bank will 立be faced with the needs for capital supplementation. Then, the scale of assets and purse the transformation of business development. The scale expansion of. loan will bring an increase in capital. In order to keep up with the regulatory requirements on new capital requirements will greatly restrict commercial banks’ credit expansion. Upon the. ‧ 國. 學. implementation of the new rules, Chinese banks will have to consider possible ways of replenishing capital again.. ‧. To attain the requirement of capital adequacy ratio, the circulation pattern of. n. al. er. io. sit. y. Nat. credit expansion and capital complement will be changed. China’s commercial banks are vigorously developing capital-saving products and growing non-interest-related income to contribute more than half of their total incomes. Therefore, the banking sector should make more efforts on credit structure adjustment and credit quality improvement in the coming period of time, which is also the expected goal of the CBRC in its efforts to boost the implementation of new regulatory standards.. Ch. engchi. i Un. v. This Dissertation consists of three essays in financial reform, regulation and dynamic efficiency of commercial banks from Taiwan or China’s perspective. The remainder of this dissertation is as follows. In chapter 2, we present the first essay “Does Financial Restructuring Change the Relationship between Corporate Governance and the Static and Dynamic Efficiency of Bank Mergers in Taiwan. The second essay “Does Financial Regulation Enhance or Impede the Efficiency of China’s Listed Commercial Banks? A Dynamic Perspective” is displayed in chapter 3. We present the third essay in which we extend the research in exploring the trade-off relationship between efficiency and risk. The third essay “Does Financial Regulation Affect the Profit Efficiency and Risk of Banks? Evidence from China’s Commercial Banks” is presented in chapter 4. Chapter 5 summarizes the main findings of the three studies and future researches.. 3.
(20) 立. 政 治 大. ‧. ‧ 國. 學. n. er. io. sit. y. Nat. al. Ch. engchi. 4. i Un. v.
(21) Chapter 2 Does Financial Restructuring Change the Relationship between Corporate Governance and the Static and Dynamic Efficiency of Bank Mergers in Taiwan 1. Introduction Taiwan banks have traditionally played an important role in economic development, and evidence shows that bank management quality and economic stability have a close relationship (Yu and Wang, 2005). In a review of merger events in the Taiwan banking industry before 2000, the government directed the merger policy and asked healthy banks to undertake troubled financial institutions. After 2000, the government encouraged mergers and acquisitions among financial institutions. Voluntary mergers inspired by strategic consideration have been developed since. Although a bank merger may have a positive economic function, the degree of resource integration and bank culture involvement is the key. 治 政 大 there are no gains of the allocative efficiencies comparing with non-mergers, whereas technical and cost efficiencies立 by mergers in Taiwanese banking industry.. for merger success. Chen, Kao and Lin (2011) showed that bank mergers are more scale and. ‧ 國. 學. To dispose of failed financial institutions, the government promulgated the Financial Restructuring Fund Statute on July 9, 2001. The Fund may entrust a Central Deposit. ‧. Insurance Company (CDIC) with the handling of financial institutions with unsound operations. This fund completed periodic tasks by the end of 2011. Taiwan’s Financial. y. Nat. Restructuring Fund was established to solve the problem of a financial crisis. To facilitate the. sit. withdrawals of ailing financial institutions from the market smoothly and as soon as possible,. al. er. io. and to preempt the occurrence of financial turmoil, the government had borrowed experiences. v. n. from the US, Japan and Korea that utilized public funds to quickly resolve financial crises of. Ch. the business sector and safeguard depositors' Benefits.. engchi. i Un. In addition to the compensation mechanism, the Financial Restructuring Fund also regulates the provisory clauses for banks. For example, the acquiring bank does not lay off the employees of a merged bank. What is the difference in the mechanism before and after the Financial Restructuring Fund is implemented? The Fund provides two mechanisms from the merger-of-bank point of view. First, the Fund can solve the problem of information asymmetry. The fund first compensates for the loss of assets and liabilities audited by Certified Public Accountants3 (CPA), and the banks typically accept the assets and liabilities. Therefore, banks do not entirely accept the loss. Before implementation of financial restructuring, the acquiring bank does not understand the financial condition of the merged bank, increasing the acquisition cost. After implementation of financial restructuring, a CPA 3. When handling accounting and auditing matters, the Fund shall conform to generally accepted accounting principles and auditing standards, and shall establish an accounting system which conforms to such principles and standards. 5.
(22) can audit the financial statements of the merged bank to solve the problem of information asymmetry. Second, the Financial Restructuring Fund reveals the implementation of financial supervision. The financial restructuring fund handles failed financial institutions by general acceptance and auction. The operation differs from the previous approach in which the government coordinates government-controlled banks to general acceptance. No public bidding takes place; only bargaining occurs. After implementation of financial restructuring, the mechanism handles the assets of these financial institutions and disposes of them by offering them for sale by tender, auction, or other method The bank then expands the organizational structure through the previous establishment of additional branches. Based on a competent authority that suspends issuing branch licenses, the bank merges the problem bank to enhance organizational competitiveness by implementing. 治 政 changed, the financial restructuring scheme provides a bank 大with the opportunity to bid. The 立 thereby increasing the bank incentive to participate in scheme does not limit the participants, the Financial Restructuring Fund Statute.When the external competitive environment has. ‧ 國. 學. mergers. Banks must decide whether to merge through the market mechanism after considering their own strategy.. ‧. A bank that relies on public deposits as a major funding source, and a high financial leverage operation, could create a large negative externality to economic stability in the event. y. Nat. of a failure. Therefore, a bank should have sound corporate governance to ensure its prudent. sit. operation, and its performance could accord with the specific structure of its corporate. n. al. er. io. governance. Jiang, Feng and Zhang (2012) suggest that differences in corporate governance. v. have significant impacts on China bank performance. Banks with more dispersed ownership. Ch. i Un. are found to be more profit efficient. Jiang, Feng and Zhang (2009) investigate the effect of. engchi. changes in corporate governance on bank technical efficiency and find state-owned banks are the least efficient banks. This study explores how the financial restructuring scheme affects corporate governance of acquiring banks under or without the financial restructuring scheme, and whether corporate governance makes a difference in static and dynamic efficiency for bank mergers during implementation of the Financial Restructuring Fund Statute in Taiwan. This study is unique in simultaneously considering Taiwan corporate governance, bank mergers, and the financial restructuring scheme. No other study has examined the effect of financial restructuring on bank merger efficiency. The sample period of this research is from the opening of government charter applications for new banks, through the period of establishing financial holding companies, to the end of the turmoil in reconstructing the Taiwan banking industry. The study covers a period of 13 years between 1996 and 2008 and is one of the most comprehensive studies in observing bank merger efficiency and its relation to corporate governance in Taiwan. 6.
(23) We examined whether banks makes different merger decisions with or without participating in the financial restructuring scheme, leading to different static and dynamic efficiencies. We divided acquiring banks into two categories with and without participating in the financial restructuring scheme. The purpose of classification is because these two types of banks are engaged in merger activity during implementation of the Financial Restructuring Fund Statute. One type participates in the financial restructuring scheme, whereas the other does not. Do these two types of banks have different efficiencies because of different strategies? We first use a slacks-based measure (SBM) of data envelopment analysis (DEA) to investigate bank static efficiency before and during the financial restructuring period from the acquiring bank with or without participating in the financial restructuring scheme viewpoint. Before implementation of financial restructuring, the static efficiency of these two types of. 政 治 大 without participating in financial 立 restructuring. This is because banks cannot absorb merger. banks showed no significant difference. After implementation of financial restructuring, the static efficiency of banks with participating financial restructuring was less than that of banks. costs. Thereafter, banks can improve their operating structure and competitiveness by. ‧ 國. 學. merging failed banks. Static efficiency significantly increased relative to banks without participating in financial restructuring in the long term.. ‧. This study used the Chow test and the Quandt-Andrews test to verify that the financial. y. Nat. restructuring scheme causes a structural change in the relationship between the static. sit. efficiency of bank mergers and corporate governance. Because the mechanism is not limited. al. er. io. to participants, it increases bank incentive to participate in the merger. After considering their. n. strategy, banks must make the important decision of whether to merge, through the market. Ch. i Un. v. mechanism. To protect shareholder equity, the obligation of bank management and the board. engchi. of directors in the merger process is important. We further study whether corporate governance affects strategy selection and the static efficiency of bank mergers. We use the Tobit regression model and a bootstrapping method to study the relationship between corporate governance and the static efficiency of bank mergers before and during the financial restructuring period. Before implementation of the financial restructuring scheme, the seat control right did not significantly affect bank static efficiency. However, following implementation of the financial restructuring scheme, the seat control right effect became significantly positive. Our results indicate that implementing the financial restructuring scheme significantly increased the seat control right of acquiring banks. During the financial restructuring period, bank major shareholders had greater controlling power to decide whether to merge. We obtain the effects of corporate governance on static efficiency of bank merger by adopting Tobit regression and the bootstrapping method and use the same significant result under the two methods as the carry-over variable.. 7.
(24) The static efficiency of the SBM model belongs to cross-sectional estimates. Because annual efficiency belongs to a different efficiency frontier, the efficiency comparison must be cautious. The corporate governance variable does not change significantly in the short term and may have time-deferred effect on bank mergers. Measurement of the effect of corporate governance on bank mergers should consider long-term efficiency. Therefore, significant corporate governance variables should exist in each model as the carry-over activity. Unlike other literature that only investigates the characteristics of corporate governance that affect the concurrent static efficiency of bank mergers, we further use the dynamic slacks-based measure (DSBM; Tone and Tsutsui, 2010) to study the time-deferred effect on the dynamic efficiency of bank mergers. This significantly differs from most literature examining the static relationship between the current cost efficiency of bank mergers and corporate governance.. 政 治 大. During the financial restructuring period, a bank merger using the financial restructuring scheme had less static and dynamic efficiency in the short run, but gradually. 立. increased in the long run. Such an observation is consistent with the hypothesis that. ‧ 國. 學. controlling shareholders pursue long-term efficiency in a bank merger. Our results also show that corporate governance plays an important role in static and dynamic efficiency under the Taiwan financial restructuring scheme.. ‧. In an environment of asymmetric information, bank decision making is unobservable.. y. Nat. The characteristics of corporate governance provide market clues if a bank is operating at. sit. maximum efficiency. The relationship between the cost efficiency of bank mergers and. n. al. er. io. corporate governance includes structural changes because of implementation of financial. v. restructuring. Banks evaluating merger efficiency should not only consider cost and benefit,. Ch. i Un. but also their own corporate governance characteristics and associated risks to avoid moral hazard and agency problems.. engchi. The remainder of this paper is as follows. Section 2 presents a discussion on the methodology and data used in the study and hypothesis. Section 3 details the empirical analysis, and Section 4 offers a summary of the findings.. 2. Methodology and Framework We used the slacks-based measure and dynamic slacks-based measure proposed by Tone in Data Envelopment Analysis to measure the static and dynamic efficiency before and after implementation of the financial restructuring scheme from the acquiring bank viewpoint. We also used the Chow test and the Quandt-Andrews test to verify whether the financial restructuring scheme causes a structural change in the relationship between the static. 8.
(25) efficiency of bank mergers and corporate governance. We then applied the Tobit regression model and the bootstrapping method to study the relationship between corporate governance and the static efficiency of bank mergers. This study adopted the same significant result under the Tobit regression model and bootstrapping method as the carry-over variable. 2.1 Data Envelopment Analysis Two main approaches can be used to evaluate the efficiency of financial institutions. The first approach is the financial indicators analysis. This method does not reflect the management value and conceals the long-term operational problem (Sherman and Gold, 1985). The second approach is economic efficiency analysis, which includes parametric and nonparametric methodologies. For example, the stochastic frontier approach (SFA), thick frontier approach (TFA), and distribution-free approach (DFA) are parametric, and data envelopment analysis (DEA) and free disposal hull (FDH) are nonparametric.. 政 治 大 nonparametric, have their own advantages and disadvantages. The SFA method tests 立 hypotheses statistically and constructs confidence intervals that allow for random errors. The The two most commonly adopted methods, SFA for parametric and DEA for. ‧ 國. 學. effects of statistical noise or measurement errors can be distinguished from random errors. Researchers, however, may lose a certain degree of flexibility in model specification.. ‧. However, the DEA method cannot separate statistical noise or measurement errors from random errors. Researchers need not assume the functional form relating inputs to outputs.. y. Nat. Thus, the relative efficiency scores obtained from DEA may be subject to the effects from the. er. io. sit. uncontrollable factors.. DEA uses the linear programming method to construct a piecewise linear surface or. al. n. iv n C given output, and connects these points h toe form i U frontier. Any company not on hefficiency n gthe c the frontier is considered inefficient. A numerical coefficient is assigned to each firm,. frontier over the investigated data. DEA searches for points with the lowest unit cost for any. defining its relative efficiency (between 0 and 1) compared with efficient peers. 2.1.1 The Slacks-based Measure 2.1.1.1 Model Description There are two types of DEA measures, radial and non-radial, which can evaluate the efficiency of DMUs. Radial models assume proportional change of inputs or outputs and typically disregard the existence of slacks in the efficiency scores, whereas non-radial models regard the slacks of each input or output and the variations of inputs and outputs as not proportional. In non-radial models, the inputs/outputs are allowed to decrease/increase at different rates. The slacks-based measure (SBM) developed by Tone (2001) works directly with input excess and output shortfall slacks, and integrates them into an efficiency measure.. 9.
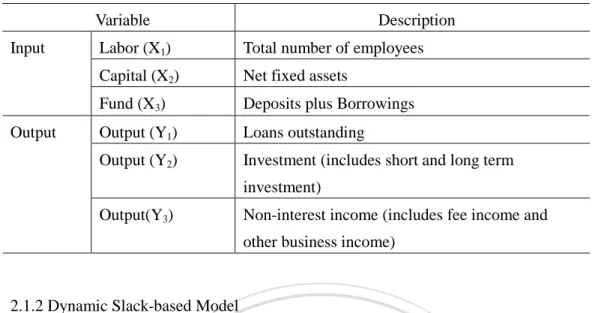
(26) Suppose there are n DMUs and each DMUj (j=1,…,n), uses m inputs x ij ( i = 1,..., m ) to produce s outputs y rj ( r = 1,..., s ). It is assumed that all inputs and outputs are positive. The SBM model, as a non-oriented and non-radial DEA model, evaluates the efficiency of DMU. O. ( o ∈ (1,..., n )) under the assumption of constant returns to scale (CRS), defined as. follows: 1 m si_ ∑ m i =1 xio ρ * = min ρ = 1 s s+ 1+ ∑ r s r =1 y ro 1−. s.t.. n. x io =. ∑λ. y ro =. ∑λ. j =1. j. x ij + s i− , i = 1,..., m , …………………………..(1). j. y rj − s r+ , r = 1,..., s ,. n. j =1. λ , s − , s + ≥ 0, where −. λ = (λ1 , λ2 ,..., λn ) ∈ ℜ − 1. − m. s = ( s ,..., s ) ∈ ℜ. m. n. 立 +. is. 治 政 大 the intensity vector.. + 1. + s. and s = ( s ,..., s ) ∈ ℜ. s. Non-negative. vectors. indicates the input excess and output. ‧ 國. 學. shortfall slacks, respectively. The optimal solution of ρ * is the SBM efficiency score. It can be obviously identified that 0 < ρ * ≤ 1 and supports the properties of unit invariance and monotone. Suppose that an optimal solution for Model (1) is ( ρ * , λ* , s −* , s +* ).. ‧. Nat. sit. y. 2.1.1.2 Data and Definition. er. io. Our research data are from the Taiwan Economic Journal (TEJ), the Central Bank of Taiwan, and the Financial Supervisory Commission. They are unbalanced4 with 16 banks. n. al. Ch. i Un. v. covering the period from 1996 to 2008. We further studied whether corporate governance. engchi. affects strategy selection and the static and dynamic efficiency of bank mergers and selected the acquiring bank with or without participating in the financial restructuring scheme as the sample during implementation of the Financial Restructuring Fund Statute. Banking studies have used various methods to define and categorize input and output variables. This study adopted the intermediation approach5 (Reddy and Nirmala, 2013; Hassan, Sanchez, and Ngene (2012) to define the input and output of financial institutions. We use the intermediation approach, which views financial institutions as mediators between the supply and the demand of funds. Table 2-1 lists the definitions of these variables. 4. Because of merger occurrence, the bank samples differ each year. Berger and Humphrey (1997) pointed out that, although there is no ‘perfect approach’, the intermediation approach may be more appropriate for evaluating entire financial institutions. Moreover, the intermediation approach may be superior for evaluating the importance of frontier efficiency to the profitability of financial institutions, since the minimization of total costs, not just production costs, is needed to maximize profits.. 5. 10.
(27) Table 2-1 Definition of input and output variables Variable Input. Output. Description. Labor (X1). Total number of employees. Capital (X2). Net fixed assets. Fund (X3). Deposits plus Borrowings. Output (Y1). Loans outstanding. Output (Y2). Investment (includes short and long term investment). Output(Y3). Non-interest income (includes fee income and other business income). 2.1.2 Dynamic Slack-based Model. 政 治 大 performance evaluation. Measurement of inter-temporal efficiency change has long been a 立 subject of concern in DEA. The window analysis and Malmquist index are representative In the real business world, the single period optimization model is not suitable for. ‧ 國. 學. methods. However, these models do not account for the effect of carry-over activities between two consecutive terms.. ‧. To manage the long time viewpoint, the dynamic DEA model incorporates carry-over activities into the model and enables us to measure period specific efficiency based on long. Nat. sit. y. time optimization during the whole period. The dynamic DEA model proposed by F¨are and Grosskopf (1996) is the first innovative contribution for such a purpose. Tone and Tsutsui. io. er. (2010) developed their model in the slacks-based measure (SBM) framework, referred to as. al. n. iv n C existence of carry-overs that connect two h econsecutive i Uas shown in Figure 2-1. n g c hterms,. dynamic SBM (DSBM). What distinguishes dynamic DEA from ordinary DEA is the. Figure 2-1 Dynamic structure (Tone and Tsutsui, 2010).. 11.
(28) We address n DMUs ( j = 1,..., n ) over. T. terms ( t = 1,..., T ). At each term, DMUs. have common m inputs (i = 1,..., m) and s outputs (i = 1,..., s ). Let xijt (i = 1,..., m ) and. y ijt (i = 1,..., s ) denote the observed discretionary input and output values of DMU j at term t , respectively. We symbolize the category link as z free . to identify them by term. DMU. (t ),. ,. ( j). and. item. (i ),. we. employ. he. notation. z ijtfree (i = 1,..., nfree; j = 1,..., n; t = 1,..., T ) for denoting free link values, where nfree is the. number of free links. These are all observed values up to the term T . The continuity of link flows (carry-overs) between term t and t + 1 can be guaranteed by the following condition: n. n. j =1. j =1. (∀i; t = 1,..., T − 1) …………………………(2). ∑ zijtα λtj = ∑ zijtα λtj+1. 政 治 大 and term activities. 立. where the symbol α stands for free . This constraint is critical for the dynamic model because it connects term t. t +1. Using these production expressions, we can express DMU o ( o = 1,..., n ) as follows:. y ijt λ tj − s it+. (i = 1,..., s; t = 1,..., T ). n. λ tj = 1. ( i = 1,..., nfree ; t = 1,..., T ). λ tj + s itfree. ( t = 1,..., T ). λ ≥ 0 , s ≥ 0 , s ≥ 0 and t j. al. n. j =1. j =1. free ijt. io. ∑. n. − it. y. ∑z. sit. z iotfree =. j =1. er. ∑. Nat. y iot =. n. ‧ 國. (i = 1,..., m ; t = 1,..., T ). ijt. ‧. λtj + s it−. ∑x j =1. 學. n. xiot =. + it. Ch. engchi. i Un. v. s itfree : free ( ∀ i , t ). ………………………………………………………………………….(3). where sit− , sit+ , and sitfree are slack variables denoting input excess, output shortfall, link shortfall, link excess, and link deviation, respectively. We evaluate the overall efficiency of DMUo (o = 1,..., n) taking ({λt },{st− },{st+ },{stfree}) as variables, in the input orientations. The input-oriented overall efficiency θ 0* is defined by θ 0* = min. 1 T. T. 1. m. ∑ w [1 − m + nbad (∑ t. t =1. i =1. wi− sit− nbad sitbad …………………………….. (4) + ∑ bad )] xiot i =1 z iot. Subject to (2) and (3), where wt and wi− are weights to term t and input i , which are supplied exogenously according to their importance and satisfy the conditions as. 12.
(29) T. ∑w. t. m. and. =T. ∑. t =1. i =1. w i− = m ……………………………………… ………..(5). Each term in the square brackets of (4) expresses the efficiency of term t measured by the relative slacks of inputs and links, and is equal to unity if all slacks are zero. It is units-invariant and its value is between 0 and 1.. θ ot* = 1 −. m 1 w − s −* ( ∑ i iot + m + nbad i = 1 xiot. nbad. ∑ i =1. bad * siot ), bad z iot. ( t = 1,..., T ). ……………….(6). Hence, (4) is the weighted average of term efficiencies over the whole term, which we call the input-oriented overall efficiency and it is also between 0 and 1.. θ o* =. 1 T. T. 政 治 大. w t θ ot* . …………………………………………………..……... (7). ∑. t =1. 立. 2.2 Tobit Regression Model and Bootstrapping Method. ‧ 國. 學. 2.2.1 Model and Variable. ‧. This study selects static efficiency estimated by the SBM model as the explained variable. The efficiency scores (as the explained variable) from DEA are limited to a value between 0. y. Nat. and 1. Because the explained variable in the regression equation cannot be expected to have a. sit. normal distribution, we cannot expect the regression error to also meet the assumption of. n. al. er. io. normal distribution. The OLS method often leads to biased and inconsistent parameter. v. estimates (Greene, 1981). We therefore used Tobit estimation (Garza-Garcia, 2012; Lin, 2012; Cheng, 2012) in this study.. Ch. engchi. i Un. This study first applied DEA to estimate bank efficiency and then used the Tobit regression model to analyze the relationship between efficiency and corporate governance. Such an approach, however, could be logically inconsistent because of different methodologies (nonparametric and parametric) in different stages of estimation. Tobit regression could also lead to biased and inconsistent results. We therefore applied the bootstrapping6 method (Efron, 1979) to alleviate this problem. Drawing on the replacement method, we tested whether the statistically significant relationship is the same between the Tobit regression model and the bootstrapping method.. 6. We first resampled 90% of the whole sample 15 times and estimated the coefficients with OLS. For each of the corporate governance variables, we obtained 15 regression coefficient estimates. We then used 5,000 bootstrap replications of the 15 coefficient estimates to produce the confidence interval. Finally, we tested whether the regression coefficients significantly differ from zero. 13.
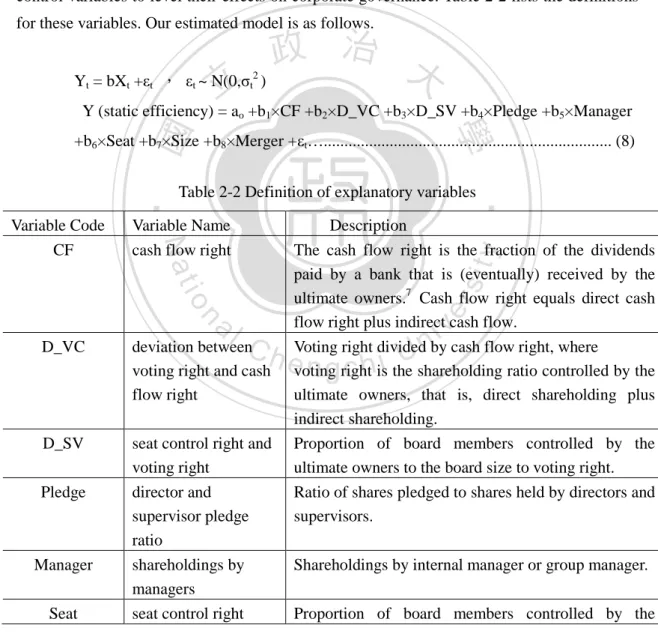
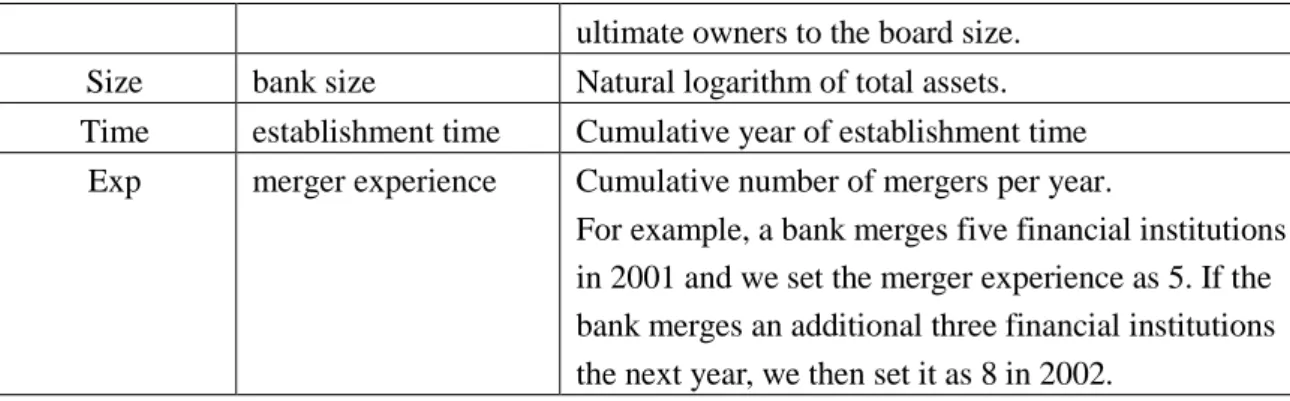
(30) Globerman, Peng, and Shapiro (2011) showed that Taiwanese companies are characterized by a high degree of ownership concentration, a predominance of family control, and an abundance of pyramidal groups and cross-holdings. Young, Peng, Ahlstrom, Bruton, and Jiang (2008) showed that controlling shareholders’ expropriation of minority shareholders’ wealth is an important concern in Taiwan. Whether to merge is an important decision for banks. To protect shareholder equity, the obligation of bank management and the board of directors in the merger process are important. Therefore, we selected cash flow right, deviation between voting right and cash flow right, and deviation between seat control right and voting right as the explanatory variables. We also chose shareholdings by managers, director and supervisor pledge ratio, and seat control right to form the ownership structure characteristics. We finally used bank size, establishment time, and merger experience as control variables to level their effects on corporate governance. Table 2-2 lists the definitions for these variables. Our estimated model is as follows.. 政 治 大 Y = bX +ε , ε ~ N(0,σ ) 立 Y (static efficiency) = a +b ×CF +b ×D_VC +b ×D_SV +b ×Pledge +b ×Manager t. t. t. 2 t. t. o. 1. 2. 3. 4. 5. ‧ 國. 學. +b6×Seat +b7×Size +b8×Merger +εt…...................................................................... (8). Variable Name cash flow right. sit. n. er. io. al. deviation between voting right and cash flow right. D_SV. seat control right and voting right director and supervisor pledge ratio shareholdings by managers seat control right. Manager Seat. 7. Ch. D_VC. Pledge. Description The cash flow right is the fraction of the dividends paid by a bank that is (eventually) received by the ultimate owners.7 Cash flow right equals direct cash flow right plus indirect cash flow. Voting right divided by cash flow right, where voting right is the shareholding ratio controlled by the ultimate owners, that is, direct shareholding plus indirect shareholding. Proportion of board members controlled by the ultimate owners to the board size to voting right. Ratio of shares pledged to shares held by directors and supervisors.. y. Nat. Variable Code CF. ‧. Table 2-2 Definition of explanatory variables. engchi. i Un. v. Shareholdings by internal manager or group manager. Proportion of board members controlled by the. The ultimate owners are the people who have the greatest influence in company decision-making. They are typically major shareholders, chairman, general manager, family members, and management team. 14.
(31) Size Time Exp. bank size establishment time merger experience. ultimate owners to the board size. Natural logarithm of total assets. Cumulative year of establishment time Cumulative number of mergers per year. For example, a bank merges five financial institutions in 2001 and we set the merger experience as 5. If the bank merges an additional three financial institutions the next year, we then set it as 8 in 2002.. 2.2.2 Hypothesis According to our model, we construct six hypotheses for the relationship between static efficiency and ownership structure, as shown in Table 2-3.. 政 治 大 Description Related literature 立 Cash flow right has no effect on bank Li(2012); Lin (2009) Table 2-3 Hypotheses. Ch. y. Lin and Hsu (2008). sit. Yang(2012); Lai(2010). er. al. n. H6. io. H5. Nat. H4. Hung(2011); Huang(2012). ‧. H3. 學. H2. efficiency. Deviation between voting right and cash flow right has no effect on bank efficiency. Seat control right and voting right have no effect on bank efficiency. Director and supervisor pledge ratio has no effect on bank efficiency. Manager shareholdings have no effect on bank efficiency. Seat control right has no effect on bank efficiency.. ‧ 國. Hypothesis H1. Ko(2009); Huang(2012). iv n Lin(2010) U e n g c h iChi(2012);. Hypothesis 1: Cash flow right is the share of capital that the ultimate owner has invested and owns. Because controlling shareholders may have the same interest as the bank, reducing the incentive of using bank resources to enhance their utility, an increase in cash flow right can improve bank efficiency and reduce agency problems (La Porta, Lopez-de-Silanes, Shleifer, and Vishny, 2002). However, controlling shareholders may expropriate other investor wealth, but harm bank efficiency. Li (2012) found that there was no significant correlation between cash flow rights and corporate performance during financial tsunami. Lin (2009) showed that firm value increases with cash-flow right in the hands of controlling shareholders.. 15.
(32) Hypothesis 2: If shareholders control a company through a pyramidal structure or cross-shareholdings, controlling voting rights are greater than cash flow rights. Hung (2011) and Huang (2012) revealed that the deviation between voting right and cash flow right is positively related to long term performance. Hypothesis 3: When directors and supervisors gain more seats than control rights deserve, they may make unfavorable decisions that cost bank efficiency. The dominant controlling shareholder and his family members8 of a privately owned bank in Taiwan often hold positions in both management and the board. Lin and Hsu (2008) examined 14 Taiwanese business groups, along with their 63 affiliated companies, and found that family-controlled firms or firms with a higher deviation of control from cash flow rights underperformed in return on investment. Hypothesis 4: The director and supervisor pledge is another approach to gain control. 治 政 (2012) showed that the pledged shares ratio of directors 大 show a significant negative 立(2010) indicated that the higher percentage of directors and correlation with the ROA. Lai rights. Shareholders can borrow from banks by collateralizing the shares they own. Yang. ‧ 國. 學. supervisors pledging with the worse corporate performance and the higher variability of corporate performance.. ‧. Hypothesis 5: Higher management shareholding leads to better interest alignment between shareholders and managers, and hence, improves corporate efficiency. It might. y. Nat. decrease corporate performance, and managers become entrenched and pursue private. sit. benefits. Ko (2009) found that there is significantly positive relationship between managers’. er. io. ownership ratio and financial performance. Huang (2012) showed that ownership of managers. al. n. iv n C U votes and may select their Hypothesis 6: Seat-controlling shareholders h e n g chold h i decisive family members as board directors. If directors are not duly responsible, they may create is negatively linked to performance, especially significant in the second year after M&A.. agency problems at the expense of minority shareholders. Chi (2012) and Lin (2010) found that control of seats of the major shareholders and deviation of cash flow right are negatively related with firm performance.. 3. Empirical Analysis 3.1 Implementation of Financial Restructuring To dispose of failed financial institutions, the government promulgated and implemented the Financial Restructuring Fund Statute on July 9, 2001. The Fund's resources include government financial business tax revenue and deposited insurance premium income received 8. As a result, they become the “controlling shareholders” of a bank. 16.
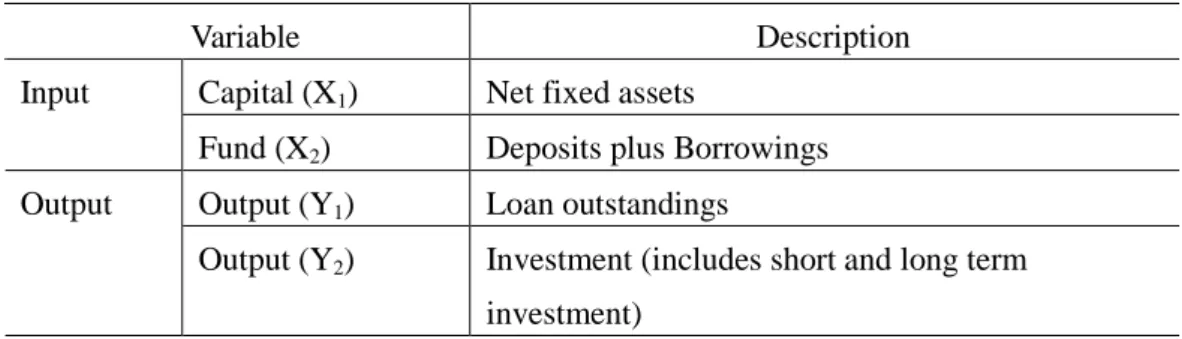
(33) from the financial sector. The financial business tax revenue spans the years 2002-2005, and is estimated to be approximately NT$120 billion. The CDIC's incremental insurance premium income spans a 10-year period from January 2002 onwards that arises as a result of the increased insurance assessment rate, effective January 1, 2000. The Fund is operative for a 3-year period from the date on which the Financial Restructuring Fund Statute is promulgated. However, the period may be extended for a further year with the approval of the Legislative Yuan. The Restructuring Fund entrusts the CDIC with the full amount required to settle the deposit-related and non-deposit-related claims on problem financial institutions with unsound operations. The Fund also entrusts CDIC with handling financial institutions with unsound operations according to the following methods: (1) Pay off the debts of financial institutions and assume their assets. (2) Pay off the debts that exceed the amount of the assets. The Restructuring Fund assumes the assets of these financial institutions and disposes of them by. 政 治 大. offering them for sale by tender, auction, or other method. Any proceeds from the disposal are included in the Restructuring Fund.. 立. When the external competitive environment has changed, the financial restructuring. ‧ 國. 學. scheme provides the opportunity to bid for banks. The scheme does not limit the participants, thereby increasing bank incentive to participate in mergers. The bank must decide whether to merge, through the market mechanism after considering their own strategy. This Financial. ‧. Restructuring Fund Statute also serves to integrate financial markets and stabilize financial conditions, and may be referred to as a regulation concerned with financial reform that is. y. Nat. sit. particularly meaningful to these times.. al. er. io. 3.2 The Static Efficiency of Bank Merger. v. n. The DEA model requires that input and output variables satisfy monotonicity.9 These. Ch. i Un. two types of variables were positively related as verified by correlation analysis. We used the. engchi. input-oriented10 model under the assumption of constant return to scale (CRS) to analyze the static efficiency for all banks in Taiwan. We then separated the estimated results of acquiring banks into banks with or without participating in the financial restructuring scheme, and analyzed their static efficiency before and after implementation of financial restructuring. Figure 2-2 shows the empirical results. 9. The DEA model typically imposes monotonic (i.e. when the input increases, output cannot be reduced) assumption. 10 There are input-oriented and output-oriented models to evaluate the productive efficiency in the DEA approach. Lovell (1993) suggested that of producers are required to meet market demand, and if they can freely adjust the input usage, then input-oriented model seems appropriate. On the contrary, if they can’t freely adjust the input usage, output-oriented model is proper. Theoretically, due to fixed budget, output-oriented model is commonly used in public sector and non-profit organization (such as hospital). Private sector, not subject to these constraints, is evaluated by input-oriented model. Therefore, we use the input-oriented DEA model to assess the bank’s efficiency in this paper since bank industry belongs to private sector and emphasize the cost-control. 17.
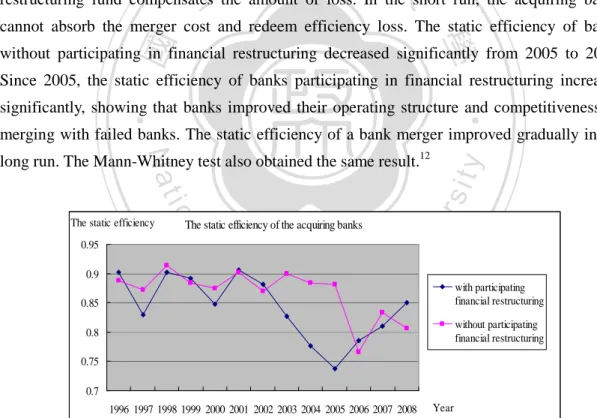
(34) The static efficiency of the SBM model belongs to the cross-sectional estimator. Because the efficiency belongs to a different efficiency frontier each year, the comparison of the efficiency comparison must perform a statistical test. We used the Mann-Whitney test to analyze whether the static efficiency of banks with or without participating in the financial restructuring scheme shows significant differences before and after the financial restructuring period. Appendix Table A2-1 lists the descriptive statistics and statistical test of static efficiency. Before implementation of the financial restructuring scheme, the static efficiency of these two types of banks showed no significant difference. The Mann-Whitney test also obtained the same result.11 After implementation of the financial restructuring scheme, the static efficiency of a bank merger by the financial restructuring scheme significantly decreased in the 2001 to 2005 period. In addition to 2001 and 2002, the static efficiency of. 政 治 大 restructuring fund compensates 立the amount of loss. In the short run, the acquiring banks. banks participating in financial restructuring was less than that of banks without participating in financial restructuring. According to the Financial Restructuring Fund Statute, the financial cannot absorb the merger cost and redeem efficiency loss. The static efficiency of banks. ‧ 國. 學. without participating in financial restructuring decreased significantly from 2005 to 2006. Since 2005, the static efficiency of banks participating in financial restructuring increased. ‧. significantly, showing that banks improved their operating structure and competitiveness by merging with failed banks. The static efficiency of a bank merger improved gradually in the. Nat. 0.9. sit. Ch. engchi. er. al. The static efficiency of the acquiring banks. n. 0.95. io. The static efficiency. y. long run. The Mann-Whitney test also obtained the same result.12. i Un. v. 0.85. with participating financial restructuring. 0.8. without participating financial restructuring. 0.75 0.7 1996 1997 1998 1999 2000 2001 2002 2003 2004 2005 2006 2007 2008. Year. Figure 2-2 The efficiency of acquiring banks with or without participating in the financial restructuring scheme. 11. Mann-Whitney test statistic is 18.000, Z-test value is 0.000, exact significance [2*(one-tailed significance)] is 1.000. 12 Mann-Whitney test statistic is 13.000, Z-test value is -1.469, exact significance [2*(one-tailed significance)] is 0.165. 18.
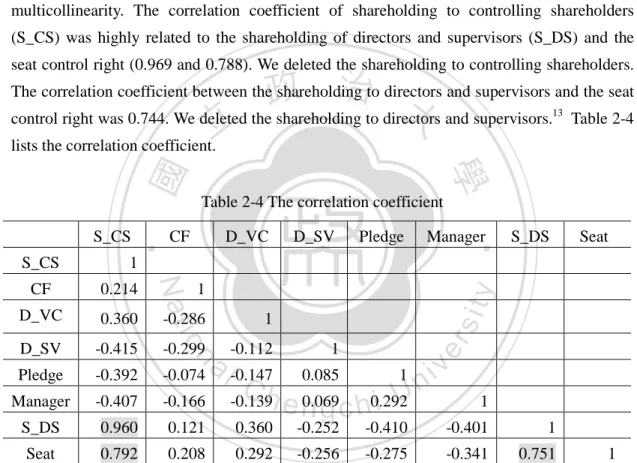
(35) 3.3 Relationship between Efficiency and Corporate Governance Characteristics We used the Tobit regression model and a bootstrapping method to study the relationship between corporate governance and static efficiency of bank mergers before and during the financial restructuring period. The study selected the identical significant corporate governance variables under the estimation method as the carry-over activities in the DSBM model. The descriptive statistics and mean difference test of explanatory variables before and after implementation of the financial restructuring scheme are listed in Table A2-2 and A2-3. 3.3.1 Correlation Analysis We again applied correlation analysis on the explanatory variables to examine multicollinearity. The correlation coefficient of shareholding to controlling shareholders (S_CS) was highly related to the shareholding of directors and supervisors (S_DS) and the seat control right (0.969 and 0.788). We deleted the shareholding to controlling shareholders.. 政 治 大 control right was 0.744. We deleted the shareholding to directors and supervisors. 立 lists the correlation coefficient.. The correlation coefficient between the shareholding to directors and supervisors and the seat 13. ‧ 國. Table 2-4 The correlation coefficient. CF. D_VC. D_SV. Pledge. Manager. ‧. 1. -0.415. Pledge. -0.392. Manager. -0.407. S_DS. 0.960. Seat. 0.792. y. D_SV. -0.286. Seat. sit. 0.360. 1. -0.299. -0.112 1 a iv -0.074 l -0.147 0.085 1 n C h e n0.069 -0.166 -0.139 i U g c h0.292. n. D_VC. 1. io. 0.214. Nat. CF. S_DS. er. S_CS. 學. S_CS. Table 2-4. 1. 0.121. 0.360. -0.252. -0.410. -0.401. 1. 0.208. 0.292. -0.256. -0.275. -0.341. 0.751. 1. 3.3.2 Quandt and Chow Test We used the Chow test and Quandt test to verify whether Taiwan financial restructuring causes structural changes in the relationship between the static efficiency of bank mergers and corporate governance in the 1996 to 2008 period. The Chow test results showed that structural changes occurred in 2002 under significance at the 1%, 5%, and 10% levels, respectively. The Quant test results also showed no structural changes, but the possible structural change point in 2002. Implementation of the Financial Restructuring Fund Statute may be one of the factors 13. Because seats concur with voting rights, this study reserves the seat control right for the explanatory variable. 19.
數據

+7
Outline
Introduction
Tobit Regression Model and Bootstrapping Method
Tobit Regression Model
The Static Efficiency of Listed Bank
Basel III and the China Banking Regulation
The Profit Efficiency Model
Definition of Z-Score
The Relationship between the Financial Regulation and Efficiency and Risk
Research Issue
相關文件
Wang, Solving pseudomonotone variational inequalities and pseudocon- vex optimization problems using the projection neural network, IEEE Transactions on Neural Networks 17
volume suppressed mass: (TeV) 2 /M P ∼ 10 −4 eV → mm range can be experimentally tested for any number of extra dimensions - Light U(1) gauge bosons: no derivative couplings. =>
For pedagogical purposes, let us start consideration from a simple one-dimensional (1D) system, where electrons are confined to a chain parallel to the x axis. As it is well known
The observed small neutrino masses strongly suggest the presence of super heavy Majorana neutrinos N. Out-of-thermal equilibrium processes may be easily realized around the
Define instead the imaginary.. potential, magnetic field, lattice…) Dirac-BdG Hamiltonian:. with small, and matrix
incapable to extract any quantities from QCD, nor to tackle the most interesting physics, namely, the spontaneously chiral symmetry breaking and the color confinement..
(1) Determine a hypersurface on which matching condition is given.. (2) Determine a
• Formation of massive primordial stars as origin of objects in the early universe. • Supernova explosions might be visible to the most
