c
World Scientific Publishing Company
FAST SEARCH ALGORITHMS FOR INDUSTRIAL INSPECTION
MING-CHING CHANG and CHIOU-SHANN FUH∗ Department of Computer Science and Information Engineering,
National Taiwan University, Taipei, Taiwan
HSIEN-YEI CHEN
Mechanical Industry Research Laboratories (MIRL), Industrial Technology Research Institute (ITRI), Hsinchu, Taiwan
This paper presents an efficient general purpose search algorithm for alignment and an applied procedure for IC print mark quality inspection. The search algorithm is based on normalized cross-correlation and enhances it with a hierarchical resolution pyramid, dynamic programming, and pixel over-sampling to achieve subpixel accuracy on one or more targets. The general purpose search procedure is robust with respect to linear change of image intensity and thus can be applied to general industrial visual inspection. Accuracy, speed, reliability, and repeatability are all critical for the industrial use. After proper optimization, the proposed procedure was tested on the IC inspection platforms in the Mechanical Industry Research Laboratories (MIRL), Industrial Technology Research Institute (ITRI), Taiwan. The proposed method meets all these criteria and has worked well in field tests on various IC products.
Keywords: Computer vision; digital image processing; normalized cross-correlation; similarity measure; alignment; subpixel accuracy; visual inspection; defect detection.
1. Introduction
Fast alignment is fundamental to the industrial application of computer vision and digital image processing. In the Integrated Circuits (IC) industry, the wafer fabrication process at the front end and chip packaging at the back end require high-precision alignment. Examples of the applications include mask exposure and defect inspection in wafer fabrication, IC print mark inspection, pin inspection, and die bonding in chip packaging. Due to the rapid increase of pin counts and circuit density, efficient and highly accurate alignment is a critical requirement.
Our purpose was to design a general purpose fast search algorithm, e.g. a software solution that will match a 128 × 128 pattern in a 640 × 480 field of view, returning one or more targets, at a computing time of 50 to 70 ms and a locating accuracy at the subpixel level. While retaining all the advantages of a normalized correlation search (NCS), the search procedure is improved by a ∗E-mail: fuh@csie.ntu.edu.tw
hierarchical approach and a dynamic programming method. Subpixel accuracy can be easily obtained by matching in the over-sampling image layers. In addition to some preprocessing tasks, the search procedure consists of a coarse search performed in the top layer and a fine search in subsequent layers, with the number of layers being a critical determinant of the effectiveness of the search. We describe how to calculate the number of layers that will optimize search results.
The proposed fast search algorithm was applied to develop the IC print mark inspection procedure. The IC marks to be inspected can include those that are rotated or translated or contain printing errors. After accurate alignment, optical verification is used to determine whether to accept or reject the inspected ICs.
Section 2 reviews the normalized correlation search plus other previous work and derives the proposed fast search algorithm, including multiple target search (Sec. 2.5) and automatic pattern selection (Sec. 2.6). Section 3 describes the IC print mark inspection procedure in detail. Section 4 presents some experimental results. Section 5 summarizes key conclusions.
2. Fast Search Algorithms
Normalized cross-correlation7can be used to match a pattern to another image. It returns the best matching position and a similarity coefficient scaled in the range −1 to 1, independent of image translation and gray-level shifting and scaling. The correlation coefficient is defined as follows: r(u, v) =
Pm i=0 Pn j=0[I(i + u, j + v)− ¯I][M(i, j) − ¯M] qPm i=0 Pn j=0[I(i + u, j + v)− ¯I]2 Pm i=0 Pn j=0[M(i, j)− ¯M]2 (1)
where m and n are the width and height of the pattern image; w and h are the width and height of the search image; r(u, v) is the correlation coefficient; {M(i, j)|0 ≤ i < m, 0≤ j < n} is the pattern image, {I(i, j)|0 ≤ i < w, 0 ≤ j < h} is the search image, and{I(i + u, j + v)|0 ≤ i < m, 0 ≤ j < n} is the matching subimage of the search image. The correlation coefficient is a 2D function with range:
0≤ u < (w − m + 1), 0 ≤ v < (h − n + 1) .
Position (umax, vmax) is the best matching position, if r(umax, vmax) ≥ r(u, v),
∀u, v. Region {I(i + umax, j + vmax)|0 ≤ i ≤ m, 0 ≤ j ≤ n} is a subimage of I best
matching image Mm×n. Coefficient r = 1 means a perfect match: I(u, v) = αM+β,
where α and β are the linear scaling and shifting of the intensity; r =−1 means an inverse perfect match.
Normalized correlation search is well suited to alignment13 because of its:
• Independence of linear brightness change − independence of brightness shift − independence of brightness scaling • Absolute matching value
• High repeatability: σposition≤ 0.05 pixel
• Immunity to image defects
• Tolerance of image distortion due to rotation or scaling • Excellent discrimination ability
• Tunability to appropriate feature scale • High immunity to scene clutter • Computational efficiency.
Computing the original normalized cross-correlation requires a square root cal-culation. Discarding the square root calculation and ignoring the inverse matching, we define the new correlation factor CF(u, v) for similarity measure13:
CF(u, v) = max(r(u, v), 0)2 (2)
0≤ CF(u, v) ≤ 1 .
Compared to other similarity measure methods, such as the sum of absolute difference (SAD),2,12 NCS is superior for its tolerance to intensity change and its
absolute similarity measure. These properties make NCS more powerful and robust in practical use, even when crucial lighting condition changes.
r(u, v) =
Pm i=0
Pn
j=0[I(i + u, j + v)M(i, j)− I(i + u, j + v) ¯M− ¯IM(i, j) + ¯I ¯M] qPm i=0 Pn j=0[I2(i + u, j + v)− I(i + u, j + v)¯I] qPm i=0 Pn j=0[M2(i, j)− M(i, j) ¯M] . (3)
2.1. Dynamic programming to speed-up normalized cross-correlation
Box filtering10as a dynamic programming (D.P.) technique can greatly reduce the
redundant calculation of the original normalized cross-correlation.15 Rearranging
Eq. (1) to Eq. (3) and multiplying both the numerator and the denominator by factor N = m× n, we get Eq. (5l ), where N ¯M = Pmi=0Pnj=0M(i, j), N¯I = Pm
i=0
Pn
j=0I(i + u, j + v). Constants ¯I and ¯M are moved out as in Eq. (6). Finally
we get Eq. (7) with seven main terms.
Among the seven main terms of Eq. (7), the three involving the pattern image M, Ppim, Ppim2, and (Ppim)2 can be computed after the pattern image is
assigned. The three terms involving the search image I, D.P.Pim, D.P.Pim2,
and (D.P.Pim)2 can be computed by the D.P. method in the preprocessing step.
The dominating term of the correlation is the multiplication of (P Pim×pim) of complexity O(m× n × w × h). The computation here is greatly reduced by the resolution pyramid technique, as described in Sec. 2.2.
The box filtering D.P. approach is explained here. As shown in Fig. 1 and Eq. (4), only four operations are required to compute the sum of pixels of any specific area A of an image.
ˆ
a
h
e
f
g
b
c
d
A
i
Fig. 1. D.P. to compute the sum of pixels of any specific area A.
r(u, v) = N m P i=0 n P j=0 I(i + u, j + v)M(i, j)− N m P i=0 n P j=0 I(i + u, j + v) ¯M s N m P i=0 n P j=0 [I2(i + u, j + v)− I(i + u, j + v)¯I] s N m P i=0 n P j=0 [M2(i, j)− M(i, j) ¯M] (5) r(u, v) = N m P i=0 n P j=0 I(i + u, j + v)M(i, j)− m P i=0 n P j=0 I(i + u, j + v))(N ¯M ! s N m P i=0 n P j=0 I2(i + u, j + v)−(N¯I)Pm i=0 n P j=0 I(i + u, j + v) s N m P i=0 n P j=0 M2(i, j)− (N ¯M)Pm i=0 n P j=0 M(i, j) (6) r(u, v) = Dominating Term z }| { N m X i=0 n X j=0 I(i + u, j + v)M(i, j)− D.P.Pim z }| { Xm i=0 n X j=0 I(i + u, j + v) P pim z }| { Xm i=0 n X j=0 M(i, j) v u u u u u u u u u t N m X i=0 n X j=0 I2(i + u, j + v) | {z } D.P. Pim2 − m X i=0 n X j=0 I(i + u, j + v) | {z } D.P. Pim 2 v u u u u u u u u u t N m X i=0 n X j=0 M2(i, j) | P{z } pim2 − m X i=0 n X j=0 M(i, j) | P{z } pim 2 (7) where aceg, abfg, acdh, and abih are the sums of pixels in the respective rectangle areas; ˆe, ˆf , ˆd, and ˆi are sums of all upper-left pixels of the points; and ˆA is the sum of all pixels in area A.
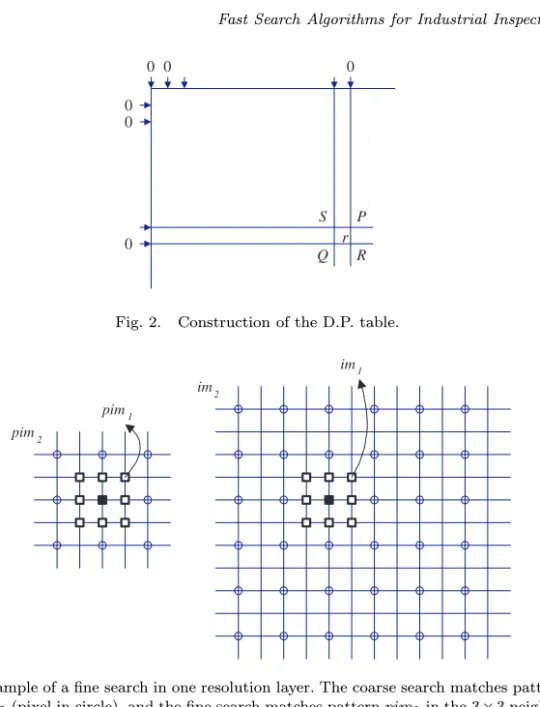
0 0 0 0 0 0 S P Q R r
Fig. 2. Construction of the D.P. table.
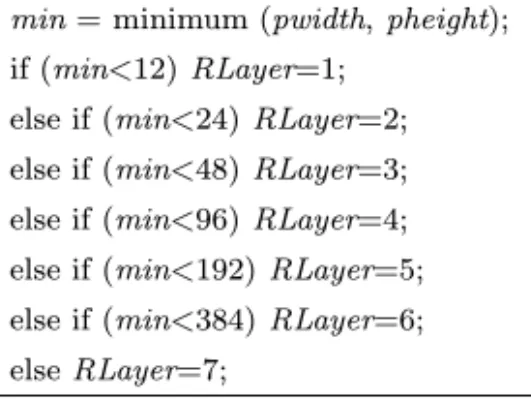
pim1 pim2
im1 im2
Fig. 3. Example of a fine search in one resolution layer. The coarse search matches pattern pim2 in image im2(pixel in circle), and the fine search matches pattern pim1in the 3× 3 neighborhood of the matching point in image im1(pixel in bold square).
The construction of the D.P. table is accomplished efficiently by summing up pixels step by step as shown in Fig. 2 and Eq. (8):
ˆ
R = ˆP + ˆQ− ˆS + r (8)
where r is the pixel value of the location R; and ˆS, ˆP , ˆQ, ˆR are values from the D.P. table at those positions. Due to the nature of the pixel summing, it is important to avoid overflow. We do so by constructing one or more D.P. tables depending on the image size in the C++ program implementation.
2.2. Resolution pyramid/hierarchical search
Resolution pyramid/hierarchical search is an effective approach to handling the heavy computation required by NCS.13,15 While retaining all the advantages of NCS, such as tolerance to linear brightness change, excellent reliability, and absolute similarity value, it is fast and can be extended easily to achieve subpixel accuracy.
Table 1. Speed comparison of two distinct cases in the hierarchical search. coarse search fine search search for a large pattern high speed-up factor; high computational
in a large range high r (fast) cost (dominating) search for a small pattern low speed-up factor; low computational
in a large range low r (dominating) cost (fast)
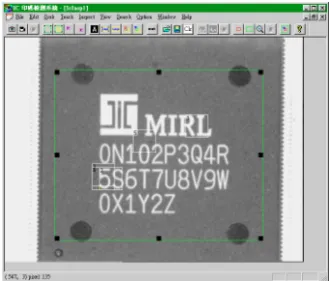
Table 2. The pseudocode that de-cides the number of resolution layers (RLayer) from pattern width (pwidth) and pattern height (pheight).
min = minimum (pwidth, pheight); if (min<12) RLayer=1;
else if (min<24) RLayer=2; else if (min<48) RLayer=3; else if (min<96) RLayer=4; else if (min<192) RLayer=5; else if (min<384) RLayer=6; else RLayer=7;
The coarse search is performed fully in the top layer, whereas subsequent fine searches are performed only near the matching points of the lower layers. Figure 3 shows an example of a fine search in a lower resolution layer.
In the resolution pyramid approach, searching in the subsampling layer is 24=
16 times faster than in the previous layer. Let the total pyramid layer be r; the coarse search is faster than the original brute-force search by a factor of 16(r−1), thus
reducing global search time dramatically. Time needed for the fine search depends on the size of the pattern image.
In Table 1, two distinct cases of searches for a large pattern and for a small pattern are compared. For the best results, a balance must be struck between increasing the layer r and retaining enough pattern features. Section 2.3 discusses how to arrive at a suitable balance in implementing the adaptive resolution pyramid approach.
2.3. Adaptive resolution pyramid search
We determine the layer r adaptively according to the width and height of the pattern image. The smaller of the pattern width and height in the top pyramid layer, pwh, is selected to be the criterion to decide r. The pwh is always selected to be even for ease of computation. Referring to the experimental results,3,4pwh = 4 is too small
for the pattern image to contain enough information in the coarse search. Since a pwh of 12 can be reduced to 6 by subsampling, pwh is always set to 6, 8 or 10, thus establishing the pyramid layer r. Table 2 shows the pseudocode that determines r;
Table 3. The calculation of the layer boundary, where pwh is the smaller of the pattern width and height in the top layer.
min RLayer pwh min RLayer pwh
1-8 1 2,4,6,8 80–95 4 10 9-11 1 10 96–127 5 6 12-15 2 6 128–159 5 8 16-19 2 8 160–191 5 10 20-23 2 10 192–255 6 6 24-31 3 6 256–319 6 8 32-39 3 8 320–383 6 10 40-47 3 10 384–511 7 6 48-63 4 6 512–639 7 8 64-79 4 8 640–767 7 10
the boundary values 12, 24, 48, 96, 192, and 384 are calculated from Table 3. All calculation is made in the preprocessing steps after the pattern image is assigned.
2.4. Subpixel accuracy
Typically 0.5 to 0.25 subpixel accuracy is easily obtained by image over-sampling. Bilinear interpolation7 is used here for speed. The fine search in the subpixel
matching requires four times more calculation than needed for the previous layer without affecting the performance significantly. In addition, 2D quadratic interpolation can be used to estimate the matching point even more accurately.7
2.5. Multiple target search
By tracking multiple matching candidates in the search, a multiple target search can be achieved. In each step of fine search, selection sort is performed to pick up the most matching targets, with early jump-out to save time. Proper thresholds for similarity assessment must be specified in each step. A threshold of maximum matching points or minimum matching score can be used here. Table 4 explains options and parameters for different search purposes. Figure 4 shows an example of a multiple target search on an IC image.
2.6. Automatic pattern selection
Automatic pattern selection helps to assign the best pattern by using the similarity measure of the correlation. A unique pattern eliminates ambiguity and improves the reliability of alignment.6The pattern selection algorithm is described as follows:
1. for each point, calculate the position score for local uniqueness:
Table 4. Options and parameters for multiple target search. COARSE SEARCH is used to perform coarse search only. SEARCH ONE FAST is the most common option to match a unique target quickly. SEARCH ONE is used to search for three targets in the coarse layer and get one final matching point in the finer layers. SEARCH MN searches for multiple targets by specifying the number of coarse and fine search targets. SEARCH MC searches for multiple targets by specifying the minimum matching score of both the coarse and fine searches. AUTO SEARCH is used to search with default parameters. Combinations of these options can be adopted for different applications.
Option Parameter Description
COARSE SEARCH coarse search only
SEARCH ONE FAST search for one target with early jump out SEARCH ONE nCoarseTarget=3 search for one target exactly and robustly
nSearchTarget=1
SEARCH MN nCoarseTarget=10 coarse search for 10 targets and fine search nSearchTarget=5 for 5 targets among them
SEARCH MC dCoarseMinCF=0.2 coarse search for CF≥ 0.2 and fine search dSearchMinCF=0.5 for CF ≥ 0.5 among them
AUTO SEARCH dCoarseMinCF=0.2 automatic search with default parameters nCoarseTarget=10
dSearchMinCF=0.5
Fig. 4. Example of a multiple target search on an IC image. The pattern is the print mark “0” at the lower left corner. Five targets are returned as a result. The print mark “0” at the upper-left corner gets the highest matching score, and the print marks “C”, “D”, and “G” get lower matching scores. (Parameter SEARCH MN, dCoarseTarget=10, dSearchTarget=5 is used.)
2. select the maximum nc candidates according to the position score
3. for the nc candidates, search globally to calculate the uniqueness score:
uniqueness score = 1− secondCF (10)
4. select the maximum nppatterns from the nccandidates and return the positions
Fig. 5. Example of an automatic pattern selection. The returned unique patterns are shown in the numbers from 1 to 5.
In Eq. (9), max8CF is the largest correlation score among the eight neighbors of that point, so (1− max8CF ) represents the local uniqueness. The variance score stands for the contrast of the candidate pattern. For ease of computing, we define the variance score as the difference of the highest and the lowest gray-levels of the pattern candidate. In Eq. (10), the secondCF is the largest correlation score in the range except the best match itself, so (1− secondCF ) stands for global uniqueness. Figure 5 shows an example of automatic pattern selection (nc= 25, np= 5).
3. Procedure Applied to IC Print Mark Quality Inspection
To illustrate the application of fast search algorithms, we describe below how the proposed method can be used in IC print mark quality inspection. The print mark includes a logo pattern and characters. Due to alignment error of the inspection machine, the IC can be slightly rotated or translated. The most common printing errors under inspection are distortion, uneven inking, incorrect position, double printing, smearing, poor contrast (global or partial character), misprinting, and misorientation, as illustrated in Figs. 6 and 7.1,4
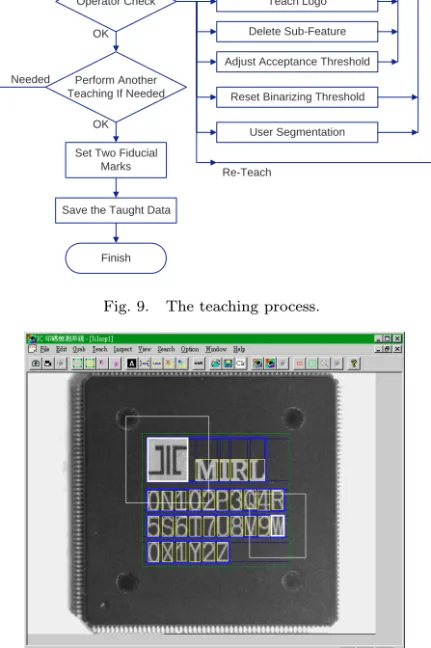
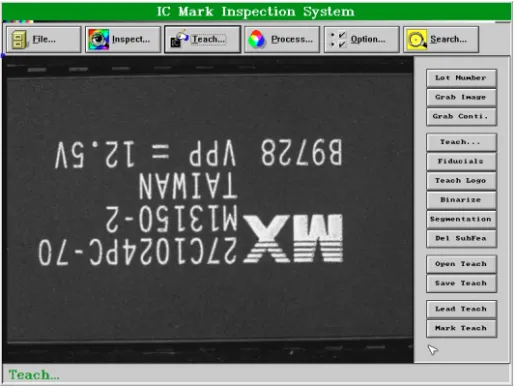
The inspection procedure includes a teaching step (Fig. 9) and an inspect-ing step (Fig. 11). In the teachinspect-ing step, the operator selects a good IC sample and sets some parameters under a GUI (Graphical User Interface) environment. The system then performs character segmentation by projection,8 as shown in
Fig. 8. The proper binarizing threshold is automatically detected in this step by minimizing within-group variance.8
In the teaching step, the characters or logos after segmentation are called subfeatures,5 which are the basic units under inspection. Two fiducial marks are
selected from the subfeatures to be the search patterns for alignment.5Translation
and slight rotation (typically −15◦ to +15◦) of the tested image can be adjusted by the two fiducial marks. Figure 10 shows the extracted features after the teaching step.
Fig. 6. IC print mark errors.1
Fig. 7. Main IC print mark errors: (a) good, (b) smeared, (c) scraped, (d) double printed, (e) broken, (f) missing ink, (g) bad contrast, (h) misprint, (i) partial bad contrast, and (j) misorientation.
Grab a Golden Image Teach
Finish Set Inspection Range
Auto-Thresholding
Character Segmentation (Noise Filtering)
Set Two Fiducial Marks Operator Check
Reset Binarizing Threshold Delete Sub-Feature
Save the Taught Data No Perform Another Teaching If Needed OK Needed OK
Set Parameters If Needed
User Segmentation Adjust Acceptance Threshold
Teach Logo
Re-Teach
Fig. 9. The teaching process.
Fig. 10. The extracted features after the teaching step. Two fiducial marks are selected to detect IC translation and rotation. The fiducial marks are enclosed by the bold rectangles; the search ranges are the thin rectangles. By calculating the slope angle of the two fiducial marks and comparing it with the taught data, we can determine the translation and rotation of the tested IC image.
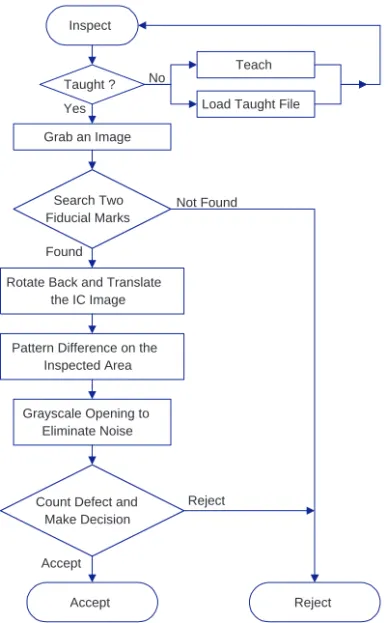
Inspect
Accept Grab an Image
Rotate Back and Translate the IC Image
Pattern Difference on the Inspected Area
Taught ?
Teach
Load Taught File
Grayscale Opening to Eliminate Noise
Count Defect and Make Decision Reject Reject Yes No Search Two Fiducial Marks Found Not Found Accept
Fig. 11. The inspection process.
In the inspecting step, morphological opening8 is performed to eliminate the
edge noise after image difference.5 The last step is to count defects and take a
decision to accept or reject.
4. Experimental Results
In Figs. 12–15, the tested IC images are obtained from the field test of the inspection platform. Figure 12 shows the good IC image, Fig. 13 shows the extracted data in the teaching step, Fig. 14 shows the defective IC print mark with partial bad contrast, and Fig. 15 displays the result of the inspection.
Table 5 shows the approximate time profile of our inspection procedure on an in-dustrial computer using a Pentium 200 MHz MMX CPU. Compared to other visual inspection systems,1,9,11,14 the proposed system achieves superior performance in inspecting various IC products, as measured by reliability, repeatability, false alarm rate, and misdetection rate. Our system has undergone rigorous industrial tests. It
Fig. 12. The good IC image.
Fig. 13. The extracted data from the good IC image.
has been transferred to several IC equipment manufacturers in Taiwan, and is now in successful operation in several commercial systems. For example, Gallant Pre-cision Machining Company Limited. (http://www.gmpcorp.com.tw) has applied it to the inspection of laser marks. Contrel Inc. has transferred this technology for advanced applications. A recent significant achievement, to cite another example, is the use of the fast search algorithms in the inspection of color filter panels.16
Fig. 14. The defective IC print mark with partial bad contrast.
Fig. 15. Inspected result of the defective IC. The defect is successfully detected. The inspection time is 205 ms on average.
Table 5. The approximate time profile of the inspection of one print mark.
the inspection steps time (ms)
1.grab the IC image 50
2.search for two fiducial marks 50 3.clip and rotate the image 30 4.perform pattern difference 10
5.perform opening 80
6.count defect, accept/reject 20
5. Conclusions
Accurate, reliable inspection is critical to industrial production. In this paper, we propose a general purpose fast search algorithm for industrial inspection. Based on normalized cross-correlation, the search algorithm is accelerated by an adaptive hierarchical resolution pyramid and dynamic programming. The proposed method features subpixel accuracy, multiple target search, and automatic pattern selection. Field tests have shown that the search procedure is reliable and works well in IC print mark quality inspection. Applying the proposed method to other visual inspection and matching is both powerful and straightforward.
Acknowledgment
This research was supported by the National Science Council of Taiwan, R.O.C., under Grant NSC 88-2213-E-002-031, by Mechanical Industry Research Laboratories, Industrial Technology Research Institute, under Grant MIRL 893K61CE1, by the EeRise Corporation, Tekom Technologies, Arima Computer, and Ulead Systems.
References
1. Applied Intelligent Systems, “ValidMark automated print inspection application overview,” 1990.
2. D. I. Barnea and H. F. Silverman, “A class of algorithms for fast digital image registration,” IEEE Trans. Comput. C-21 (1972) 179–186.
3. M. C. Chang, H. Y. Chen and C. S. Fuh, “IC printed mark quality inspection algorithms,” Proc. Conf. Computer Vision, Graphics, Image Processing, Taichung, Taiwan, 1997, pp. 540–547.
4. M. C. Chang, H. Y. Chen and C. S. Fuh, “Fast search algorithms for IC printed mark quality inspection,” Proc. IAPR Workshop on Machine Vision Applications, Chiba, Japan, 1998, pp. 183–188.
5. E. A. Chemaly, “Feature inspection using normalized cross correlation and mathe-matical morphology,” Motorola, 1991.
6. Cognex Corporation, “Auto-train,” Vision Tools, 1996.
7. R. C. Gonzalez and R. E. Woods, Digital Image Processing, Addison Wesley, Reading, MA, 1992.
8. R. M. Haralick and L. G. Shapiro, Computer and Robot Vision, Vol. I, Addison Wesley, Reading, MA, 1992.
9. Imaging Technology, “ITEX/MARK symbology inspection software,” 1992.
10. M. J. McDonnell, “Box-filtering techniques,” Comput. Graph. Imag. Proc. 17 (1981) 65–70.
11. D. P. Mital and T. E. Khwang, “An intelligent vision system for inspection of packed ICs,” Proc. Int. Conf. — TENCON, Bombay, India, 1989, pp. 1003–1006.
12. B. Pudipeddi, A. L. Abbott and P. M. Athanas, “Real-time hierarchical visual tracking using a configurable computing machine,” Proc. Conf. Computer Architectures for Machine Perception, Cambridge, MA, USA, 1997.
13. W. M. Silver, “Alignment and gauging using normalized correlation search,” Cognex Corporation, 1990.
14. B. E. Smyth, “Combining linear and nonlinear algorithms to do font quality verification,” Proc. Robots and Vision Conf., Detroit, Michigan, 1988, pp. 13.1–16. 15. C. Sun, “A fast stereo matching method,” Proc. Digital Image Computing: Techniques
and Applications, Auckland, New Zealand, 1997, pp. 95–100.
16. M. H. Wu, C. S. Fuh and H. Y. Chen, “Defect inspection and analysis of color filter panel,” Imag. Recogn. 6, 2 (2000) 74–90.
Ming-Ching Chang received the B.S. degree in civil engineering in 1996 and the M.S. de-gree in computer sci-ence and information engineering in 1998, all from National Taiwan University, Taipei. He is currently a teaching as-sistant at the university and will be pursuing Ph.D. study in Brown University, Providence, RI, in 2001.
His current research interests include com-puter vision, digital image processing, and pattern recognition.
Chiou-Shann Fuh re-ceived the B.S. degree in computer science and information engineering from National Taiwan University, Taipei, in 1983, the M.S. degree in computer science from Pennsylvania State Uni-versity, in 1987, and the Ph.D. degree in computer science from Har-vard University, in 1992. He was with AT&T Bell Laboratories and engaged in perfor-mance monitoring of switching networks from 1992 to 1993. He was an associate professor in the Department of Computer Science and In-formation Engineering, National Taiwan Uni-versity, from 1993 to 2000 and then promoted to a full professor.
His current research interests include digital image processing, computer vi-sion, pattern recognition, and mathematical morphology.
Hsien-Yei Chen re-ceived the M.S. degree in electrical engineering from the NCHU, Hsin-chu, Taiwan, in 1986. From 1988 to 2000, he worked at Industrial Technology Research Institute, Taiwan, as a researcher and project leader. Now he is a project manager in Eerise Corporation, Taipei.
His research interests involve machine vision and automated optical inspection.