This article was downloaded by: [National Chiao Tung University 國立交通大學] On: 28 April 2014, At: 03:22
Publisher: Taylor & Francis
Informa Ltd Registered in England and Wales Registered Number: 1072954 Registered office: Mortimer House, 37-41 Mortimer Street, London W1T 3JH, UK
Journal of Toxicology and
Environmental Health, Part A:
Current Issues
Publication details, including instructions for authors and subscription information:
http://www.tandfonline.com/loi/uteh20
THE PREVALENCE OF GIARDIA
AND CRYPTOSPORIDIUM IN
TAIWAN WATER SUPPLIES
Bing-Mu Hsu, Chihpin Huang, Guo-Ying Jiang, Chih-Li Lilian Hsu
Published online: 30 Nov 2010.
To cite this article: Bing-Mu Hsu, Chihpin Huang, Guo-Ying Jiang, Chih-Li Lilian Hsu (1999) THE PREVALENCE OF GIARDIA AND CRYPTOSPORIDIUM IN TAIWAN WATER SUPPLIES, Journal of Toxicology and Environmental Health, Part A: Current Issues, 57:3, 149-160, DOI: 10.1080/009841099157728
To link to this article: http://dx.doi.org/10.1080/009841099157728
PLEASE SCROLL DOWN FOR ARTICLE
Taylor & Francis makes every effort to ensure the accuracy of all the information (the “Content”) contained in the publications on our platform. However, Taylor & Francis, our agents, and our licensors make no
representations or warranties whatsoever as to the accuracy, completeness, or suitability for any purpose of the Content. Any opinions and views expressed in this publication are the opinions and views of the authors, and are not the views of or endorsed by Taylor & Francis. The accuracy of the Content should not be relied upon and should be independently verified with primary sources of information. Taylor and Francis shall not be liable for any losses, actions, claims, proceedings, demands, costs, expenses, damages, and other liabilities whatsoever or howsoever caused arising directly or indirectly in connection with, in relation to or arising out of the use of the Content.
This article may be used for research, teaching, and private study purposes. Any substantial or systematic reproduction, redistribution, reselling, loan, sub-licensing, systematic supply, or distribution in any form to anyone is expressly forbidden. Terms & Conditions of access and use can be found at http:// www.tandfonline.com/page/terms-and-conditions
THE PREVALENCE OF GIARDIA AND CRYPTOSPORIDIUM IN TAIWAN WATER SUPPLIES
Bing-Mu Hsu, Chihpin Huang, Guo-Ying Jiang
Institute of Environmental Engineering, National Chiao Tung University, Hsinchu, Taiwan, Republic of China
Chih-Li Lilian Hsu
Department of Parasitology, Medical College, National Cheng Kung University, Tainan, Taiwan, Republic of China
Giardia and Cryptosporidium have emerged as waterborne pathogens of concern. Thirty-one water samples were collected from nine potable water treatment plants in Taiwan and investigated for the presence of Giardia cysts and Cryptosporidium oocysts. The immunofluorescence assay was used for the simultaneous detection of cysts and oocysts. The frequency of occurrence of cysts was 77.8% for Giardia and 72.2% for Cryptosporidium in 18 raw water samples. Ten out of 13 samples collected from treated water samples showed the presence of cysts, while in 5 out of 13 treated water samples oocysts were detected. The risk assessment for adverse human effects arising from the presence of cysts and oocysts indicates the possibility of waterborne transmission of Giardia and Cryptosporidium infection in Taiwan if water is not adequately treated. The protozoan parasites Giardia and Cryptosporidium have been recog-nized as common pathogenic protozoa of the gastrointestinal tract (Cook, 1995). Many outbreaks of giardiasis and cryptosporidiosis have been re-ported in the last few decades (Frost et al., 1996; SoloGabriele & Neu-meister, 1996; Kramer et al., 1996). Human infection with these pathogens is usually through either direct dermal contact or ingestion of contaminated food and/or water (Donnelly & Stentiford, 1997; Pell, 1997). Water is per-haps the major route for massive outbreaks of pathogen infection, as a result of contamination of either raw or treated water (Teunis et al., 1997; Eisenberg et al., 1998; Perz et al., 1998). Despite the difficulties in analyti-cal procedures, it has generally been accepted that the number of Giardia vary from 0.04 to 66 cysts/L (LeChevallier & Norton, 1995) and for
Cryp-tosporidium from 0.005 to 252.7 oocysts/L for surface waters (Rose, 1988;
Stetzenbach et al., 1988). Because the assay for pathogen detection does not indicate parasite viability, it is hard to determine if the water sources
149
Journal of Toxicology and Environmental Health, Part A, 56:149–160, 1999 Copyright © 1999 Taylor & Francis
0098-4108/99 $12.00 + .00
Received 14 September 1998; sent for revision 16 October 1998; accepted 20 January 1999. This work was funded by the Environmental Protection Administration, Republic of China. We are grateful to Dr. Meilin Yu for her assistance in statistical analysis, and to Dr. Jill Ruhsing Pan and Dr. Walter J. Rogan for their editing.
Address correspondence to C. P. Huang, Institute of Environmental Engineering, National Chiao Tung University, Hsinchu, Taiwan, Republic of China. E-mail: cphuang@green.ev.nctu.edu.tw
serve as a source of risk from waterborne pathogens (Teunis et al., 1997; Morris et al., 1998).
Information pertaining to Giardia and Cryptosporidium in the drinking water supply systems in Taiwan is very limited. The first case of giardiasis in Taiwan was discovered in 1975 on an offshore island. Thirty-two per-cent of the children residing on the island were diagnosed with Giardia in their stool specimens (Chung & Cross, 1975). Another survey showed that over 50% of the avian species in Taiwan were infected with
Cryptosporid-ium spp. (Wang & Liew, 1990).
A normal Giardia cyst is characteristically oval in shape, ranging from 8 to 14 µm in diameter. Cryptosporidium oocysts, which range from 4 to 6 µm in diameter, are approximately spherical. The thick-walled cysts and oocysts are both more resistant to commonly used disinfectants than are other microbes (Haas et al., 1994). Korich et al. (1990) also found that the oocysts are more resistant than cysts to disinfectants. Recent studies have shown that ozone is more efficient than chlorine in the inactivation of
Giardia cysts and Cryptosporidium oocysts (Chiou et al., 1997; Liyanage
et al., 1997a, 1997b).
In this study, an immunofluorescence assay (AWWA, 1994) was used for detecting Giardia and Cryptosporidium. Some parameters of water quality, including pH, turbidity, conductivity, temperature, heterotrophic bacteria, and total coliforms, were also determined. The correlation was analyzed between the concentration of protozoan parasite and these water-quality parameters. The concentrations of cysts and oocysts in the treated water were applied to the risk analysis equation to calculate the risk of human infection from Giardia and Cryptosporidium in drinking water supplies.
MATERIALS AND METHODS
Water samples were taken from nine potable water treatment plants in Taiwan during a 2-yr period (from July 1996 to January 1998). The dis-tribution of the nine water treatment plants in Taiwan is shown in Figure 1. Taiwan is generally divided into three areas: northern, central, and south-ern parts. Two water treatment plants are located in northsouth-ern Taiwan, and another two are in the central part. The remaining five plants are in the southern area. In the first phase, six raw and four treated water samples in total were collected from two water treatment plants in northern Taiwan that used different river water as water sources. In the second phase, six raw and four treated water samples were taken in total from the two water treatment plants in central Taiwan, which drew water from reservoirs. In the third phase, 11 samples (6 raw water samples and 5 treated water samples) were collected from 5 different water treatment plants from the same water-shed in southern Taiwan.
The sampling method and detecting procedure were adopted from the guidelines enumerated in the American Water Works Association manual (AWWA, 1994). For the detection and identification of Giardia cysts and
150 B.-M. HSU ET AL.
Cryptosporidium oocysts, an indirect immunofluorescent antibody assay
(IFA) specified in the AWWA (1994) manual as an Information Collection Rule (ICR) was used. To determine the recovery efficiency, cysts and oocysts were prepared and then counted with a calibrated hemacytometer. The tests were done by spiking with 9.37 × 10⁵ cysts and 8.14 × 10⁴ oocysts
into treated water, followed by identical procedures carried out to iden-tify and enumerate the parasites (AWWA, 1994). The concentrated water samples were labeled with monoclonal antiserum (Hydrofluor™ Combo
Giardia/ Cryptosporidium; Ensys, Inc., Research Triangle Park, NC) and
examined by epifluorescent microscopy at 200×, 400×, or 1000× magnifi-cation (Olympus, Tokyo, Japan). Cysts and oocysts were identified using the following characteristics: size, shape, surface feature, and staining reaction. The candidates exhibiting the right size and shape were screened and categorized according to their internal morphological features by epi-fluorescent microscopy under a bright field.
Water temperature and pH were measured on site using a portable pH meter (PHM201, Radiometer Analytical SA, France). Turbidity was measured using a ratio turbidimeter (HACH Co., Loveland, CO). Heterotrophic bacte-ria were measured by the spread method (APHA, 1995). Total coliforms were measured by membrane filtration procedures described by the Standard Method for the Examination of Water and Wastewater (method 9222 B in APHA, 1995).
The number of cysts and oocysts observed microscopically was re-corded and normalized to the number of cysts per 100 L and the number of oocysts per 100 L. The recovery efficiencies were not used in the cal-culations of parasite concentrations (LeChevallier et al., 1991; Crabtree et al., 1996), and all the values under the detection limit were treated as
PROTOZOA IN TAIWAN WATER SUPPLIES 151
FIGURE 1. Sampling water treatment plants in three different parts of Taiwan (north, center, and
south). Abbreviations: S. S., Shuang Shi; P. H., Pan Hsing; D. S., Dung Sing; F. Y., Feng Yuan; C. S., Chiya-Shien, P. D., Pying-Ding; C. C., Cheng-Ching; U. G., Ueng Gungyuan; K. T., Kau-Tan.
zero. Spearman R correlation coefficients were calculated between the concentrations of cysts/oocysts and the water-quality parameters such as heterotrophic bacteria, total coliforms, and turbidity, using STATISTICA soft-ware (supplied by StatSoft, Inc., Tulsa, OK).
The risk of infection by protozoan parasites in drinking waters depends upon (1) the concentration of cysts or oocysts in the drinking water, (2) the recovery efficiencies of the detection methods, (3) the viability of cysts or oocysts, and (4) the daily consumption of unboiled tap water. For a given treated water sample, the individual daily dose (N) may be calculated as (Teunis et al., 1997)
N = C × 1/R × I × V (1) where C is the concentration of cysts or oocysts in the treated water, R is the recovery efficiency of the detection method, I is the viability of the patho-gen, and V is the daily individual consumption of unboiled drinking water.
In order to obtain reliable risk assessment values, the individual dose must be estimated based upon parasite concentrations in the drinking water and the amount of water consumed over the exposure period (Teunis et al., 1997). The exponential assessment model of Eq. (2) was used to predict the number of cases of illnesses resulting from the measured levels of parasites. This microbiological model of infectivity was proposed by Furumoto and Mickey (1967) and has been used successfully to assess the risk of infection from Giardia and Cryptosporidium (Regli et al., 1991; Rose et al., 1991; Haas et al., 1994; DuPont et al., 1995). The equation is
P = 1 – exp(–rN) (2) where r is a coefficient. The r value for Giardia is 0.0105 and was adopted by the Federal-Provincial Subcommittee on Drinking Water (1998). The r value for Cryptosporidium, 0.00419, proposed by Haas et al. (1996) was adopted in our study. P is the potential daily risk; N is the daily dose, and it was assumed that a person drank 2 L of water per day.
An annual risk for infection could be calculated (Federal-Provincial Subcommittee on Drinking Water, 1998):
PA= 1 – (1 – P)365 (3)
where PA is the annual risk and P is the daily risk.
RESULTS
Distribution of Protozoa and Water Quality Parameters in Water Samples
Limited by the budget of this study, it was only possible to collect 31 water samples from 9 water treatment plants. However, the sampling sites
152 B.-M. HSU ET AL.
were carefully selected to reflect the most polluted water sources and pop-ulation at risk. The parasite concentrations and water quality data are listed in Table 1. All six raw water samples from northern Taiwan contained
Giardia and four of these contained Cryptosporidium. The counts ranged
from 1.6 to 40 cysts/100 L and from less than 2.3 to 40 oocysts/100 L for
Giardia and Cryptosporidium, respectively. In central Taiwan, Giardia was
detected in three out of six raw water samples. The counts ranged from less than 4 to 26 cysts/100 L. Six raw water samples tested positive for
Cryptosporidium with counts ranging from less than 4 to 48.9 oocysts/100
L. In southern Taiwan, out of 6 raw water samples, 5 were Giardia positive and 4 were Cryptosporidium positive, with counts ranging from less than 21.2 to 311.6 cysts/100 L and from less than 21.2 to 801.4 oocysts/100 L, respectively. Overall, the percentage of cyst-positive samples was 77.8% and of oocyst-positive samples 72.2% among the 18 (number from all 3 phases) raw water samples. For the 13 treated water samples (from all 3 phases), the incidence was 76.9% for cysts and 38.5% for oocysts.
Table 2 lists the means and standard deviations of parasite concentra-tions and the water-quality parameters from different locaconcentra-tions. Raw water samples taken from southern Taiwan showed higher concentrations of cysts and oocysts than samples from the other two regions. These water sources are also more polluted, as indicated by heterotrophic bacteria, total coliforms, conductivity, and turbidity.
Relationship between Protozoan Parasites and Water Quality Parameters
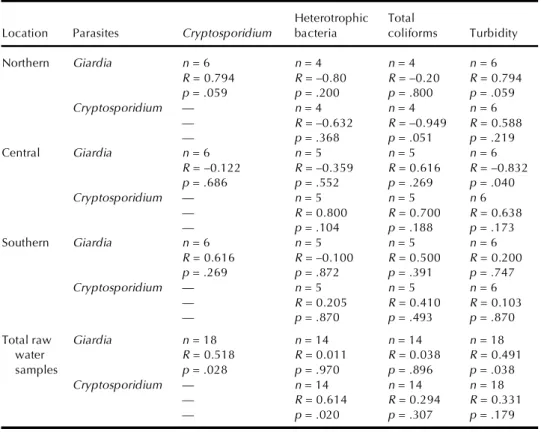
Table 3 shows the correlation coefficients between protozoan parasites and some water-quality parameters (heterotrophic bacteria, total col-iforms, and turbidity) in raw water samples. For northern Taiwan, signifi-cant correlations were shown between both protozoan parasites, and be-tween Giardia concentration and the turbidity levels in raw water samples. For central and southern Taiwan, however, neither cysts nor oocysts dis-played significant positive correlation with these water-quality parameters. This may be due to differences in the type of water sources and the small number of samples.
For all raw water samples in the three areas, the correlation coeffi-cient between oocysts and cysts was 0.518 (n = 18, p = .028). The mean concentration of oocysts was 1.38 times more than that of cysts. Positive correlations were found between the Giardia concentrations and turbidity levels (n = 18, R = 0.491, and p = .038) and between Cryptosporidium and heterotrophic bacteria (n = 14, R = .614, and p = .020).
Removal of Protozoan Parasites and the Risk from Giardiasis and Cryptosporidiosis Infections
By comparing the concentrations of parasites between raw and treated water from water treatment plants, as listed in Table 1, it was estimated that
PROTOZOA IN TAIWAN WATER SUPPLIES 153
154 TA B LE 1 . C on ce nt ra ti on s of G ia rd ia an d C ry pt os po ri d iu m an d W at er -Q ua lit y Pa ra m et er s of 3 1 W at er S am pl es i n Ta iw an C ry p to -H et er ot ro ph ic To ta l Sa m pl in g G ia rd ia sp or id iu m ba ct er ia co li fo rm s Sa m pl in g Sa m pl e vo lu m e (c ys ts / (o oc ys ts / Tu rb id ity C on du ct iv ity Te m pe ra tu re (C FU / (C FU / si te ty pe Lo ca tio n (L ) 10 0 L) 10 0 L) pH (N TU ) (µ s) (° C ) 10 0 m l) 10 0 m l) Sh ua ng S hi R aw N or th er n 50 0 1. 6 0. 9 6. 70 1. 9 25 0 22 .8 40 50 24 00 Sh ua ng S hi R aw N or th er n 50 0 9. 0 < 2. 3 7. 84 2. 4 13 2 24 .4 19 62 46 ,2 50 Sh ua ng S hi Tr ea te d N or th er n 50 0 < 4. 1 < 4. 1 6. 89 0. 25 26 0 23 .0 55 1 Sh ua ng S hi Tr ea te d N or th er n 50 0 1. 4 < 0. 5 7. 27 0. 02 15 3 30 .9 < 5 < 1 Pa n H si ng R aw N or th er n 30 0 40 24 6. 80 5. 1 — — — — Pa n H si ng R aw N or th er n 20 0 40 40 6. 40 4. 5 — — — — Pa n H si ng R aw N or th er n 50 0 12 .3 4. 1 7. 42 16 28 2 22 .0 13 25 22 5 Pa n H si ng R aw N or th er n 50 0 3. 0 < 3. 0 7. 40 2. 4 24 3 23 .5 44 17 49 00 Pa n H si ng Tr ea te d N or th er n 50 0 < 19 .4 19 .4 7. 52 1. 7 27 5 21 .6 < 5 1 Pa n H si ng Tr ea te d N or th er n 50 0 1. 8 < 0. 9 7. 31 0. 4 24 8 24 .3 < 5 < 1 D un g Si ng R aw C en tr al 50 0 < 4 < 4 6. 92 1. 7 45 4 27 .5 10 00 2 D un g Si ng R aw C en tr al 50 0 21 .6 6. 2 7. 23 0. 7 21 7 22 .2 50 93 D un g Si ng Tr ea te d C en tr al 50 0 < 2. 3 < 2. 3 7. 24 1. 0 43 7 28 .5 < 5 < 1 D un g Si ng Tr ea te d C en tr al 50 0 1. 8 < 0. 9 6. 62 1. 3 22 3 21 .8 < 5 < 1 Fe ng Y ua n R aw C en tr al 30 0 < 5 10 6. 50 1. 8 — — — — Fe ng Y ua n R aw C en tr al 50 0 < 8. 2 48 .9 8. 13 7. 2 24 0 20 .4 17 ,4 37 71 50 Fe ng Y ua n R aw C en tr al 50 0 26 7. 4 7. 72 1. 6 20 3 24 .6 45 08 13 ,7 50 Fe ng Y ua n R aw C en tr al 50 0 7. 1 7. 1 7. 69 1. 6 20 3 24 .4 55 00 10 ,9 83 Fe ng Y ua n Tr ea te d C en tr al 50 0 5. 4 9. 0 7. 33 1. 5 22 3 22 .3 < 5 2 Fe ng Y ua n Tr ea te d C en tr al 50 0 6. 3 0. 7 7. 30 0. 8 20 4 25 .1 < 5 < 1 C he ng C hi ng R aw So ut he rn 25 0 16 0 40 6. 10 4. 5 — — — — C he ng C hi ng R aw So ut he rn 50 31 1. 6 80 1. 4 7. 70 17 52 6 25 .4 52 50 12 23 C he ng C hi ng Tr ea te d So ut he rn 80 3. 7 < 3. 7 7. 10 1. 4 63 4 25 .5 < 5 2 C hi ya S hi en R aw So ut he rn 25 17 2. 1 < 57 .4 7. 05 80 43 7 20 .5 < 5 < 1 C hi ya S hi en Tr ea te d So ut he rn 50 15 .0 < 5. 0 7. 10 0. 40 43 6 19 .7 < 5 < 1 Py in g D in g R aw So ut he rn 50 90 .4 36 1. 7 7. 30 20 84 5 25 .7 89 37 27 6 Py in g D in g Tr ea te d So ut he rn 80 10 .6 14 .2 6. 60 0. 20 59 5 25 .2 < 5 < 1 U en g G un gy ua n R aw So ut he rn 50 < 21 .2 < 21 .2 7. 08 5. 2 89 0 25 57 50 87 8 U en g G un gy ua n Tr ea te d So ut he rn 80 3. 1 < 3. 1 7. 20 0. 50 77 0 22 .6 < 5 < 1 K au T an R aw So ut he rn 50 25 2. 3 22 7. 0 7. 24 11 64 4 22 .1 1. 2× 10 5 1. 0× 10 5 K au T an Tr ea te d So ut he rn 80 12 .8 6. 4 7. 15 0. 30 54 6 24 .1 < 5 1
the removal efficiency for Giardia was 92.5% and for Cryptosporidium was 95.6%.
To analyze the risk from Giardia and Cryptosporidium infections, the concentrations of parasites in the treated water were adjusted by consider-ing the recovery efficiency and viability. In drinkconsider-ing water samples, the average recovery efficiency for cysts and oocysts was 26.5% and 8.9%, re-spectively. In evaluating parasite viability in Taiwan water supplies, it was assumed that these treatment plants can provide sufficient C × T values to achieve 3-log and 2-log inactivation for Giardia and Cryptosporidium under the following conditions: pH 7.0; temperature 25°C; residual chlorine con-centration in tap water 0.6 mg/L; and enough contact time (more than 2 d) (Federal-Provincial Subcommittee on Drinking Water, 1998; Casemore, 1995).
By means of Eqs. (1), (2), and (3), the concentrations of parasites from treated water samples in three different areas were converted to an annual risk of giardiasis infection. The values from north to south were 2.31 × 10⁻⁴,
9.85 × 10⁻⁴, and 2.60 × 10⁻⁴, respectively. The average annual risks for
cryp-tosporidiosis infection from north to south were 1.64 × 10⁻², 8.22 × 10⁻³,
and 1.40 × 10⁻², respectively.
DISCUSSION
Giardia and Cryptosporidium are prevalent in Taiwan surface waters,
which are the main sources of drinking water for 22 million people. River water in southern Taiwan, reaching water treatment plants, flows through the hog farming region and is significantly polluted by domestic sewage and wastewater from farm practices. In central Taiwan, water sources for supply come from reservoirs and water quality is somewhat affected by some agri-cultural activities from the upper region. As for water sources in northern Taiwan, high population density in this area in conjunction with lack of sewer systems results in a high pollution loading of the source water. Be-cause of different degrees of pollution, due to various farming activities, dif-ferent correlations between protozoan parasites and other water-quality parameters were discovered in these three parts of Taiwan. Madore et al. (1987) indicated that agricultural and farming effluents might be important sources for Giardia and Cryptosporidium. Data show that the mean concen-trations for Giardia and Cryptosporidium in the raw water samples in south-ern Taiwan were 9.2 and 23.2 times greater than those in northsouth-ern Taiwan, and 18.3 and 21.4 times higher than those in central Taiwan, suggesting that farming activities play an important role in the prevalence of the protozoan parasites. Since Giardia and Cryptosporidium are commonly found in Taiwan surface water supplies, both parasites need to be regulated under stricter laws and treatment guidelines to protect public health.
Gray (1994) suggested that it was possible to remove Giardia cysts from a large reservoir if the retention time was longer than 6 wk, provided mixing
PROTOZOA IN TAIWAN WATER SUPPLIES 155
156 TA B LE 2 . M ea n an d St an da rd D ev ia ti on o f P ro to zo an P ar as it es a nd W at er Q ua lit y Pa ra m et er s C la ss ifi ed b y Th ei r Lo ca tio ns C ry p to -G ia rd ia sp or id iu m H et er ot ro ph ic To ta l N um be r Sa m pl e (c ys ts / (o oc ys ts / ba ct er ia co lif or m s C on du ct iv it y Te m pe ra tu re Tu rb id ity Lo ca ti on of s ite s ty pe 10 0 L) 10 0 L) (C FU /1 00 L ) (C FU /1 00 m l) (µ s) (° C ) (N TU ) pH N or th er n 2 R aw n = 6 n = 6 n = 4 n = 4 n = 4 n = 4 n = 6 n = 6 M ea n = 1 8 M ea n = 1 2 M ea n = 2 93 9 M ea n = 1 3, 44 4 M ea n = 2 27 M ea n = 2 3. 2 M ea n = 5 .4 M ea n = 7 .1 SD = 1 8 SD = 1 7 SD = 1 52 5 SD = 2 1, 95 4 SD = 6 5 SD = 1 .0 SD = 5 .4 SD = 0 .5 C en tr al 2 Tr ea te d n = 4 n = 4 n = 4 n = 4 n = 4 n = 4 n = 4 n = 4 M ea n = 0 .8 M ea n = 4 .8 M ea n = 1 4 M ea n = 0 .5 M ea n = 2 34 M ea n = 2 5. 0 M ea n = 0 .6 M ea n = 7 .3 SD = 0 .9 SD = 9 .5 SD = 2 8 SD = 0 .6 SD = 5 5 SD = 4 .1 SD = 0 .8 SD = 0 .3 R aw n = 6 n = 6 n = 5 n = 5 n = 5 n = 5 n = 6 n = 6 M ea n = 9 M ea n = 1 3 M ea n = 5 ,6 99 M ea n = 6 ,3 95 M ea n = 2 63 M ea n = 2 3. 8 M ea n = 2 .4 M ea n = 7 .4 SD = 1 2 SD = 1 7 SD = 6 95 0 SD = 6 25 1 SD = 1 08 SD = 2 .9 SD = 2 .4 SD = 0 .6 Tr ea te d n = 4 n = 4 n = 4 n = 4 n = 4 n = 4 n = 4 n = 4 M ea n = 3 .4 M ea n = 2 .4 M ea n = 0 M ea n = 0 .5 M ea n = 2 72 M ea n = 2 4. 4 M ea n = 1 .2 M ea n = 7 .1 SD = 3 .0 SD = 4 .4 SD = 0 SD = I SD = 1 11 SD = 3 . I SD = 0 .3 SD = 0 .3 So ut he rn 5 R aw n = 6 n = 6 n = 5 n = 5 n = 5 n = 5 n = 6 n = 6 M ea n = 1 65 M ea n = 2 78 M ea n = 2 6, 98 8 M ea n = 2 0, 47 5 M ea n = 6 68 M ea n = 2 3. 7 M ea n = 2 6. 6 M ea n = 7 .1 SD = 1 25 SD = 3 31 SD = 4 9, 30 5 SD = 4 4, 45 8 SD = 1 97 SD = 2 .3 SD = 3 0. 4 SD = 0 .5 Tr ea te d n = 5 n = 5 n = 5 n = 5 n = 5 n = 5 n = 5 n = 5 M ea n = 9 .0 M ea n = 4 .1 M ea n = 0 M ea n = 0 .6 M ea n = 5 96 M ea n = 2 3. 4 M ea n = 3 .1 M ea n = 7 .0 SD = 5 .4 SD = 6 .3 SD = 0 SD = 0 .9 SD = 1 22 SD = 2 .4 SD = 0 .1 SD = 0 .2 To ta l 9 R aw n = 1 8 n = 1 8 n = 1 4 n = 1 4 n = 1 4 n = 1 4 n = 1 8 n = 1 8 M ea n = 6 4 M ea n = 8 8 M ea n = 1 2, 51 3 M ea n = 1 3, 43 7 M ea n = 3 98 M ea n = 2 3. 6 M ea n = 1 0. 3 M ea n = 7 .2 SD = 9 6 SD = 1 0 SD = 2 9, 83 3 SD = 2 7, 74 0 SD = 2 46 SD = 2 .0 SD = 1 8. 4 SD = 0 .5 Tr ea te d n = 1 3 n = 1 3 n = 1 3 n = 1 3 n = 1 3 n = 1 3 n = 1 3 n = 1 3 M ea n = 4 .8 M ea n = 3 .8 M ea n = 4 .2 M ea n = 0 .5 M ea n = 3 85 M ea n = 2 4. 2 M ea n = 0 .8 M ea n = 7 .1 SD = 5 .1 SD = 6 .5 SD = 1 5. 3 SD = 0 .8 SD = 1 98 SD = 3 .0 SD = 0 .6 SD = 0 .3
and current were minimal. Gray (1994) also found that the settling velocity of Giardia in a reservoir was 11 times greater than that of Cryptosporidium. Northern and central Taiwan were found to have similar mean levels of
Cryptosporidium, while the mean level of Giardia in northern Taiwan was
two times higher than in central Taiwan, whose source water originated from a reservoir. More Giardia might thus have settled in the water during the storage period as a consequence of a more efficient settling velocity.
In this study, smaller volumes of samples were collected from south-ern water supplies to compensate for the high turbidity. It was noted that the limit of detection was determined by the volume of original water sample, fraction of eluate packed pellet volume, and percentage of floated sediment examined (AWWA, 1994). The combination of these factors result in different detection limits in each water sample. The detection limits for both parasites from the southern part, because of smaller vol-ume, were thus higher than from the northern and central parts.
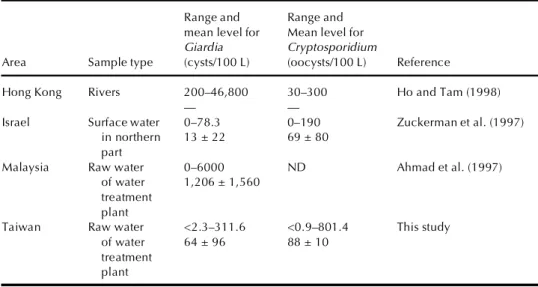
Table 4 lists the parasite concentrations in Middle Eastern and Asian surface waters recently reported by Ahmad et al. (1997), Zuckerman et al.
PROTOZOA IN TAIWAN WATER SUPPLIES 157
TABLE 3. Nonparametric Correlation Coefficient Between the Densities of Protozoa and the
Microbiological Parameters
Heterotrophic Total
Location Parasites Cryptosporidium bacteria coliforms Turbidity
Northern Giardia n = 6 n = 4 n = 4 n = 6 R = 0.794 R = –0.80 R = –0.20 R = 0.794 p = .059 p = .200 p = .800 p = .059 Cryptosporidium — n = 4 n = 4 n = 6 — R = –0.632 R = –0.949 R = 0.588 — p = .368 p = .051 p = .219 Central Giardia n = 6 n = 5 n = 5 n = 6 R = –0.122 R = –0.359 R = 0.616 R = –0.832 p = .686 p = .552 p = .269 p = .040 Cryptosporidium — n = 5 n = 5 n 6 — R = 0.800 R = 0.700 R = 0.638 — p = .104 p = .188 p = .173 Southern Giardia n = 6 n = 5 n = 5 n = 6 R = 0.616 R = –0.100 R = 0.500 R = 0.200 p = .269 p = .872 p = .391 p = .747 Cryptosporidium — n = 5 n = 5 n = 6 — R = 0.205 R = 0.410 R = 0.103 — p = .870 p = .493 p = .870
Total raw Giardia n = 18 n = 14 n = 14 n = 18
water R = 0.518 R = 0.011 R = 0.038 R = 0.491
samples p = .028 p = .970 p = .896 p = .038
Cryptosporidium — n = 14 n = 14 n = 18
— R = 0.614 R = 0.294 R = 0.331
— p = .020 p = .307 p = .179
Note. n, Sample number; R, Spearman R; p, p levels.
(1997), and Ho and Tam (1998). Data from our study are also included in this table for comparison. Data in Table 4 were not adjusted for recovery efficiency. Mean levels of Giardia cysts in Malaysia were found to be 18.8 times higher than in Taiwan, and the range of cysts found in Hong Kong was also greater. On the other hand, the mean level of cysts in Israel was only one-fifth that in Taiwan. Mean levels of Cryptosporidium oocysts from Middle Eastern and other Asian areas were less than that found in Taiwan. Oocysts were not found in the water samples in Malaysia.
The U.S. Environmental Protection Agency (EPA) Federal Register (U.S. EPA, 1989) included that 1 case of microbiologically caused illness per year per 10,000 individuals is acceptable as a drinking water standard. To achieve this goal, Rose et al. (1991) suggested that tap water should not contain more than 7 × 10⁻⁴ Giardia cysts/100 L on the basis of a geometric
mean for 1 yr. Haas and Rose (1995) stated that an outbreak would probably occur if tap water contains more than 10 to 30 Cryptosporidium oocysts/ 100 L. Because the information about dose-response relationships for both parasites is insufficient in Taiwan, results predicted from this model are variable and uncertain. Despite this, it is recommended that point-of-use equipment be used for the safety of drinking water.
REFERENCES
Ahmad, R. A., Lee, E., Tan, I. T. L., and Mohamad-Kamel, A. G. 1997. Occurrence of Giardia cysts and Cryptosporidium oocysts in raw and treated water from two water treatment plants in Selangor, Malaysia. Water Res. 31:3132–3136.
American Public Health Association. 1995. Standard method for the examination of water and waste-water, 15th ed. Washington, DC: APHA, WEF, and AWWA.
158 B.-M. HSU ET AL.
TABLE 4. The Range and Mean Level of Giardia and Cryptosporidium in Different Middle Eastern
and Asian Areas
Range and Range and mean level for Mean level for Giardia Cryptosporidium
Area Sample type (cysts/100 L) (oocysts/100 L) Reference
Hong Kong Rivers 200–46,800 30–300 Ho and Tam (1998)
— —
Israel Surface water 0–78.3 0–190 Zuckerman et al. (1997) in northern 13 ± 22 69 ± 80
part
Malaysia Raw water 0–6000 ND Ahmad et al. (1997) of water 1,206 ± 1,560
treatment plant
Taiwan Raw water <2.3–311.6 <0.9–801.4 This study of water 64 ± 96 88 ± 10
treatment plant
Note. ND, no oocysts were detected.
American Water Works Association. 1994. Methods for detecting, identifying, and enumerating Giardia and Cryptosporidium in water samples. Denver, CO: AWWA Press.
Casemore, D. P. 1995. Disinfection options. In Proceedings of Workshop on Treatment Optimisation for Cryptosporidium Removal from Water Supplies, eds. P. A. West and M. S. Smith, pp. 19–24. London: HMSO.
Chiou, C. F., TorresLugo, M., Marinas, B. J., and Adams, J. Q. 1997. Nonbiological surrogate indica-tors for assessing ozone disinfection. J. Am. Water Works Assoc. 89:54–66.
Chung, P. K., and Cross, J. H. 1975. Prevalence of intestinal parasites in children on a Taiwan off-shore island determined by the use of several diagnostic methods. J. Formosan Med. Assoc. 74: 411–418.
Cook, G. C. 1995. Entamoeba histolytica and Giardia lamblia infection: Current diagnostic strategies. Parasite 2:107–112.
Crabtree, K. D., Ruskin, R. H., Shaw, S. B., and Rose, J. B. 1996. The detection of Cryptosporidium oocysts and Giardia cysts in cistern water in the U.S. Virgin Island. Water Res. 30:208–216. Donnelly, J. K., and Stentiford, E. I. 1997. The Cryptosporidium problem in water and food supplies.
Food Sci. Technol. 30:111–120.
DuPont, H. L., Chappell, C. L., Sterling, C. R., Okhuysen, P. C., Rose, J. B., and Jakubowski, W. 1995. The infectivity of Cryptosporidium parvum in healthy volunteers. New Engl. J. Med. 332: 855–859.
Eisenberg, J. N. S., Seto, E. Y. W., Colford, J. M., Olivieri, A., and Spear, R. C. 1998. An analysis of the Milwaukee cryptosporidiosis outbreak based on a dynamic model of the infection process. Epidemiology 9:255–263.
Federal-Provincial Subcommittee on Drinking Water. 1998. Protozoa in drinking water. Ottawa: Health Canada.
Frost, F. J., Craun, G. F., and Calderon, R. L. 1996. Waterborne disease surveillance. J. Am. Water Works Assoc. 88:66–75.
Furumoto, W. A., and Mickey, R. 1967. A mathematical model for infectivity-dilution curve of tobacco mosaic virus. Virology 32:216–223.
Gray, N. F., ed. 1994. Drinking water quality problems and solutions, p. 192. Chichester: Wiley & Sons.
Haas, C. N., and Rose, J. B. 1995. Developing an action level for Cryptosporidium. J. Am. Water Works Assoc. 87:81–84.
Haas, C. N., Hornberger, J. C., Anmangandla, U., Heath, M., and Jacangelo, J. G. 1994. A volumetric method for assessing Giardia inactivation. J. Am. Water Works Assoc. 86:115–120.
Haas, C. N., Crockett, C. S., Rose, J. B., Gerba, C. P., and Fazil, A. M. 1996. Assessing the risk posed by oocysts in drinking water. J. Am. Water Works Assoc. 88:131–136.
Ho, B. S. W., and Tam, T.-Y. 1998. Giardia and Cryptosporidium in sewage contaminated river waters. Water Res. 32:2860–2864.
Korich, D. G., Mead, J. R., Madore, M. S., Sinclair, N. A., and Sterling, C. R. 1990. Effects of ozone, chlorine dioxide, chlorine and monochloramine on Cryptosporidium oocyst viability. Appl. Environ. Microbiol. 56:1423–1428.
Kramer, M. H., Herwaldt, B. L., Craun, G. F., Calderon, R. L., and Juranek, D. D. 1996. Waterborne disease: 1993 and 1994. J. Am. Water Works Assoc. 88:70–80.
LeChevallier, M. W., and Norton, W. D. 1995. Giardia and Cryptosporidium in raw and finish water. J. Am. Water Works Assoc. 87:54–68.
LeChevallier, M. W., Norton, W. D., and Lee, R. G. 1991. Occurrence of Giardia and Crypto-sporidium in surface water supplies. Appl. Environ. Microbiol. 57:2610–2616.
Liyanage, L. R. J., Finch, G. R., and Belosevic, M. 1997a. Effect of aqueous chlorine and oxychlorine compounds on Cryptosporidium parvum oocysts. Environ. Sci. Technol. 31:1992–1994. Liyanage, L. R. J., Finch, G. R., and Belosevic, M. 1997b. Sequential disinfection of Cryptosporidium
parvum by ozone and chlorine dioxide. Ozone Sci. Eng. 19:409–423.
Madore, M. S., Rose, J. B., Gerba, C. P., Arrowood, M. J., and Steriling, C. R. 1987. Occurrence of Cryptosporidium oocysts in sewage effluents and selected surface waters. J. Parasitol. 73:702– 705.
Morris, R. D., Naumova, E. N., and Griffiths, J. K. 1998. Did Milwaukee experience waterborne crypto-sporidiosis before the large documented outbreak in 1993? Epidemiology 9:264–270.
PROTOZOA IN TAIWAN WATER SUPPLIES 159
Pell, A. N. 1997. Manure and microbes: Public and animal health problem? J. Dairy Sci. 80:2673– 2681.
Perz, J. F., Ennever, F. K., and Le Blancq, S. M. 1998. Cryptosporidium in tap water—Comparison of predicted risks with observed levels of disease. Am. J. Epidemiol. 147:289–301.
Regli, S., Rose, J. B., Haas, C. N., and Gerba, C. P. 1991. Modeling the risk from Giardia and viruses in drinking water. J. Am. Water Works Assoc. 83:76–84.
Rose, J. B. 1988. Occurrence and significance of Cryptosporidium in water. J. Am. Water Works Assoc. 80:53–58.
Rose, J. B., Haas, C. N., and Regli, S. 1991. Risk assessment and control of waterborne giardiasis. Am. J. Public Health 81:709–713.
SoloGabriele, H., and Neumeister, S. 1996. US outbreaks of cryptosporidiosis. J. Am. Water Works Assoc. 88:76–86.
Stetzenbach, L. D., Arrowood, M. J., Marshell, M. M., and Sterling, C. R. 1988. Monoclonal antibody based immunofluorescent assay for Giardia and Cryptosporidium detection in water samples. Water Sci. Technol. 20:193–198.
Teunis, P. F. M., Medema, G. J., Kruidenier, L., and Havelaar, A. H. 1997. Assessment of the risk of infection by Cryptosporidium or Giardia in drinking water from a surface water source. Water Res. 31:1333–1346.
U.S. Environmental Protection Agency. 1989. National primary drinking water regulation; Filtration and disinfection; Turbidity; Giardia lamblia, viruses, Legionella, heterotrophic bacteria. Fed. Reg. 54:27486–27541.
Wang, J. S., and Liew, C. T. 1990. Prevalence of Cryptosporidium spp. of avians in Taiwan. Taiwan J. Vet. Med Animal Husbandry 56:45–57.
Zuckerman, U., Gold, D., Shelef, G., and Armon, R. 1997. The presence of Giardia and Crypto-sporidium in surface waters and effluents in Israel. Water Sci. Technol. 35:381–384.
160 B.-M. HSU ET AL.