Observation of the density minimum in deeply
supercooled confined water
Dazhi Liu*, Yang Zhang*, Chia-Cheng Chen†, Chung-Yuan Mou†, Peter H. Poole‡, and Sow-Hsin Chen*§
*Department of Nuclear Science and Engineering, Massachusetts Institute of Technology, Cambridge, MA 02139;†Department of Chemistry, National Taiwan University, Taipei 106, Taiwan; and‡Department of Physics, St. Francis Xavier University, Antigonish, NS, Canada B2G 2W5
Edited by H. Eugene Stanley, Boston University, Boston, MA, and approved April 16, 2007 (received for review February 13, 2007) Small angle neutron scattering (SANS) is used to measure the
density of heavy water contained in 1D cylindrical pores of meso-porous silica material MCM-41-S-15, with pores of diameter of 15ⴞ 1 Å. In these pores the homogenous nucleation process of bulk water at 235 K does not occur, and the liquid can be supercooled down to at least 160 K. The analysis of SANS data allows us to determine the absolute value of the density of D2O as a function of temperature. We observe a density minimum at 210ⴞ 5 K with a value of 1.041ⴞ 0.003 g/cm3. We show that the results are consistent with the predictions of molecular dynamics simulations of supercooled bulk water. Here we present an experimental report of the existence of the density minimum in supercooled water, which has not been described previously.
liquid–liquid critical point兩 nanopores 兩 small angle neutron scattering 兩 Widom line
O
f the many remarkable physical properties of liquid water (1), the density maximum is probably the most well known. The density maximum of H2O at Tmax⫽ 277 K (284 K in D2O) is oneof only a few liquid-state density maxima known (2) and the only one found to occur in the stable liquid phase above the melting temperature. Water’s density maximum is a dramatic expression of the central role played by hydrogen bonding in determining the properties of this liquid: as temperature T decreases through the region of the density maximum, an increasingly organized and open four-coordinated network of hydrogen bonds expands the volume occupied by the liquid, overwhelming the normal tendency of the liquid to contract as it is cooled.
The density of bulk supercooled liquid water decreases rapidly with T before the onset of homogeneous crystal nucleation (at ⬇235 K) precludes further measurements. The density curve of ice Ih lies below that of the liquid and almost certainly sets a lower bound on the density that the supercooled liquid could attain if nucleation were avoided, because ice Ih represents the limiting case of a perfectly ordered tetrahedral network of hydrogen bonds. Significantly, the expansivity of ice Ih in this T range is positive (3); i.e., the density increases as T decreases (see Fig. 2). The low density amorphous (LDA) ice that forms from deeply supercooled liquid water at the (in this case extremely weak) glass transition ap-proaches very closely the structure of a ‘‘random tetrahedral network’’ (RTN) and exhibits a number of ice-like properties, including a ‘‘normal’’ (i.e., positive) expansivity (4). If the structure of deeply supercooled water also approaches that of a RTN, it is therefore possible that a density minimum occurs in the super-cooled liquid (5).
Consistent with this possibility, a number of recent molecular dynamics (MD) computer simulation studies predict that a density minimum occurs in water (H2O) (5–10). These studies achieve deep
supercooling without crystal nucleation due to the small system size and short observation time explored, compared with experiment. In the literature, the five-site transferable interaction potential (TIP5P) for water is considered to be the most accurate model for reproducing experimental data when used with a simple spherical cutoff for the long-ranged electrostatic interactions in MD simu-lation (11). The ST2 potential has been widely used in simusimu-lation
of water since early 1970s (12). As shown in Fig. 2, the TIP5P-E (9) model of water exhibits a density minimum at a temperature Tmin,
which is approximately 70 K below Tmaxat atmospheric pressure.
The ST2 model also predicts that a density minimum occurs at approximately this temperature (6–8, 10).
Density minima in liquids are even more rare than density maxima. We are aware of reports of density minima in only a few liquid systems, such as Ge-Se mixtures (13). Confirming the exis-tence of a density minimum in water would reveal much about the supercooled state of this important liquid. Its occurrence would signal the reversal of the anomalies that set in near the density maximum; i.e., that mildly supercooled water is anomalous but that deeply supercooled water ‘‘goes normal.’’ Observing a density minimum also would have significant implications for the possibility that a liquid–liquid phase transition (LLPT) occurs in supercooled water (1, 14), along the same lines as that recently argued for vitreous silica (15).
Results
In this report, we present the experimental observation of a density minimum in supercooled water (D2O), confined in the
nanochan-nels of mesoporous silica, occurring at Tmin⫽ 210 ⫾ 5 K with a
density value of 1.041⫾ 0.003 g/cm3as shown in Fig. 1. Our sample
is a fully hydrated (D2O) MCM-41-S-15 powder, which is made of
a micellar templated mesoporous silica matrix and has 1D cylin-drical pores arranged in a 2D hexagonal lattice (16, 17). In this experiment, we chose the material with a pore diameter of 15⫾ 1 Å because the differential scanning calorimetry data show no freezing peak down to 160 K for the fully hydrated sample. The small angle neutron scattering (SANS) diffraction pattern from the sample consists of two parts: intergrain interfacial scattering and a Bragg peak coming from the 2D hexagonal internal structure of the grains. Based on the detailed analysis (presented in Methods), we find that the height of the Bragg peak is related to the scattering length density (sld) of D2O inside the silica pores, and the sld of
D2O is proportional to its mass densityD2O
m . Hence, we are able to determine the density of water (D2O) by measuring the
tempera-ture-dependent neutron scattering intensity I(Q). The highest value corresponds to the known density maximum of D2O at⬇284 K.
Most significantly, we find a density minimum situated at Tmin⫽
210⫾ 5 K with a value of 1.041 ⫾ 0.003 g/cm3.
Discussion
Fig. 2 compares the density minimum found here with that found in Paschek’s MD simulation study of TIP5P-E (9). The
correspon-Author contributions: S.-H.C. designed research; D.L. and Y.Z. performed research; D.L., C.-C.C., C.-Y.M., and S.-H.C. contributed new reagents/analytic tools; D.L. analyzed data; and D.L., Y.Z., C.-Y.M., P.H.P., and S.-H.C. wrote the paper.
The authors declare no conflict of interest. This article is a PNAS Direct Submission.
Abbreviations: LDA, low density amorphous; LLPT, liquid–liquid phase transition; MD, molecular dynamics; SANS, small angle neutron scattering; sld, scattering length density; TIP5P, five-site transferable interaction potential.
§To whom correspondence should be addressed. E-mail: sowhsin@mit.edu.
dence in T with our experimental data are excellent: for TIP5P-E: Tmax⫺ Tminis⬇70 K, compared with 80 K in the present study.
Note also that the ratio of the maximum to minimum density is 1.05 for TIP5P-E, compared with 1.06 for our data.
The minimum density we find (1.041 g/cm3) also compares well
with the density of LDA ice, to which the deeply supercooled liquid will transform at the glass transition, if crystallization is avoided. The density of H2O LDA ice is 0.94 g/cm3(4), corresponding to
⬇1.04 g/cm3for D
2O LDA ice, assuming a 10.6% density difference
(18). Also of note is that a super-Arrhenius to Arrhenius dynamic crossover phenomenon has been experimentally observed in this confined water (H2O) system at 225 K (16, 17); hence, Tminoccurs
in a regime of strong liquid behavior, below this crossover. To-gether, these observations strongly suggest that the structure of water below Tminis approaching that of a fully connected,
defect-free hydrogen-bond network, in which the anomalies of water, so prominent near the melting temperature, disappear.
The finding of a density minimum also has significant impli-cations for the proposal that a LLPT occurs in supercooled water
(1, 14). These implications arise because of formal relationships that exist between density anomalies and response functions, such as the isothermal compressibility T and the isobaric
specific heat CP(19). For example,Tis known experimentally
to increase with decreasing T near Tmax, and it has been shown
that this must be true in any system upon crossing a line of density maxima having negative slope in the T-P plane. When applied to the vicinity of a density minimum, these same thermodynamic relations predict thatTmust be decreasing with
T at Tmin, under the physically plausible assumption that the line
of density minima also has a negative slope in the T-P plane. In combination, these two constraints on the behavior ofTmean
that T must have a maximum between Tmin and Tmax. A T
maximum implies that other response functions, such as the specific heat CP, also will attain extrema in the range between
Tmin and Tmax. A CPpeak in this range is consistent with the
dynamical crossover observed at 225 K (16, 17). Furthermore, the occurrence of an inflection point in our data for the T dependence of the density (see Fig. 1) directly establishes that the thermal expansion coefficient ␣p ⫽ ⫺1/(⭸/⭸T)P has a minimum between Tminand Tmax. We know for fact that␣phas
a peak when we cross the Widom line above the liquid–vapor transition of steam (20). This reinforces the plausibility that there is a Widom line emanating from the liquid–liquid critical point in supercooled water passing between Tminand Tmax, as was
indicated in our previous experiment, which detects the dynamic crossover phenomenon at 225 K at ambient pressure (H. E. Stanley, personal communication).
This pattern of thermodynamic behavior, in which density anomalies bracket extrema in response functions at ambient pressure, is entirely consistent with that found in MD simulations of TIP5P-E and ST2, both of which exhibit an LLPT at elevated pressure (see in particular figure 2 of ref. 10). Conversely, MD models of water in which a density minimum has not been observed are also models in which a LLPT has not been identified. In the T-P plane, the lines of response function extrema necessarily meet at the critical point of the LLPT, if it exists. The present results, combined with those of refs. 16 and 17, demonstrate that the temperature window in which these extrema occur can be identified and accessed at ambient pres-sure and that the system remains an ergodic liquid throughout this range. Therefore, if the critical point of an LLPT exists at higher pressure, there is considerable promise that it too occurs in the liquid regime and can be detected by mapping the equation of state for the density through SANS experiments of the kind described here, conducted at higher pressure.
Overall, our results demonstrate that SANS is a powerful method for determining the average density of D2O in cylindrical
pores of MCM-41-S-15 silica matrix. It remains an open question whether the density minimum we find in confined water can be confirmed in bulk water. However, given the importance of confined water, particularly in biological systems, our demon-stration of the disappearance of water’s anomalies in confine-ment at⬍210 K has broad implications for understanding the low-temperature properties of a wide range of aqueous micro-structured systems, as well as bulk water itself.
Materials and Methods
SANS experiments were performed at NG3, a 30-m SANS spec-trometer, in the National Institute of Standards and Technology Center for Neutron Research (NCNR). The incident monochro-matic neutrons have an average wave length of ⫽ 5 Å with a fractional spread of⌬/ ⫽ 10%. The sample to detector distance is fixed at 6 m, covering the range of magnitudes of neutron wave vector transfer (Q) from 0.008 to 0.40 Å⫺1. This Q range covers the high Q part of the interfacial scattering between different grains and Fig. 1. Average D2O density inside the 15⫾ 1 Å pore measured by SANS
method as a function of temperature. A smooth transition of D2O density from the maximum value at 284⫾ 5 K to the minimum value at 210 ⫾ 5 K is clearly shown. The filled squares are the density data for bulk D2O taken from the CRC
Handbook (22).
Fig. 2. Comparison of density vs. temperature curves at ambient pressure for bulk liquid D2O (open triangles) [CRC Handbook (22)], confined liquid D2O (filled circles) from this work, D2O ice Ih (filled squares) (2), and MD simulations of liquid TIP5P-E water (open diamonds) (9). The density values for the TIP5P-E model (which is parameterized as model of H2O) have been multiplied by 1.1 to facilitate comparison with the behavior of D2O.
APPLIED
PHYSICAL
the Bragg peak due to the hexagonal array of silica pores within a grain. The amplitude of the latter is used as an indicator of the density of water in the sample.
Our sample consisted of a fully hydrated (D2O) MCM-41-S-15
powder, which is made of micellar templated mesoporous silica matrices and has 1D cylindrical pores arranged in a 2D hexag-onal lattice (16, 17). We synthesized MCM-41-S-15 by reacting preformed -zeolite seeds [formed with tetraethylammonium hydroxide(TEAOH)] with decyltrimethylammonium bromide solution (C10TAB; Acros Organics, Geel, Belgium) and then
transferring the mixture into an autoclave at 150°C for 18 h. Solid samples were then collected by filtration, washed with water,
dried at 60°C in air overnight, and calcined at 560°C for 6 h. The molar ratios of the reactants were SiOTEAOH:C 2:NaOH:
10TMAB:H2O⫽ 1:0.075:0.285:0.22:52.
The sample was hydrated by exposing it to water vapor in a closed chamber until it reaches the full hydration level of 0.5 g of D2O per 1 g of silica. We made measurements at 14
temper-atures between 160 and 290 K in a step of 10 K to monitor the variation of the density in the supercooled region (see Fig. 3). The powder sample of MCM-41-S-15 we used in the experiment consists of crystallites, or grains (approximately spherical) of the order of micrometer size. Each grain was made up of a 2D hexagonal matrix of parallel cylindrical silica pores with an inter-pore distance a. After full hydration, all of the inter-pores were filled with water (D2O), which has a considerably different sld (a factor of 2
larger) from that of the silica matrix. The direction of the cylindrical axis in each grain was randomly distributed in space. The diffraction pattern from the sample therefore consisted of two parts: (i) intergrain interfacial scattering, the Q-dependence of which follows a power law; and (ii) a Bragg peak at Q1⫽ 2/a coming from the
2D hexagonal internal structure of the grains.
Fig. 3 shows a peak situated at Q1 ⫽ 0.287 Å⫺1, which
corresponds to the center-to-center distance between the water columns a⫽ 2/Q1⬇ 21.9 Å. In the range of 0.1–0.2 Å⫺1, a
Table 1. Fitted model parameters and the measured density of D2O as a function of temperature T, K C1 R, Å 2/a, Å⫺1 ⌫, Å⫺1 , g/cm3 160 0.004269 8.09 0.287 0.0328 1.061 170 0.004237 8.09 0.287 0.0328 1.059 180 0.004201 8.09 0.287 0.0328 1.057 190 0.004111 8.09 0.287 0.0328 1.053 200 0.003984 8.09 0.287 0.0325 1.046 210 0.003889 8.09 0.287 0.0324 1.041 220 0.003907 8.09 0.287 0.0326 1.042 230 0.004006 8.09 0.287 0.0330 1.047 240 0.004244 8.09 0.288 0.0337 1.060 250 0.004483 8.09 0.288 0.0341 1.071 260 0.004819 8.09 0.288 0.0346 1.088 270 0.005017 8.09 0.288 0.0348 1.097 280 0.005168 8.09 0.288 0.0347 1.104 290 0.005203 8.09 0.288 0.0344 1.106
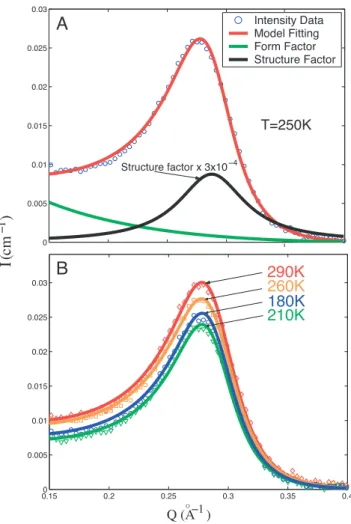
Fig. 3. SANS intensity distribution, as a function of Q, of MCM-41-S-15 plotted in a log–log scale. The dashed straight line represents the interfacial scattering coming from the surfaces of the grains of the silica crystallites. Each scattering curve displays a power law region and a first-order diffraction peak situated at Q1⫽ 0.287 Å⫺1. The diffraction peak is due to Bragg diffraction from the (01) plane of the 2D hexagonal lattice made of parallel water cylinders contained in grains of the silica crystallites, which are oriented with the direction of the cylindrical axes parallel to the direction of the incident neutron beam. The height of the diffraction peak is proportional to the square of the difference of sld between D2O inside the cylindrical pore and the silica matrix. The height of the peak decreases steeply when the sample is cooled down in the temperature range from 280 to 220 K, indicating a steep decrease of density of D2O. However, the height increases significantly again in the temperature range from 210 to 160 K, where the density minimum was found by a detail analysis. 0 0.005 0.01 0.015 0.02 0.025 0.03
mc
( I
1 −)
Intensity Data Model Fitting Form Factor Structure Factor Structure factor x 3x10⁻⁴ T=250K 0.150 0.2 0.25 0.3 0.35 0.4 0.005 0.01 0.015 0.02 0.025 0.03290K
260K
180K
210K
Q (A−1)A
B
Fig. 4. Model analysis of SANS intensity distribution. (A) The blue circles show the SANS data (at 250 K) with the contribution of the interfacial (surfaces of the grains) scattering subtracted. The red solid line represents the fitted curve using the model given in the text. The black line represents the structure factor S(Q) of the 2D hexagonal lattice. The green line represents the form factor P(Q) of the cylindrical tube of D2O column. [To make the figure clearer, the magnitude of
S(Q) is multiplied by a factor 3⫻ 10⫺4.] (B) SANS data and their fitted curves (solid lines) for different temperatures. Four curves are selected to show the good agreement between the model analyses and the experimental data.
straight line in log–log scale represents the asymptotic part of the interfacial scattering.
In a SANS experiment, the measured Q-vector is essentially perpendicular to the incident neutron direction. For a scattering unit (particle), which is a long cylinder with a small circular cross section (such as the present case), the scattering geometry essen-tially selects out only those cylinders which happen to lie with their cylindrical axes parallel to the incident neutron direction. Conse-quently the direction of the measured Q-vector is nearly perpen-dicular to the cylindrical axis. With this understanding, the neutron scattering intensity distribution I(Q) is given by I(Q) ⫽ nVp2(⌬)2P(Q)S(Q), where n is the number of scattering units (water cylinders) per unit volume in the sample, Vpis the volume of the scattering unit,⌬ ⫽ p⫺eis the difference of sld between the scattering unitpand the environmente, P(Q) is the normalized particle structure factor (or form factor) of the water cylinder, and S(Q) is the interparticle structure factor (of a 2D hexagonal lattice). Note that the sld of the confining material MCM-41-S-15 is 3.618⫻ 1010cm⫺2and is approximately independent of temperature in the
temperature range we study (as evidenced by the fact that the position of Q1changes by⬍0.5% for the entire temperature range
studied; see Table 1). The sld of the scattering unit p can be rewritten asp ⫽D2O
m N
A兺ibi/Mw, where NAis Avogadro’s number,
Mwis the molecular weight of D2O, biis the coherent scattering
length of the ith D2O molecule in the scattering unit, andD2O m is the mass density of D2O. The sld of the environment e has been
determined by a separate contrast variation experiment. Based on the above relations, we find that all of the variables in the expression for I(Q) are independent of temperature except for⌬ because it involves a temperature-dependent parameterD2O
m
. Hence, we are able to determine the density of water (D2O) by measuring the
temperature-dependent neutron scattering intensity I(Q). The normalized particle structure factor P(Q) of a long (QL⬎ 2) cylinder is given by P(Q) ⫽ /QL(2 J1(QR)/QR)2(21), where L
and R represent the length and the radius of the cylinder respec-tively, and J1(x) is the first-order Bessel function of the first kind. As
an example, the form of P(Q) is depicted as a green solid line in Fig. 4A. The structure factor S(Q) of a perfect 2D hexagonal lattice is a series of delta functions (Bragg peaks) situated at Q1⫽ 2/a,
Q2⫽ 2公3/a, . . . , where a is the length of the primitive lattice
vector of the 2D hexagonal lattice. All of the Bragg peaks will be broadened due to defects of the lattice and the finite size of the grains. The broadening can be well approximated by a Lorentzian function. The black solid line in Fig. 4A shows the S(Q) in our model. Therefore, the neutron intensity we measured in the Q1
peak region (0.2–0.4 Å⫺1), after subtraction of the interfacial scattering, is expressed as I共Q兲 ⫽ nVp 2
冉
NA冘
i bi Mw p m ⫺e冊
2 QL冉
2 J1共QR兲 QR冊
2冢
C 1 2⌫冉
Q⫺2 a冊
2 ⫹冉
12⌫冊
2冣
, [1]where ⌫ is the FWHM and C is a temperature-independent constant. Combining all constants, we obtain
I共Q兲 ⫽ C1 J1共QR兲2 Q3R2
冢
1 2⌫冉
Q⫺2 a冊
2 ⫹冉
12⌫冊
2冣
, [2]where the new prefactor
C1⫽ 4CnVp 2 L
冉
NA冘
i bi Mw冊
2冉
p m ⫺冉
Mw NA冘
i bi冊
e冊
2 ⬀ 共D2O m ⫺ C0兲2, and C0⫽冉
Mw NA冘
i bi冊
e⫽ 0.6273 g/cm3 determined byeof MCM-41-S-15.By fitting the model described above to our data for neutron intensity I(Q), the parameters C1, R, a, and⌫ are obtained. The
fitted curves for different temperatures show the good agree-ment of the model with the experiagree-mental data in Fig. 4B. The square root of the fitting parameter C1and the mass density
of D2O have a linear relationship according to the expression
of C1 above. Extracting C1 from the analysis, we obtain the
absolute value of the density of D2O in the pores by assuming
it has the same density as bulk D2O at 284⫾ 5 K. The fitted
diameter of 16 Å of the water cylinder agrees closely with the diameter determined by nitrogen adsorption (15⫾ 1 Å). Table 1 and Fig. 1 show the D2O density vs. temperature. The plot
shows a smooth transition of D2O density from a higher to a
lower value. The higher value corresponds to the known density maximum of D2O at⬇284 K. Most significantly, we
find a density minimum situated at Tmin⫽ 210 ⫾ 5 K with a
value of 1.041⫾ 0.003 g/cm3.
To confirm that the density minimum is a real physical phenomenon that does not depend on the fitting model we use, we plotted the raw data together with the fitted curves in Fig. 4B. It can be directly seen from the graph that the intensity of the peak at 180 K is visibly higher than the intensity at 210 K, demonstrating that the density minimum is not an artifact of the model fitting.
We thank Dr. Y. Liu for help in carrying out this experiment at the National Institute of Standards and Technology Center for Neutron Research and Prof. H. Eugene Stanley for many fruitful conversations on the subject of anomalies of water and the L-L critical point. S.-H.C.’s group at Massachusetts Institute of Technology is supported by Department of Energy Grant DE-FG02-90ER45429. C.-Y.M.’s group is supported by Taiwan National Science Council Grant NSC95-2120-M-002-009. P.H.P.’s group is supported by Canada’s Natural Sciences and Engineering Research Council and the Canada Research Chair Program. We benefited from affiliation with the European Union Marie-Curie Research and Training Network on Arrested Matter.
1. Debenedetti PG, Stanley HE (2003) Phys Today 56:40–46. 2. Angell CA, Kanno H (1976) Science 193:1121–1122.
3. Rottger K, Endriss A, Ihringer J, Doyle S, Kuhs WF (1994) Acta Crystallogr B 50:644–648.
4. Angell CA (2004) Annu Rev Phys Chem 55:559–583.
5. Angell CA, Bressel RD, Hemmati M, Sare EJ, Tucker JC (2000) Phys Chem
Chem Phys 2:1559–1566.
6. Brovchenko I, Geiger A, Oleinikova A (2001) Phys Chem Chem Phys 3:1567– 1569.
7. Brovchenko I, Geiger A, Oleinikova A (2003) J Chem Phys 118:9473–9476.
8. Brovchenko I, Geiger A, Oleinikova A (2005) J Chem Phys 123:044515. 9. Paschek D (2005) Phys Rev Lett 94:217802.
10. Poole PH, Saika-Voivod I, Sciortino F (2005) J Phys Condens Matter 17:L431– L437.
11. Mahoney MW, Jorgensen WL (2000) J Chem Phys 112:8910–8922. 12. Stillinger FH, Rahman A (1974) J Chem Phys 60:1545–1577. 13. Ruska J, Thurn H (1976) J Non-Cryst Solids 22:277–290.
14. Poole PH, Sciortino F, Essmann U, Stanley HE (1992) Nature 360:324–328. 15. Sen S, Andrus RL, Baker DE, Murtagh MT (2004) Phys Rev Lett 93:
125902.
APPLIED
PHYSICAL
16. Liu L, Chen S-H, Faraone A, Yen C-W, Mou C-Y (2005) Phys Rev Lett 95:117802.
17. Xu L, Kumar P, Buldyrev SV, Chen S-H, Poole PH, Sciortino F, Stanley HE (2005) Proc Natl Acad Sci USA 102:16558–16562.
18. Kell GS (1967) J Chem Eng 12:66–69.
19. Sastry S, Debenedetti PG, Sciortino F, Stanley HE (1996) Phys Rev E 53:6144–6154.
20. Anisimov MA, Sengers JV, Levelt Sengers JMH (2004) in Physical Chemistry
in Water, Steam and Hydrothermal Solutions, eds Palmer DA, Fernandez-Prini
R, Harvey AH (Elsevier, Amsterdam), Chap 2, pp 29–72.
21. Chen S-H, Lin T-L, Wu CF (1987) in Physics of Amphiphilic Layers, eds Meunier J, Langevin D, Boccara N (Springer, Berlin), pp 241–252. 22. Lide DR, ed (2007) CRC Handbook of Chemistry and Physics (Taylor and
![Fig. 2. Comparison of density vs. temperature curves at ambient pressure for bulk liquid D 2 O (open triangles) [CRC Handbook (22)], confined liquid D 2 O (filled circles) from this work, D 2 O ice Ih (filled squares) (2), and MD simulations of liquid TIP5](https://thumb-ap.123doks.com/thumbv2/9libinfo/8846967.240851/2.891.86.416.754.1001/comparison-temperature-pressure-triangles-handbook-confined-circles-simulations.webp)