MELINDAS. PENG
Marine Meteorology Division, Naval Research Laboratory, Monterey, California
TETSUONAKAZAWA
Meteorological Research Institute, Japan Meteorological Agency, Tsukuba, Ibaraki, Japan
(Manuscript received 19 July 2006, in final form 23 February 2007) ABSTRACT
Starting from 2003, a new typhoon surveillance program, Dropwindsonde Observations for Typhoon Surveillance near the Taiwan Region (DOTSTAR), was launched. During 2004, 10 missions for eight typhoons were conducted successfully with 155 dropwindsondes deployed. In this study, the impact of these dropwindsonde data on tropical cyclone track forecasts has been evaluated with five models (four opera-tional and one research models). All models, except the Geophysical Fluid Dynamics Laboratory (GFDL) hurricane model, show the positive impact that the dropwindsonde data have on tropical cyclone track forecasts. During the first 72 h, the mean track error reductions in the National Centers for Environmental Prediction’s (NCEP) Global Forecast System (GFS), the Navy Operational Global Atmospheric Prediction System (NOGAPS) of the Fleet Numerical Meteorology and Oceanography Center (FNMOC), and the Japanese Meteorological Agency (JMA) Global Spectral Model (GSM) are 14%, 14%, and 19%, respec-tively. The track error reduction in the Weather Research and Forecasting (WRF) model, in which the initial conditions are directly interpolated from the operational GFS forecast, is 16%. However, the mean track improvement in the GFDL model is a statistically insignificant 3%. The 72-h-average track error reduction from the ensemble mean of the above three global models is 22%, which is consistent with the track forecast improvement in Atlantic tropical cyclones from surveillance missions. In all, despite the fact that the impact of the dropwindsonde data is not statistically significant due to the limited number of DOTSTAR cases in 2004, the overall added value of the dropwindsonde data in improving typhoon track forecasts over the western North Pacific is encouraging. Further progress in the targeted observations of the dropwindsonde surveillances and satellite data, and in the modeling and data assimilation system, is expected to lead to even greater improvement in tropical cyclone track forecasts.
1. Introduction
Over the past 30 yr, persistent and steady progress on the track forecasts of tropical cyclones (TCs) has been well demonstrated through improvements to the nu-merical models, the data assimilation and bogusing sys-tems (Kurihara et al. 1995; Xiao et al. 2000; Zou and Xiao 2000; Pu and Braun 2001; Park and Zou 2004; Wu
et al. 2006), the targeted observations (Aberson 2003), and the new data available to the forecast systems (Velden et al. 1997; Soden et al. 2001; Zou et al. 2001; Pu et al. 2002; Zhu et al. 2002; Chen et al. 2004). In addition to the large amount of satellite data, the drop-windsonde data deployed from surveillance aircraft have helped to significantly improve track forecasts (Burpee et al. 1996; Tuleya and Lord 1997; Aberson and Franklin 1999; Aberson 2002, 2004).
To the present, two major TC surveillance programs using dropwindsondes have been active for both Atlan-tic and western North Pacific storms. One is led by the National Oceanographic and Atmospheric
Administra-Corresponding author address: Chun-Chieh Wu, Dept. of
At-mospheric Sciences, National Taiwan University, No. 1, Sec. 4, Roosevelt Rd., Taipei 106, Taiwan.
E-mail: cwu@typhoon.as.ntu.edu.tw DOI: 10.1175/2007WAF2006062.1
© 2007 American Meteorological Society 1157
tion’s (NOAA) Hurricane Research Division (HRD; Aberson and Franklin 1999), and the other by the Drop-windsonde Observations for Typhoon Surveillance near the Taiwan Region (DOTSTAR; Wu et al. 2005). In this paper, the progress of both programs is reviewed in the first section. In sections 2 and 3, the impact of the dropwindsonde data from the DOTSTAR program in 2004 is evaluated based on three different operational global models and two other regional models. In con-clusion, in addition to summarizing the impact of the dropwindsonde data from DOTSTAR, issues such as the impact of other data (e.g., satellite data), bogusing and vortex initialization, and the data assimilation sys-tem role in the model’s track forecasts are also ad-dressed.
a. NOAA hurricane surveillance
In 1982, HRD began research flights to explore pos-sible improvements to numerical TC track forecasts that result from the assimilation of dropwindsonde ob-servations made in data-sparse TC environments. From 1982 to 1996, the crews of NOAA’s WP-3D aircraft, operated by the Aircraft Operations Center (AOC), made dropwindsonde observations in the environments of TCs for 19 synoptic times. The observations, coupled with the improved modeling and data assimilation, helped the Environmental Modeling Center (EMC) of NCEP to reduce track forecast errors significantly (Burpee et al. 1996; Tuleya and Lord 1997). According to Burpee et al. (1996), the increase in observational data made statistically significant contributions to the operational numerical model forecasts (improvement by 16%–30% for 12–60-h forecasts). Additionally, the dropwindsonde observations have been used in re-search, such as for identifying beta gyres and their ef-fects on TC motion (Franklin et al. 1996).
These encouraging results led to the development of a new generation of global positioning system (GPS) dropwindsondes and the purchase by NOAA of a Gulf-stream-IV (G-IV) jet aircraft that flies higher and cov-ers a larger area than did the WP-3D, enabling data to be acquired throughout the troposphere and over a larger geographical area than was previously possible. Since 1997, the G-IV has made dropwindsonde obser-vations when a TC threatens coastal areas of the United States in the Atlantic basin, near Hawaii, or off of southern California. Along with these enhancements, new satellite measurements and improved understand-ing of the atmosphere have resulted in further reduc-tions in TC track errors in the operational NOAA mod-els.
With the use of the GPS dropwindsondes, the
accu-racy of wind observations is greatly enhanced as com-pared to previous technological options (Hock and Franklin 1999). The first-year five-mission results with G-IV surveillance in 1997 revealed that GPS dropwind-sonde observations improved the Geophysical Fluid Dynamics Laboratory (GFDL) track and intensity fore-casts by as much as 32% and 20%, respectively, in the period within 48 h of projected landfall (Aberson and Franklin 1999).
Aberson (2002) continued to access the dropwind-sonde impact for 24 synoptic surveillance missions con-ducted during 1997 and 1998; statistically significant im-provements in track forecast were not obtained in a 2-yr sample. Of the three dynamical track models ex-amined, only the GFDL hurricane model was improved statistically significantly by assimilating the dropwind-sonde data, and only at 12 h. It is claimed that the amount of forecast improvement was directly related to the accuracy of the synthetic data representing the vor-tex in the model initial conditions and the amount of data coverage in the TC environment.
More recently, a strategy for identifying potential dropwindsonde release locations (targets) to optimize the likelihood that the additional observations would impact the global model TC track forecasts has been developed (Aberson 2003). This strategy employs esti-mates of initial condition uncertainty and potential er-ror growth from the NCEP operational global en-semble forecasting system and ensures adequate sam-pling of the target regions. During 2003, 13 missions were conducted. The dropwindsonde data improved the 24- and 48-h NCEP global model track forecasts by an average of 18%–32% through 5 days. Over the last 3 yr, the missions have improved the critical 36–60-h global model track forecasts by more than 20%. These forecast times are critical to issuing watches or warnings to alert the public to the threat of TCs. Some evidence suggests that the dropwindsondes produce larger fore-cast improvements for strong or rapidly intensifying storms. The annual percentage improvements from the dropwindsondes to the NCEP Global Forecast System (GFS) range from 10% to 30% for 5-day track forecasts (Aberson 2004).
b. DOTSTAR
Starting from 2003, the research program DOTSTAR has marked the beginning of a new era of TC surveil-lance and targeted observations in the western North Pacific using GPS dropwindsondes (Wu et al. 2005). DOTSTAR is a collaboration between researchers from the National Taiwan University (NTU) and the Central Weather Bureau (CWB), in partnership with
scientists at HRD and NCEP, both part of NOAA, and is built upon work pioneered by HRD to improve TC track forecasts. To maximize the use of the DOTSTAR data, the dropwindsonde soundings are transmitted and assimilated in real time into the numerical models of
CWB, NCEP, the U.S. Navy’s Fleet Numerical Meteo-rology and Oceanography Center (FNMOC), and the Japanese Meteorological Agency (JMA).
To obtain the most cost-effective data, targeted ob-servations have also been conducted in DOTSTAR. As
FIG. 1. Best tracks from JTWC (typhoon symbols for every 24 h) of the eight typhoons with 10 DOTSTAR surveillance missions in 2004. The squares indicate the storm locations when the DOTSTAR missions were conducted. The numbers on the squares represent the sequence of the missions.
7 Aere 23.8°N, 125.0°E 33.8 1200 UTC 23 Aug 2004 18 A, N, G, W 72
8 Meari 24.5°N, 129.0°E 57.2 1200 UTC 25 Sep 2004 17 A, N, G, W 72
9 Nock-ten 21.7°N, 123.2°E 33.8 1200 UTC 24 Oct 2004 13 A, N, G, W 36
shown in Wu et al. (2007), four sensitivity products have been used to determine the observation strategy for DOTSTAR, that is, the deep-layer mean (DLM) wind variance (Aberson 2003), the ensemble-transform Kalman filter (ETKF; Majumdar et al. 2002), the sin-gular vector (SV) technique (Peng and Reynolds 2006), and the adjoint-derived sensitivity steering vector (ADSSV; Wu et al. 2007). A recently updated review on the targeted observations for TC tracks can be found in Wu (2006).
With the experience gained from the successful first two surveillance flights for Typhoons Dujuan and Me-lor in 2003 (Wu et al. 2005), DOTSTAR has success-fully made routine surveillance observations for TCs within the range of the Astra jet over the western North Pacific. Throughout 2006, DOTSTAR has successfully completed 24 missions in 20 typhoons and deployed 386
dropwindsondes. In particular, DOTSTAR conducted 10 surveillance missions for Typhoons Nida, Conson, Mindulle,1Megi, Aere, Meari, Nock-ten, and Nanma-dol in 2004 and released 155 dropwindsondes. The ob-servation time, position, and intensity of the observed TCs are summarized in Table 1, and the best tracks are shown in Fig. 1. In this paper, the impact of the drop-windsonde data obtained during 2004 on global numeri-cal models from three operational centers (NCEP, FNMOC, and JMA) is evaluated. The impacts on two other regional models—the GFDL hurricane model (Kurihara et al. 1998; Wu et al. 2000) and the Weather Research and Forecasting model (WRF; Skamarock et
1Three consecutive surveillance missions were conducted for
Mindulle on 1200 UTC 27–29 June 2004, respectively. FIG. 2. The DLM (925–250 hPa) wind differences (contour interval of 0.5 m s⫺1and the magnitude of the vector is scaled in the lower-right corner outside of each panel) between the initial analyses with and without the assimilation of the dropwindsonde data for the case of Typhoon Meari for (a) NCEP GFS over east Asia (60°⫻ 60° lat–lon), (b) the blowup view of the inner box in (a) in the storm area (20°⫻ 20° lat–lon), (c) FNMOC NOGAPS in the storm area, and (d) WRF in the storm area. The black dots indicate the locations of the dropwind-sondes, and the numbers indicate the sequence of each dropwindsonde deployed.
al. 2005)—are also discussed. Note that similar runs for the cases during the 2005 and 2006 seasons have not been completed yet and will be discussed separately.
2. The model descriptions
To evaluate the impact of dropwindsonde data on numerical forecasts, three global models (the NCEP GFS, FNMOC NOGAPS, and JMA GSM) and two regional models (the NCEP–GFDL hurricane model and WRF) were used. The data from the 10 DOTSTAR missions were assimilated into the global models in real time (the control runs, i.e., GFS-D, NOGAPS-D,2and GSM-D3). The denial experiments (without the drop-windsonde data, i.e., GFS-N, NOGAPS-N, and GSM-N) are retrospective reruns. Meanwhile, the two regional models (GFDL and WRF) were retrospective reruns with the initial and boundary conditions pro-vided by the GFS-D for the control (i.e., GFDL-D and WRF-D), and by the GFS-N for the denial runs (GFDL-N and WRF-N).
It should be stressed that each pair of the above ex-periments is based on the same versions of the model with the same data assimilation system used, while no extra observations (such as satellite data) were added into the retrospective dropwindsonde-data-denial runs; that is, the only difference comes from the use of the
dropwindsonde data in each system. To further elabo-rate this issue, some discussions about the data amount problem are addressed in section 3a and in Fig. 2a.
a. NCEP GFS
The NCEP GFS (Surgi et al. 1998) is an operational global data assimilation and model system providing forecasts four times per day. During 2004, the horizon-tal resolution was spectral triangular 254 (T254) with a Gaussian grid of 768 ⫻ 384, or roughly equivalent to 0.5°⫻ 0.5° latitude–longitude grid spacing; the vertical coordinate extends from the surface to about 2.7 hPa with 64 unequally spaced sigma levels on a Lorenz grid. The NCEP Global Data Assimilation System (GDAS) is composed of a quality control algorithm, a vortex relocation procedure, an analysis procedure, and the NCEP GFS itself (Aberson 2003). Note that the NCEP GFS does not use any synthetic bogus data for TC ini-tialization, except when the vortex is too weak in the first-guess field. For all of the cases studied in this pa-per, no synthetic bogus data are applied in the NCEP GFS.
b. FNMOC NOGAPS model
NOGAPS (Hogan and Rosmond 1991) is a global forecast system with a spectral representation in the horizontal plane and a finite-difference approximation in the hybrid vertical coordinate. The operational NOGAPS has a resolution of T239 with 30 vertical lev-els. The model top extends to 1 hPa with higher reso-lutions concentrated near the surface and the top boundaries. The data quality is controlled using the techniques described by Baker (1992). The observa-tions that typically go into the data assimilation system
2In this work, outputs from both of the retrospective reruns of
NOGAPS-D and NOGAPS-N are used for the fair comparison of the impact of the dropwindsonde data.
3Only the data from the first five missions reached JMA due to
some technical problems in data transmission. Therefore, only these five cases with the dropwindsonde data in GSM are exam-ined.
FIG. 3. The 6–72-h mean track error reduction (km) after the assimilation of the dropwind-sonde data into each model for each storm case. The storm name is abbreviated by its first four letters, while Min1, Min2, and Min3 stand for the first, second, and third missions, respectively, for Mindulle.
are described by Goerss and Phoebus (1992) and in-clude all of the meteorological data available within a ⫾3-h window of the analysis time. The background used in the NOGAPS data analysis is typically the most recent 3-, 6-, and 9-h fields valid at the analysis time. NOGAPS, like the GFS, uses a three-dimensional variational data assimilation(3DVAR) scheme.
NOGAPS includes synthetic TC observations, which are treated as regular soundings at 13 points: one at the storm center; four located 220 km north, south, east, and west of the center; four located 440 km northeast, southeast, southwest, and northwest of the center; and four located 660 km north, south, east, and west of the center. Each sounding consists of 1000-hPa height and wind fields at 1000, 925, 850, 700, 500, and 400 hPa. The wind observations are the weighted sum of the large-scale environmental component and the symmetric vor-tex component. The latter is derived from a symmetric Rankin vortex in gradient balance with the structure determined by the maximum wind speed, the radius of
maximum wind, and an exponential factor governing the flow beyond the radius of maximum wind. More details can be found in Goerss and Jeffries (1994).
c. JMA GSM
The JMA GSM has a horizontal resolution on a Gaussian grid of T213 with 40 sigma levels from the surface to 0.4 hPa. (The corresponding transform grids are spaced about 0.5625° in both latitude and longi-tude) The JMA 3DVAR data assimilation system is run four times a day. The synthetic bogused sounding data of pressure, temperature, and wind are created and used in the prior analysis for the typhoon initial-ization. This type of typhoon initialization procedure is applied to all experiments with and without the dropwindsonde data, except when there are more than 14 dropwindsonde observations in the bogused area. A more detailed description of the model can be found at the JMA Web site (http://www.jma.go.jp/ TABLE 2. Track forecast verification from all models through 72 h. Forecast times in which the forecast error differences are statistically significant at the 90% confidence level are shown in boldface. “Improvement” indicates the difference between the control and the denial run, with positive (negative) values representing improved (degraded) track forecasts with the assimilation of the dropwindsonde data. P–N–E case number means the number of positive, negative, and none (smaller than 1%) track error reduction cases in each forecast time.
Model Track position error 6 12 18 24 30 36 42 48 54 60 66 72 Mean
NCEP GFS GFS-N (km) 52 76 98 133 167 171 212 246 232 246 313 294 187
GFS-D (km) 49 61 85 122 124 130 145 181 223 260 300 241 160
Improvement (km) 2 16 13 11 43 42 67 65 9 ⫺13 13 52 27
Improvement (%) 5 21 13 9 26 24 32 27 4 ⫺5 4 18 14
P–N–E case number 5–5–0 6–4–0 5–4–1 5–4–0 5–3–1 5–4–0 6–2–0 7–1–0 2–5–0 1–6–0 3–4–0 2–4–0 FNMOC NOGAPS NOGAPS-N (km) 58 95 131 167 218 253 281 367 445 527 624 501 306 NOGAPS-D (km) 50 81 115 154 197 232 276 344 384 410 479 437 263 Improvement (km) 8 14 17 12 21 21 5 23 61 117 146 65 43 Improvement (%) 14 15 13 7 10 8 2 6 14 22 23 13 14
P–N–E case number 8–2–0 7–3–0 6–4–0 6–3–0 6–3–0 5–4–0 5–3–0 5–3–0 5–3–0 5–3–0 5–3–0 4–3–0
JMA GSM GSM-N (km) 46 80 114 151 203 223 269 355 411 460 590 405 276
GSM-D (km) 38 55 95 114 135 180 212 279 330 393 486 349 222
Improvement (km) 9 25 19 37 68 43 57 76 81 67 104 55 53
Improvement (%) 19 32 17 25 33 19 21 21 20 14 18 14 19
P–N–E case number 4–1–0 5–0–0 4–1–0 4–1–0 4–1–0 2–3–0 3–2–0 3–2–0 3–2–0 3–2–0 3–2–0 3–1–0 Ensemble Mean ENS-N (km) 45 67 87 114 150 166 200 267 338 411 528 499 239 ENS-D (km) 38 50 72 97 113 134 170 224 283 320 393 359 188 Improvement (km) 8 17 15 17 38 32 30 43 56 91 135 140 52 Improvement (%) 17 25 17 15 25 19 15 16 16 22 26 28 22
P–N–E case number 9–1–0 9–1–0 6–4–0 5–4–0 6–3–0 6–3–0 4–4–0 5–3–0 4–4–0 5–3–0 4–4–0 4–3–0
GFDL GFDL-N (km) 28 53 76 92 132 163 164 209 243 276 333 270 170
GFDL-D (km) 27 55 88 112 145 180 198 226 227 237 287 203 165
Improvement (km) 1 0 ⫺11 ⫺18 ⫺12 ⫺16 ⫺32 ⫺16 16 39 46 67 4
Improvement (%) 4 ⫺2 ⫺15 ⫺20 ⫺9 ⫺9 ⫺19 ⫺7 6 14 14 25 3
P–N–E case number 3–4–3 4–5–1 2–7–1 3–6–0 4–5–0 3–6–0 2–6–0 2–6–0 3–5–0 4–4–0 5–3–0 4–3–0
WRF WRF-N (km) 54 91 125 154 185 218 292 212 253 260 301 336 207
WRF-D (km) 54 69 96 119 144 171 207 192 222 241 267 306 174
Improvement (km) 0 21 30 35 41 47 85 20 31 19 34 30 33
Improvement (%) 0 24 24 23 22 22 29 9 12 7 11 9 16
JMA_HP/jma/jma-eng/jma-center/nwp/outline-nwp/ index.htm).
d. GFDL hurricane model
The GFDL hurricane model is a limited-area gridded model developed specifically for hurricane prediction. It includes 42 sigma levels and uses a horizontal finite-difference method with three nested grids. The two in-ner grids move to follow the storm, and the resolution of the inner domain is 1/6°. The GFDL hurricane model includes convective, radiative, and boundary layer pa-rameterizations and has a specialized method for ini-tializing the storm circulation such that the storm cir-culation in the global analysis is replaced with the sum of an environmental flow and a vortex generated by nudging the fields in a separate run of the model to an idealized vortex based upon a few observed param-eters, including the maximum wind, radius of maximum
wind, and outer wind radii. The environmental flow is the global analysis modified by a filtering technique that removes the hurricane circulation. This filtering and bogusing technique will mask some of the data impact from the dropwindsonde (Tuleya and Lord 1997). A more detailed description of the GFDL hur-ricane model can be found in Kurihara et al. (1993, 1995, 1998).
The analyses and forecast fields from both GFS-D and GFS-N are used to drive the GFDL model and to assess the impact of the dropwindsonde data to GFDL. It should be noted that the vortex initialization is per-formed after the analyzed global fields are interpolated into the experiments conducted here.
e. WRF model
The previous four models are all for operational use. The WRF model is a next-generation mesoscale nu-FIG. 4. The JTWC best track (typhoon symbols), and the GFS-N (circles) and GFS-D (dots)
forecast tracks of Typhoon Meari initialized at 1200 UTC 25 Sep 2004. Track errors are shown at the bottom of the figure. TKE is the track error (km) and IMP (%) is the track error improvement.
merical weather prediction system designed to cater to both operational forecasting and atmospheric research needs. It features multiple dynamical cores, a 3DVAR data assimilation system, and a software architecture allowing for computational parallelism and system ex-tensibility (Skamarock et al. 2005). A single mesh with 54-km horizontal resolution (161⫻ 121 grid points in the east–west and north–south) and 31 sigma layers of vertical resolution (from the surface to 10 hPa) is used in this study.
For the WRF model experiments, in order to avoid
the extra influence from the bogusing scheme, no bo-gusing or relocation is used in the WRF experiments. The analyses and forecast fields from both GFS-D and GFS-N are used to drive the WRF model and to assess the impact of the dropwindsonde data upon WRF. Note that separate experiments have also been con-ducted to initialize the WRF model from the NCEP GFS-N, while extra comparison experiments are done with the dropwindsonde data assimilated into WRF through the 3DVAR system (denoted as WRF-D-3DVAR).
FIG. 5. The asymmetric DLM (925–250 hPa) wind at the initial time for the case of Typhoon Meari for (a) GFS-N, (b) GFS-D, and (c) the difference between GFS-D and GFS-N. The solid vectors, V07-GFS-N, V07-GFS-D, and
V07-dif, in (d) show the wind vector averaged over the inner 7° circle around the storm center for (a), (b), and (c),
3. Results
a. Impact of the dropwindsondes data on the model analyses
It is well known that TC motion is mainly governed by the environmental steering flow (Chan and Gray 1982), generally defined as the tropospheric (e.g., 925– 250-hPa deep-layer mean; DLM) average wind within the storm area. Therefore, following Aberson (2003) and Wu et al. (2005), the DLM wind is used to access the impact of the dropwindsonde data on the model analyses. Figure 2a shows the difference in the 925–250-hPa DLM winds between the control and denial GFS experiments (GFS-D and GFS-N) for Typhoon Meari at 1200 UTC 25 September 2004. Figure 2a clearly shows that the DLM wind difference only appears around Typhoon Meari, where the dropwindsondes were deployed, thus indicating that other than the dropwindsonde data, both the denial and control ex-periments use the same data amount.
Figure 2b shows the detailed DLM wind difference in the inner box of Fig. 2a. It can be clearly seen that the major differences are present at the dropwindsonde lo-cations, with a maximum difference of about 4 m s⫺1to
the south of Meari where the fourth–seventh dropwind-sondes were released. On the other hand, the difference in DLM winds between NOGAPS-D and NOGAPS-N (Fig. 2c) is smaller, with a maximum of about 1.5 m s⫺1 to the east of Meari, near the eighth and ninth drop-windsondes. Thus, the largest impact on the analysis is near the dropwindsonde locations in both models. Note that the different increments in Figs. 2b and 2c can arise from the differences in the data assimilation schemes, the first-guess fields, and the synthetic bogused data between the GFS and NOGAPS models.
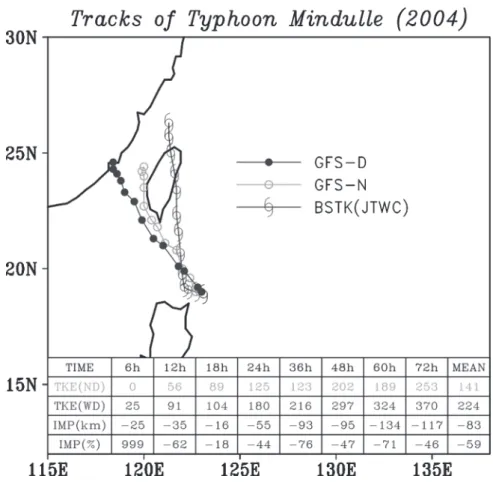
On the other hand, since the WRF experiments are directly initialized with the GFS outputs, there is almost no difference in the DLM wind between the WRF-D and WRF-N experiments (figures not shown). How-ever, when the dropwindsonde data are assimilated into the WRF through the 3DVAR data assimilation sys-tem of WRF, the comparison of WRF-3DVAR and WRF-N (Fig. 2d) shows a similar pattern to that of GFS in Fig. 2b, with the maximum value of about 5 m s⫺1to the south of Meari near the fourth–seventh dropwindsondes. However, some difference appears as the DLM wind difference pattern shifts slightly out-ward as compared to that in GFS, which is likely due to FIG. 6. Same as in Fig. 4 but for Typhoon Mindulle initialized at 1200 UTC 29 Jun 2004.
the different data assimilation systems used in GFS and WRF.
b. Impact of the dropwindsonde data on the typhoon track predictions in global models
To evaluate the impact of the dropwindsonde data, the model tracks from all experiments are verified against the best tracks of Joint Typhoon Warning Cen-ter (JTWC). Note that all model tracks are obtained from the model outputs at their original model resolu-tion as described in secresolu-tion 2, with the excepresolu-tion that for NOGAPS the storm locations are identified from the downgraded 1°-resolution products.
1) NCEP GFS
The forecast tracks from both the control and denial experiments are compared against the best tracks from JTWC for all 10 DOTSTAR missions in the GFS model (detailed tracks of each case are not shown here). More distinct track differences are found for the cases of Conson, Mindulle, Megi, and Meari than those
associ-ated with Nida, Aere, Nock-ten, and Nanmadol. Figure 3 shows the 6–72-h mean track error reduction due to the assimilation of the dropwindsonde data into each model for each storm case. For the 10 cases examined by the GFS, the number of cases with mean 6–72-h positive (negative) improvement is 6 (4) (Fig. 3, Table 2). Conson, Megi, and Meari are the three cases with more significant improvement, with 6–72-h average track error reduction of 48, 84, and 218 km, respec-tively. On the other hand, a large negative impact oc-curs for the third surveillance mission of Mindulle, with a 6–72-h mean track error increase of about 84 km. For the other cases, the average impact of the dropwind-sonde data to the GFS is insignificantly positive or negative.
The case-averaged impacts of the dropwindsonde data for each forecasting time on NCEP GFS track forecasts for all 10 DOTSTAR missions in 2004 are shown in Table 2. The dropwindsonde data lead to mean track error reductions of up to 32% through 72 h, and an average improvement of 14%. Due to the lim-ited number of cases, only the improvements at 42 and 48 h are statistically significant at the 90% confidence FIG. 7. Same as in Fig. 4 but for NOGAPS and Typhoon Conson initialized at 1200 UTC 8
level [paired test with one-sided distribution; Larsen and Marx (1981)].
Of the 10 cases, Typhoon Meari at 1200 UTC 25 September 2004 has the largest track forecast improve-ment, and the third mission of Typhoon Mindulle at 1200 UTC 29 June 2004 has the largest forecast degra-dation. Figure 4 shows the GFS track forecasts from both the control and denial runs for the Meari case. Both the control and denial runs overpredict the west-ward motion during the first 12 h and have a southwest-ward bias through 24 h. These biases led to less interaction between Meari and an approaching midlatitude trough, and thus the model cannot predict the recurvature of Meari near Okinawa. Nevertheless, a greatly improved track forecast is provided by the control run as compared to the denial run. The factors leading to this improved forecast are presented in Huang et al. (2006).
As shown above, among all of the cases examined in GFS, Meari is the case with the most track improve-ment. In particular, the track difference between
GFS-N and GFS-D in the first 6 h is already very dis-tinct (Fig. 4). The asymmetric wind fields (total wind– azimuthal mean vortex) at the initial time are examined to explain such distinct differences. Figures 5a and 5b show the asymmetric DLM (averaged from 925 to 250 hPa) wind for GFS-N and GFS-D. It can be shown that the asymmetric DLM southeasterly flow near the storm center has a less northward component in GFS-N (Fig. 5a) than it does in GFS-D (Fig. 5b). In other words, the difference of the two asymmetric DLM winds (Fig. 5c) between GFS-D and GFS-N shows a slight southwest-erly difference of 2–4 m s⫺1, which is consistent with the total DLM wind difference of a southwesterly to the southeast of the storm center in Fig. 2b. In Fig. 5d, the steering flow is estimated by averaging the asymmetric DLM wind vector in the inner 7° circle around the storm center. It is found in Fig. 5d that GFS-D contains more northward steering flow than is associated with GFS-N, with the vector difference pointing northeast-ward, which is consistent with the difference of the tracks between GFS-D and GFS-N in Fig. 4.
FIG. 8. Same as in Fig. 4 but for NOGAPS and Typhoon Meari initialized at 1200 UTC 25 Sep 2004.
For the Mindulle case, neither the control nor the denial run predict the sudden northward swerve of the storm at about 24 h (Fig. 6). The control run has a more westward track than does the denial run, substantially degrading the forecast. Further work is needed to in-vestigate why the dropwindsonde data have a negative impact on this particular case.
2) NOGAPS
A similar comparison has also been done using NOGAPS (Fig. 3, Table 2). For the 10 cases examined by the NOGAPS, the number of cases with mean 6–72-h positive (negative) improvement is also 6 (4) (Fig. 3, Table 2). Nevertheless, it is Conson and Megi that has the most significant improvement; while, dif-ferent from the impact upon the GFS, somewhat large degradation occurs for Meari in NOGAPS. Note that the average track errors of NOGAPS are generally much larger than those from the GFS. The dropwind-sonde data contribute to a modest improvement in NOGAPS track predictions, though only the 6-h fore-cast differences are statistically significant at the 90% confidence level.
In NOGAPS, the dropwindsonde data show the most positive (negative) impact in the Typhoon Conson case at 1200 UTC 8 June 2004 (Typhoon Meari at 1200 UTC 25 September 2004). For Conson (Fig. 7), the drop-windsonde data cause the model to accelerate the ty-phoon northward, reducing the track error by an aver-age of about 28%.
On the other hand, even though the dropwindsonde data show the most positive impact in the GFS in the Meari case (Fig. 8), the dropwindsonde data have the largest negative impact in NOGAPS. Though the NOGAPS control run recurves Meari too rapidly after 36 h, its track was closer to the best track than that of the denial run; therefore, in this case, the dropwind-sonde data improved the cross-track forecast, but se-verely degraded the along-track forecast.
3) JMA GSM
Due to some since-resolved technical problems in data transmission, the JMA only received the drop-windsonde data for the first five cases of 2004, and only these five cases are examined. The dropwindsonde data have a substantial positive impact on the track forecasts FIG. 9. Same as in Fig. 4 but for GSM and Typhoon Conson initialized at 1200 UTC 8 Jun
through 72 h (Table 2), and the average improvement during the first 72 h is 19%. Due to the limited number of cases, only the forecasts at 12, 18, 30, and 54 h are statistically significant at the 90% confidence level.
Among the five cases examined in GSM, three cases show distinct positive impact, with the remaining two cases of some slightly negative impact (Fig. 3). In par-ticular, the dropwindsonde data show a very large posi-tive impact on the case of Typhoon Conson at 1200 UTC 8 June 2004 (Fig. 9). When no dropwindsonde data are assimilated, the typhoon is forecast to make landfall in Taiwan, leading to huge track prediction er-rors. When the dropwindsonde data are assimilated, the model better forecasts the movement of Conson along the east coast of Taiwan, though the forecast motion remains too slow. These results have also been exam-ined by a JMA research group in a technical report with similar findings (T. Shimbori 2004, personal communi-cation).
The first mission of the Mindulle case (1200 UTC 27 June) is the one with the most negative impact from the dropwindsondes percentage-wise in the GSM (Figs. 3 and 10). However, the errors both with and without the
dropwindsonde data are very slight, which causes the large percentage degradations.
4) THE MODEL ENSEMBLE MEAN
The ensemble mean of various model forecasts (Burpee et al. 1996; Zhang and Krishnamurti 1997; Goerss 2000) is frequently used as track guidance by typhoon forecasters. The ensemble means of the three global models are calculated both with and without the dropwindsonde data to assess their impact. Overall, Fig. 3 shows that except for Mindulle, all other cases are showing a 6–72-h mean positive impact. In particular, significant improvement occurs for Conson, Megi, and Meari, each case with a 6–72-h mean track error reduc-tion of more than 100 km. The impact from the drop-windsonde data is larger in the ensemble mean than in each individual model, as reported in Burpee et al. (1996), and many of the forecasts are statistically sig-nificant at the 90% confidence level.
Figure 11 shows scatter diagrams and the least-square-fit lines of all forecast errors (from 6 to 72 h) for both the control and denial experiments of the GFS, NOGAPS, GSM, and the three-model ensemble (ENS), FIG. 10. Same as in Fig. 4 but for Typhoon Mindulle initialized at 1200 UTC 27 Jun 2004.
respectively. Most of the points, as well as the regres-sion line, are located to the upper left of the diagonal line, indicating that the model forecasts with the drop-windsonde data generally have smaller errors than do the denial runs, especially for points with large track errors. In addition, Fig. 11d clearly indicates a further enhancement of the positive impact of ENS with more points shifted to the upper-left side of the plot. Further-more, the regression line for the ENS is shifted to the left of, and has a larger slope than, the lines from the constituent models.
c. Impact of the dropwindsonde data on the regional models
1) GFDLHURRICANE MODEL
The impacts of the dropwindsonde data on the GFDL hurricane and WRF mesoscale models are shown in Table 2. In the first 48 h, the impact of the dropwindsonde data on the GFDL hurricane model
forecasts is generally negative, though none of the dif-ferences are significant. The impact of the dropwind-sonde data becomes positive by 48 h, with substantial improvement of 15%–25% thereafter; the 72-h im-provement is statistically significant. The average track error reduction in the GFDL hurricane model with the use of the dropwindsonde data is an insignificant 3%. Note that errors in the GFDL models are smaller than for the other models, which could be one reason for forecast degradation.
Like the results in the GFS model, the dropwind-sonde data have the most positive impact on the track prediction of Typhoon Meari (Figs. 3 and 12). In the control run, the model forecasts the interaction of an approaching midlatitude trough very well, and the re-curvature point of Meari is very close to that indicated in the best-track of JTWC, though the eastward trans-lational speed is slightly underestimated afterward. The track error is reduced with the assimilation of the drop-windsonde data, and the GFDL hurricane model pro-FIG. 11. Scatterplots of model track forecast errors with and without dropwindsonde data
during the first 72 h, every 6 h for (a) GFS, (b) NOGAPS, (c) GSM, and (d) global model ensemble mean forecasts. The least-square-fit lines and equations are shown. Here, NP rep-resents the total number of points in each figure.
vides the best Meari forecast among all of models used in this study.
On the other hand, Typhoon Megi is the case in which the dropwindsonde data have the largest nega-tive impact on the GFDL model (Figs. 3 and 13). The track from the control run overpredicts the eastward motion, leading to a track error of about 200 km at 48 h. To understand why the dropwindsonde data gener-ally degrades the GFDL model forecasts, the DLM winds from the dropwindsonde data and the GFDL-N and GFDL-D DLM wind analyses are compared (Figs. 14a and 14b). The DLM wind difference between the dropwindsondes and the control run is very small, but the maximum DLM wind difference between drop-windsonde soundings and the model analysis interpo-lated to the sounding locations is to the east of Megi (14.8 and 14.2 m s⫺1 for GFDL-N and GFDL-D, re-spectively). The root-mean-square error (RMSE) of the DLM wind difference among the 16 soundings is 6.7 (6.8) m s⫺1 for GFDL-N (GFDL-D). A similar com-parison is also performed with the GFS (Figs. 14c and
14d). The maximum and the RMSE DLM wind differ-ences in GFS-D are much smaller than that in GFS-N [the maximum (RMSE) DLM difference is 4.7 (2.0) m s⫺1in GFS-D and 11.3 (5.4) m s⫺1in GFS-N].
To ensure that the above results can be generalized, the above analysis is also applied to all seven other cases (except for Meari and Nanmadol, where the ar-chived data were unfortunately lost). As shown in Table 3, in agreement with the case of Megi (Fig. 14), the maximum (RMSE) of the DLM wind differences for all eight cases are reduced by 0–3 (0–1) m s⫺1when the dropwindsonde data are assimilated. On the other hand, the maximum, as well as the RMSE, of the DLM wind differences in GFDL-D remain about the same as those in GFDL-N in all eight cases.
The above analysis indicates that the initial condi-tions of the GFDL hurricane model are not being ef-fectively nudged toward the dropwindsonde data, thus lessening any forecast impact. Tuleya and Lord (1997) showed that the bogusing system retarded the positive impact of dropwindsondes for as long as 2 days, al-FIG. 12. Same as in Fig. 4 but for GFDL and Typhoon Meari initialized at 1200 UTC 25
though the overall positive impact was quiet large (20%). The result that the largest improvement in the GFDL model in this study was for forecasts beyond 60 h appears to be consistent with the findings of Tuleya and Lord (1997), as well as with the recent hurricane surveillance program in the western Atlantic conducted by NOAA (Aberson 2003; Aberson and Etherton 2006). An optimal way of appropriately combining the dropwindsonde data with the bogused vortex is needed in order to improve the impact of the dropwindsonde data. Separate work to investigate this issue is ongoing (Chou and Wu 2008).
2) WRFMODEL
The impact of the dropwindsonde data on the WRF model is shown in Fig. 3 and Table 2. Although there are six cases showing a slightly negative impact in track predictions, there exist nonetheless three cases (Con-son, Megi, and Meari) with significant track error ductions in WRF. Overall, the dropwindsonde data re-duce the track error modestly within the first 72 h, and
this result is similar to that of the GFS (Table 2). This consistent result is not surprising since the initial and boundary conditions are directly interpolated from the forecast of the appropriate GFS runs. Moreover, as a second set of runs in WRF (i.e., WRF-D-3DVAR), the dropwindsonde data are also assimilated directly into the WRF model using its 3DVAR system (Barker et al. 2004), and the overall impact is roughly the same (fig-ures not shown). A detailed investigation on how dif-ferent data assimilation schemes affect the impact of data in mesoscale models [e.g., the fifth-generation Pennsylvania State University–National Center for At-mospheric Research Mesoscale Model (MM5) and WRF] is presented in Huang et al. (2006).
d. Overall comparison
Note that all of the above evaluations are conducted based on different modeling and data assimilation sys-tems with different background analyses. One may an-ticipate that all GFS-based model runs would show a FIG. 13. Same as in Fig. 4 but for Typhoon Megi initialized at 1200 UTC 16 Aug 2004.
higher correlation with each other than to GSM and NOGAPS, which have different analysis systems. To investigate this issue, as shown in Fig. 15, we also cal-culate the correlation of the mean track error reduction between the NCEP GFS and each other model (namely, NOGAPS, GSM, GFDL, and WRF). Indeed, since the WRF experiments are based on the analyses
from GFS, high correlation between WRF and GFS of about 0.5–0.8 is demonstrated. However, even though the GFDL system also uses the GFS analyses, the cor-relation between GFDL and GFS experiments is some-what reduced to 0.3–0.7, which is likely due to the vor-tex initialization issues as discussed in the previous sec-tion. For the correlation between the GFS and the FIG. 14. Comparison of the DLM (925–250 hPa) wind from the dropwindsonde soundings
(gray wind barb) and the model analyses (black wind barb, interpolated to the location of each sounding location) for the initial conditions of Typhoon Megi for (a) GFDL-N, (b) GFDL-D, (c) GFS-N, and (d) GFS-D. The dot is where the greatest DLM difference appears among the 16 released dropwindsondes. The values indicated in the upper-left corner show the values of the maximum DLM difference and the RMSE among all dropwindsondes.
TABLE3. Comparison of the DLM (925–250 hPa) winds between the dropwindsonde soundings and the model analyses as shown in Fig. 14 for eight archived cases. The numbers show the largest deep-layer mean wind differences (m s⫺1), with the RMSE in the parentheses.
Expt Nida Conson Mindulle-1 Mindulle-2 Mindulle-3 Megi Aere Nock-ten
GFS-N 11.4 (4.5) 8.6 (4.1) 18.6 (9.6) 11.2 (6.6) 11.8 (6.6) 11.3 (5.4) 10.3 (4.7) 4.4 (2.7) GFS-D 8.3 (2.7) 3.3 (1.8) 8.0 (3.8) 3.0 (1.9) 5.3 (3.0) 4.7 (2.0) 4.8 (2.0) 3.3 (1.7) GFDL-N 7.2 (3.0) 4.0 (2.9) 13.4 (7.7) 11.0 (7.4) 13.3 (8.1) 14.8 (6.7) 11.0 (7.4) 7.3 (4.8) GFDL-D 7.2 (3.1) 5.7 (3.9) 10.9 (6.6) 10.1 (6.6) 12.2 (7.5) 14.2 (6.8) 10.2 (7.1) 7.6 (4.9)
other global models (NOGAPS and GSM), it is found that the correlation is much lower or and even becomes negative at certain forecast times.
4. Conclusions
Since 2003, DOTSTAR has successfully made rou-tine surveillance observations for TCs within the range of the Astra jet over the western North Pacific. Throughout 2006, DOTSTAR has successfully com-pleted 24 missions in 20 typhoons and deployed 386 dropwindsondes. Five models (four operational and one research) were used to evaluate the impact of drop-windsonde data on TC track forecasts for the 10 sur-veillance cases during 2004 (note that similar runs for the cases during the 2005 and 2006 seasons have not yet been completed). All models, except the GFDL hurri-cane model, show positive impacts from the dropwind-sonde data on TC track forecasts. In the first 72 h, the mean track error reductions in three operational global models, NCEP GFS, NOGAPS, and JMA GSM, are about 14%, 14%, and 19%, respectively, and the mean track error reduction of the ensemble of the three glo-bal models is 22%. The track error reduction in the Weather Research and Forecasting (WRF) Model, in which the initial conditions are directly interpolated from the operational GFS analysis, is 16%. Very little mean track improvement (3%) is shown in the GFDL model, likely because the dropwindsonde data are af-fected by the model’s vortex initialization scheme.
Note that the above results are based on limited DOTSTAR cases examined in 2004, thus making the obtained statistics less significant. Detailed studies of more DOTSTAR cases in the future will be needed to provide significant statistics on the impact of the
drop-windsonde data. Further research on the impact of dropwindsonde data on numerical models, and on op-timal deployment strategies for the data, is ongoing. A new method of identifying sensitive areas to target ob-servations for TC prediction based on the adjoint model has been proposed (Wu et al. 2007). Moreover, the impact of dropwindsonde data on Typhoons Meari and Conson has been analyzed and evaluated in more detail (Huang et al. 2006). In addition, the optimal com-bination of dropwindsonde data and bogused vortices in the model initializations has also been studied (Chou and Wu 2008).
In addition to the positive impact of the dropwind-sonde shown here, it should be noted that with the progress of the model and data assimilation system, and with more and more satellite-derived data, as well as the synthetic bogusing technique and the relocation procedure used in the model, track forecasts have been improving over time, and thus making the relative im-pact of the dropwindsondes less significant. On the other hand, in addition to the use of the dropwindsonde data, the satellite data (Velden et al. 1997; Soden et al. 2001; Zou et al. 2001; Pu et al. 2002; Zhu et al. 2002; Chen et al. 2004) and the improvement of the initial-ization procedures (Kurihara et al. 1995; Xiao et al. 2000; Zou and Xiao 2000; Pu and Braun 2001; Park and Zou 2004; Wu et al. 2006) have also been playing vital roles in improving the TC track forecast. How to im-prove the future targeted observations (including both the dropwindsonde and satellite data) and how to op-timally make use of the available data with the appro-priate vortex initialization in the data assimilation sys-tem are two of the most compelling issues for future researches in their efforts to improve TC track forecasts (Wu 2006).
As a final note, DOTSTAR surveillance missions are planned at least through 2008 and are being coordi-nated with the The Observing System Research and Predictability Experiment (THORPEX) Pacific Area Regional Campaign (T-PARC) in 2008 (D. Parsons and P. Harr 2006, personal communication). With the po-tential collaboration between the DOTSTAR and the T-PARC (e.g., NRL P-3 and HIAPER or the DLR Falcon) aircrafts, coupled with the use of a driftsonde, a unique and unprecedented dataset can be acquired with the aim of making significant progress in both sci-entific research and forecasting of typhoons in the west-ern North Pacific.
Acknowledgments. The work is supported through
the National Science Council of Taiwan by Grants NSC93-2119-M-002-013-AP1 and MOTC-CWB-95-6M-03, and through the Office of Naval Research by FIG. 15. Correlation of the mean track error reduction (km)
between the NCEP GFS and each of the other models (NOGAPS, GSM, GFDL, and WRF) at each forecast time.
——, 2003: Targeted observations to improve operational tropical cyclone track forecast guidance. Mon. Wea. Rev., 131, 1613– 1628.
——, 2004: The G-IV surveillance era, targeting, and ensemble forecasts (1997–Present). Preprints, 26th Conf. on Hurricanes
and Tropical Meteorology, Miami, FL, Amer. Meteor. Soc.,
236–237.
——, and J. L. Franklin, 1999: Impact on hurricane track and intensity forecasts of GPS dropwindsonde observations from the first-season flights of the NOAA Gulfstream-IV jet air-craft. Bull. Amer. Meteor. Soc., 80, 421–427.
——, and B. J. Etherton, 2006: Targeting and data assimilation studies during Hurricane Humberto (2001). J. Atmos. Sci., 63, 175–186.
Baker, N. L., 1992: Quality control for the navy operational at-mospheric data base. Wea. Forecasting, 7, 250–261. Barker, D. M., W. Huang, Y.-R. Guo, A. J. Bourgeois, and Q. N.
Xiao, 2004: A three-dimensional variational data assimilation system for MM5: Implementation and initial results. Mon.
Wea. Rev., 132, 897–914.
Burpee, R. W., S. D. Aberson, J. L. Franklin, S. J. Lord, and R. E. Tuleya, 1996: The impact of omega dropwindsondes on op-erational hurricane track forecast models. Bull. Amer.
Me-teor. Soc., 77, 925–933.
Chan, J. C. L., and W. M. Gray, 1982: Tropical cyclone movement and surrounding flow relationships. Mon. Wea. Rev., 110, 1354–1374.
Chen, S.-H., F. C. Vandenberghe, G. W. Petty, and J. F. Bresch, 2004: Application of SSM/I satellite data to a hurricane simu-lation. Quart. J. Roy. Meteor. Soc., 130, 801–825.
Chou, K.-H., and C.-C. Wu, 2008: Typhoon initialization in a me-soscale model: Combination of the bogused vortex and the dropwindsonde data in DOTSTAR. Mon. Wea. Rev., in press.
Franklin, K. L., S. E. Feuer, J. Kaplan, and S. D. Aberson, 1996: Tropical cyclone motion and surrounding flow relationships: Searching for beta gyres in omega dropwindsonde datasets.
Mon. Wea. Rev., 124, 64–84.
Goerss, J. S., 2000: Tropical cyclone track forecasts using an en-semble of dynamical models. Mon. Wea. Rev., 128, 1187– 1193.
——, and P. A. Phoebus, 1992: The navy’s operational atmo-spheric analysis. Wea. Forecasting, 7, 232–249.
——, and R. A. Jeffries, 1994: Assimilation of synthetic tropical cyclone observations into the Navy Operational Global At-mospheric Prediction System. Wea. Forecasting, 9, 557–576. Hock, T. F., and J. L. Franklin, 1999: The NCAR GPS
dropwind-sonde. Bull. Amer. Meteor. Soc., 80, 407–420.
——, ——, ——, and ——, 1998: The GFDL Hurricane Prediction System and its performance in the 1995 hurricane season.
Mon. Wea. Rev., 126, 1306–1322.
Larsen, R. J., and M. L. Marx, 1981: An Introduction to
Math-ematical Statistics and Its Applications. Prentice Hall, 530 pp.
Majumdar, S. J., C. H. Bishop, R. Buizza, and R. Gelaro, 2002: A comparison of ensemble-transform Kalman-filter targeting guidance with ECMWF and NRL total-energy singular-vector guidance. Quart. J. Roy. Meteor. Soc., 128, 2527–2549. Park, K., and X. Zou, 2004: Toward developing an objective 4DVAR BDA scheme for Hurricane initialization based on TPC observed parameters. Mon. Wea. Rev., 132, 2054–2069. Peng, M. S., and C. A. Reynolds, 2006: Sensitivity of tropical cy-clone forecasts as revealed by singular vectors. J. Atmos. Sci.,
63, 2508–2528.
Pu, Z.-X., and S. A. Braun, 2001: Evaluation of bogus vortex tech-niques with four-dimensional variational data assimilation.
Mon. Wea. Rev., 129, 2023–2039.
——, W.-K. Tao, S. Braun, J. Simpson, Y. Jia, H. Halverson, W. Olson, and A. Hou, 2002: The impact of TRMM data on mesoscale numerical simulation of Supertyphoon Paka. Mon.
Wea. Rev., 130, 2448–2458.
Skamarock, W. C., J. B. Klemp, J. Dudhia, D. O. Gill, D. M. Barker, W. Wang, and J. G. Powers, 2005: A description of the Advanced Research WRF version 2. NCAR/TN-468⫹STR, National Center for Atmospheric Research, Boul-der, CO, 88 pp.
Soden, B. J., C. S. Velden, and R. E. Tuleya, 2001: The impact of satellite winds on experimental GFDL hurricane model fore-casts. Mon. Wea. Rev., 129, 835–852.
Surgi, N., H.-L. Pan, and S. J. Lord, 1998: Improvement of the NCEP global model over the Tropics: An evaluation of model performance during the 1995 hurricane season. Mon.
Wea. Rev., 126, 1287–1305.
Tuleya, R. E., and S. J. Lord, 1997: The impact of dropwindsonde data on GFDL hurricane model forecasts using global analy-ses. Wea. Forecasting, 12, 307–323.
Velden, C. S., C. M. Hayden, S. J. Nieman, W. P. Menzel, S. Wan-zong, and J. S. Goerss, 1997: Upper-tropospheric winds de-rived from geostationary satellite water vapor observations.
Bull. Amer. Meteor. Soc., 78, 173–195.
Wu, C.-C., 2006: Targeted observation and data assimilation in track prediction. Proc. Sixth Int. Workshop on Tropical
Cy-clones (IWTC-VI), WMO TMRP 72, San José, Costa Rica,
WMO, 409–423.
——, M. Bender, and Y. Kurihara, 2000: Typhoon forecasts with the GFDL hurricane model: Forecast skill and comparison of predictions using AVN and NOGAPS global analyses. J.
——, and Coauthors, 2005: Dropwindsonde Observations for Ty-phoon Surveillance near the Taiwan Region (DOTSTAR): An overview. Bull. Amer. Meteor. Soc., 86, 787–790. ——, K.-H. Chou, Y. Wang, and Y.-H. Kuo, 2006: Tropical
cy-clone initialization and prediction based on four-dimensional variational data assimilation. J. Atmos. Sci., 63, 2383–2395. ——, J.-H. Chen, P.-H. Lin, and K.-H. Chou, 2007: Targeted
ob-servations of tropical cyclone movement based on the ad-joint-derived sensitivity steering vector. J. Atmos. Sci., 64, 2611–2626.
Xiao, Q., X. Zou, and B. Wang, 2000: Initialization and simulation of a landfalling hurricane using a variational bogus data as-similation scheme. Mon. Wea. Rev., 128, 2252–2269.
Zhang, Z., and T. N. Krishnamurti, 1997: Ensemble forecasting of hurricane tracks. Bull. Amer. Meteor. Soc., 78, 2785–2795. Zhu, T., D.-L. Zhang, and F. Weng, 2002: Impact of the Advanced
Microwave Sounding Unit measurements on hurricane pre-diction. Mon. Wea. Rev., 130, 2416–2432.
Zou, X., and Q. Xiao, 2000: Studies on the initialization and simu-lation of a mature hurricane using a variational bogus data assimilation scheme. J. Atmos. Sci., 57, 836–860.
——, ——, A. E. Lipton, and G. D. Modica, 2001: A numerical study of the effect of GOES sounder cloud-cleared brightness temperatures on the prediction of Hurricane Felix. J. Appl.