Risk factors for ovarian cancer in Taiwan: a case– control study
in a low-incidence population
Men-luh Yen, M.D.,
a,bBetty L. Yen, M.D.,
bChyi-huey Bai, Ph.D.,
cand Ruey S. Lin, M.D., Ph.D.
d,*
aDepartment of General Medicine, College of Medicine, National Taiwan University Hospital and National Taiwan University, Taipei, Taiwan bDepartment of Obstetrics and Gynecology, College of Medicine, National Taiwan University Hospital and National Taiwan University, Taipei, Taiwan
cDivision of Epidemiology and Public Health, Institute of Biomedical Sciences, Academia Sinica, Taipei, Taiwan dInstitute of Epidemiology, College of Public Health, National Taiwan University, No. 19, Hsu-Chow Road, 100 Taipei, Taiwan
Received 27 September 2002
Abstract
Objective. We conducted a case– control study to identify risk factors for ovarian cancer in Taiwan, a low-incidence population where
the incidence has been on the rise.
Methods. Cases were 86 women (age range 20 –75, median 47) drawn from patients with primary, invasive epithelial ovarian cancer
diagnosed between 1993 and 1998 in the Taipei metropolitan area, with the following histologic subtypes: 35% serous, 27% mucinous, 21% endometrioid, 15% clear cell, and 2% unspecified adenocarcinoma. Controls were 369 women (age range 20 –75, median 44) selected from patients who were hospitalized at the same time for treatment of unrelated diseases. Subjects were interviewed in person regarding sociodemographic and reproductive characteristics, family and medical history, and diet.
Results. A strong inverse relationship of ovarian cancer to each live birth was observed (odds ratio (OR)⫽ 0.43, 95% confidence interval
(CI)⫽ 0.20–0.89; OR ⫽ 0.30, 95% CI ⫽ 0.13–0.69; and OR ⫽ 0.18, 95% CI ⫽ 0.05–0.62 for parity of 1 or 2, 3–5, and ⬎5, respectively). Menopause was associated with increased risk of disease (OR⫽ 2.15, 95% CI ⫽ 1.21–3.83). A trend toward protection was seen with breastfeeding for more than 1 year (OR⫽ 0.55, 95% CI ⫽ 0.29–1.01). No dietary factor was associated with an increased disease risk. Milk intake was associated with a decreased disease risk (OR⫽ 0.45, 95% CI ⫽ 0.28–0.74).
Conclusion. The strong protective effect of parity was supported by this study, and the decline in parity is likely an important reason
for the rising incidence of ovarian cancer in Taiwan. A decreased disease risk was also seen with milk intake. In addition, the difference in the distribution of histologic subtypes in this population compared with high-incidence populations may point to further differences in risk factors.
© 2003 Elsevier Science (USA). All rights reserved.
Keywords: Ovarian cancer; Case– control study; Risk factors; Diet; Taiwan; Chinese
Introduction
Ovarian cancer is a highly lethal disease with an insidi-ous onset. The incidence of the disease varies widely inter-nationally, with the highest rates in industrialized Western nations and the lowest rate in developing countries and Japan [1]. With an incidence of fewer than 6 per 100,000
women, ovarian cancer is uncommon in Taiwan; however, it has the highest mortality rate among gynecologic cancers [2]. Several risk factors have been reported to be associated with epithelial ovarian cancer, the most common type of malignant ovarian tumor. The most well studied and con-sistent findings have been reproductive and hormonal fac-tors [1,3– 6]. Compared with nulliparous women, parous women have a lower risk of developing ovarian cancer, with a clear trend of decreasing risk with increasing number of live births [3– 6]. Use of oral contraceptives (OCs) is also known to decrease the risk of ovarian cancer [1,3,5].
In-* Corresponding author. Fax:⫹886-2-2341-8997. E-mail address: [email protected] (R.S. Lin).
R
Gynecologic Oncology 89 (2003) 318 –324 www.elsevier.com/locate/ygyno
0090-8258/03/$ – see front matter © 2003 Elsevier Science (USA). All rights reserved. doi:10.1016/S0090-8258(03)00088-X
creased risk is seen in women with a positive family history [1].
Given the fivefold international variation in disease in-cidence [1] and the increased inin-cidence among women who emigrate from Japan, a low-incidence country, to the United States, a high-incidence country [7,8], dietary factors have been suggested to play a key role in the etiology of the disease [9]. Fat consumption in low-incidence populations has been found to increase disease risk [10,11], but this may not be true for all fats and confounding factors exist [12– 14]. A more consistent finding is the protective effect of vegetables and fruits on disease risk [12–15]. Milk, lactose, and its component sugars have been shown to increase risk in some studies [14,16,17], but not others [17–19]. Regard-ing the association of other protein foods, fish has been found to decrease ovarian cancer risk [15,16,18], but the data are mixed on meat [6,11–16] and eggs [11,13–16].
Many epidemiologic studies have been conducted on ovarian cancer, the vast majority being on high-incidence populations in Europe, and North America. However, data on low-incidence populations such as Asians is sparse, with few recent reports [6,11,12,18,20,21]. Unlike in high-inci-dence populations where the ovarian cancer incihigh-inci-dence is stable [1] or actually decreasing [22], the incidence of the disease in low-incidence populations, including Taiwan, is on the rise [1,2,23,24]. To identify risk factors for ovarian cancer in a low-incidence population, we conducted a hos-pital-based, case– control study in Taiwan. Reproductive and dietary factors were surveyed in our investigation.
Materials and methods
A case– control study of primary epithelial ovarian can-cer was conducted between 1993 and 1998 in the Taipei metropolitan area (north Taiwan). The medical records of all incident cases of primary invasive epithelial ovarian cancer were reviewed to identify newly diagnosed cases, which were taken from hospital pathologic records. Patients with a history of major gynecologic operation including hysterectomy with or without oophorectomy as well as oophorectomy only were excluded. Cases comprised 90 patients (age range, 20 –75; median, 47) with newly diag-nosed and histologically confirmed cancer. A total of 86 cases (95.6%) with whom contact could be made and who were capable of completing the questionnaire were included in the study. Also, residence in Taiwan for more than 20 years was requisite. Because of the relatively short time from diagnosis to interview for cases (approximately 3– 4 months), less than 5% of eligible subjects had died; there-fore, no proxy interviews were conducted. The histologic subtypes of the 86 subjects were as follows: 35% serous carcinoma, 27% mucinous carcinoma, 21% endometrioid carcinoma, 15% clear cell carcinoma, 2% unspecified ade-nocarcinoma.
Controls were selected from patients who were
hospital-ized in the same hospitals at the same time for treatment of nonmalignant, nongynecologic conditions, unrelated to hor-monal or digestive tract diseases or to long-term modifica-tion of diet. Controls were subject to the same surgical exclusions as cases. Four controls were matched to each case by age (⫾ 5 years; age range, 20–75; median, 44), treatment hospital, and date of admission (⫾4 months). Among controls, 28% were hospitalized for trauma, 30% for nontraumatic orthopedic conditions, 19% for surgical conditions, and 23% for other miscellaneous conditions including medical, eye, nose, throat, and dental disorders. A total of 396 controls were identified and 369 (93.2%) pa-tients were interviewed. An investigator reviewed the med-ical records of potential control subjects before recruitment. Patients who were very ill were excluded from the inter-viewing process.
All interviews were conducted in hospital by trained interviewers. Informed consent was obtained from all par-ticipating subjects prior to the interview. The questionnaires covered sociodemographic characteristics, including age at diagnosis, ethnicity, education received, marital status, in-come, height, and weight. Levels of income were grouped into ranges as calculated by the National Executive Yuan of Taiwan [25]. Medical history and family history of disease were solicited. Data on each subject’s body weight and height 1 year before the diagnosis for cases and 1 year before the interview for controls were collected and con-verted into the body mass index (BMI: weight in kilograms divided by the square of the height in meters). Details of each woman’s reproductive and contraceptive histories were obtained. Dietary intake history during the 2 years prior to diagnosis or hospitalization (for controls) was elic-ited. The questionnaire covered the most frequently con-sumed food groups, including milk, soybean milk, meat, fish, eggs, fruits, and pickled vegetables. Food consumption was reported as weekly frequency.
Data analysis
We used frequency distributions first to review the dis-tributions of responses to the survey parameters. Because of the limited sample size, most potential risk factors were eventually divided into two to four levels for odds ratio (OR) calculation. The strength of association between ovar-ian cancer and each respective variable was measured in terms of the OR and the 95% confidence interval (CI) using the conditional multivariate logistic regression model, with adjustments for age, income during marriage, and educa-tion. In addition, adjustment for the number of live births was made on the analysis of age at first pregnancy, number of incomplete pregnancies, breastfeeding, OC use, and in-trauterine device (IUD) use. To calculate the association between diet and disease risk, the food items were classified according to common characteristics, resulting in categories such as pork, fish, chicken, beef, eggs, fruit, and pickled vegetables. Consumption was analyzed as weekly
fre-quency levels of 0, 1 or 2, 3–5, and daily consumption. However, due to the small study size, no difference was seen from such analysis (data not shown). Thus, dietary associations were finally analyzed using only yes/no fre-quency categories. Statistical calculations were performed using the SAS software package [26].
Results
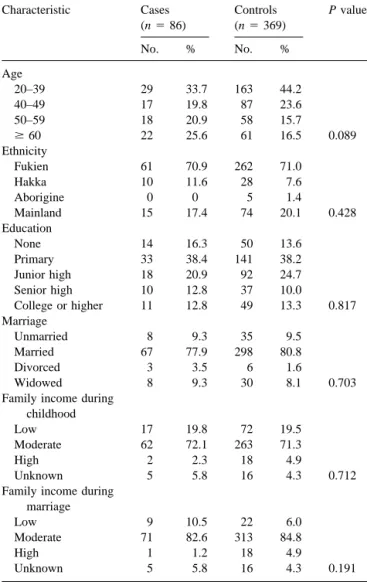
Table 1 summarizes the distribution of demographic and socioeconomic characteristics of the study groups. There were no significant differences between cases and controls. The grading distributions of cases and controls according to various reproductive factors are presented in Table 2. A strong inverse relationship was observed for each live birth and risk of ovarian cancer. Relative to the nullipara, the risk (OR) for ovarian cancer was 0.43 (95% CI⫽ 0.20–0.89), 0.30 (95% CI ⫽ 0.13–0.69), and 0.18 (95% CI ⫽ 0.05–
0.62) for women whose parity was 1 or 2, 3–5, and more than 5, respectively. Menopausal status was associated with an increased risk of disease (OR ⫽ 2.15, 95% CI ⫽ 1.21– 3.83). Breast-feeding for more than 1 year showed a trend toward protection (OR ⫽ 0.55, 95% CI ⫽ 0.29–1.01). No other reproductive or menstrual factors, including age at first pregnancy, number of incomplete pregnancies, ages at menarche and menopause, and regularity of periods, were significantly related to the occurrence of ovarian cancer. OC use was associated with a nonsignificant decreased risk (OR ⫽ 0.35, 95% CI ⫽ 0.08–1.54); however, the rate of ever use was low, only 2.3% for cases and 5.7% for controls. Use of an IUD was not associated with a significant change in risk. The association of ovarian cancer risk with various di-etary factors and BMI is presented in Table 3. In our study, only a small percentage of cases and controls smoked or drank alcohol or coffee, but about one-fourth of the subjects in each group drank tea. However, no dietary factors were significantly related to risk of developing ovarian cancer, except milk intake, which was associated with a decreased risk (OR ⫽ 0.45, 95% CI ⫽ 0.28–0.74). There was no association of BMI with disease risk.
Discussion
The results of this study support the most consistent finding in the literature: the protective effect of parity on disease risk even in a low-incidence population. Our results show a strong and significant trend of decreasing risk with each live birth. The degree of decreasing risk for each live birth is similar to that seen in other low-incidence studies [6,18,20,21], which is higher than reports from Europe and North America [1,3–5]. The fact that parity is an even stronger protective factor in low-incidence populations such as ours may also be an explanation for the rapidly increasing incidence of epithelial ovarian cancer in Taiwan. The dif-ference in fertility rates between developed and developing nations has been well documented for many years [27]. The higher average parity in developing nations is likely an important reason for the lower incidence of epithelial ovar-ian cancer in these populations. Since 1950, the average parity per woman of childbearing age in Taiwan has de-creased to a nadir of 1.7 in 1998 [28]. Simultaneously, the incidence of epithelial ovarian cancer has risen steadily from a low of 1.26 (per 100,000) in 1979 [29], the first year an official national cancer registry was established in Tai-wan, to a high of 5.44 (per 100,000) in 1998, a 4.5-fold increase. This trend of declining parity without a concom-itant increase in OC use— unlike in North American and European nations [22]—is, likely an important factor in the increasing incidence of ovarian cancer in Taiwan and other low-incidence populations [24].
The strong association of increasing parity with de-creased disease risk has led to the hypothesis of incessant ovulation as a cause of malignant transformation [30].
Fur-Table 1
Demographic and socioeconomic characteristics of cases and controls
Characteristic Cases (n⫽ 86) Controls (n⫽ 369) P valuea No. % No. % Age 20–39 29 33.7 163 44.2 40–49 17 19.8 87 23.6 50–59 18 20.9 58 15.7 ⱖ 60 22 25.6 61 16.5 0.089 Ethnicity Fukien 61 70.9 262 71.0 Hakka 10 11.6 28 7.6 Aborigine 0 0 5 1.4 Mainland 15 17.4 74 20.1 0.428 Education None 14 16.3 50 13.6 Primary 33 38.4 141 38.2 Junior high 18 20.9 92 24.7 Senior high 10 12.8 37 10.0 College or higher 11 12.8 49 13.3 0.817 Marriage Unmarried 8 9.3 35 9.5 Married 67 77.9 298 80.8 Divorced 3 3.5 6 1.6 Widowed 8 9.3 30 8.1 0.703
Family income during childhood
Low 17 19.8 72 19.5
Moderate 62 72.1 263 71.3
High 2 2.3 18 4.9
Unknown 5 5.8 16 4.3 0.712
Family income during marriage
Low 9 10.5 22 6.0
Moderate 71 82.6 313 84.8
High 1 1.2 18 4.9
Unknown 5 5.8 16 4.3 0.191
ther support for this theory is the decreased risk seen with breastfeeding and use of OCs [1,3,5], both of which sup-press ovulation. Our results show borderline significant pro-tection with breastfeeding for more than one year, a trend that likely would be significant with a larger study popula-tion. However, no reduction of risk with OC use was seen, probably due to the low prevalence of use in this population. Regarding other reproductive risk factors, menopausal status was associated with an increased risk of cancer. However, this positive relationship may not necessarily be a causal one. Rather, it may be that this association points to an earlier common factor that later affects both menopause and disease occurrence. Moreover, there was no relationship
between disease risk and age at menopause or age at men-arche. Studies to date show divergent results for these risk factors, and the current consensus is that these factors are likely weak predictors of ovarian cancer [1,31]. We also found no association of age at first pregnancy with disease risk, and its relationship to ovarian cancer is still unsettled [1,4,31]. Incomplete pregnancies have been found to have either a slight protective effect [1,3,18] or no association [5,20], as we did. Studies also have shown mixed results regarding menstrual cycle regularity [6,20,21,32], which we have found to have no effect on disease risk.
The inconsistent findings regarding ages at menarche and menopause and other reproductive factors put to question
Table 2
Comparison of reproductive risk factors between cases and controls (with adjustments for age, income during marriage, and education)
Characteristic Cases (n⫽ 86) Controls (n⫽ 369) Odds ratio
(95% confidence interval)
No. % No. %
Number of live births
0 16 18.6 48 13.0 1.00
1–2 28 32.6 144 39.0 0.43 (0.20–0.89)
3–5 35 40.7 147 39.8 0.30 (0.13–0.69)
⬎5 7 8.1 30 8.1 0.18 (0.05–0.62)
Age at first pregnancya
Nulligravida 14 16.3 43 11.7 1.00
⬍21 12 14.0 58 15.7 1.13 (0.16–7.92)
21–25 46 53.5 143 38.8 1.37 (0.22–8.69)
⬎25 14 16.3 125 33.9 1.22 (0.21–7.10)
No. of incomplete pregnanciesa
0 46 53.5 239 64.8 1.00 ⱖ1 40 46.5 130 35.2 1.42 (0.86–2.32) Age at menarche ⬍14 17 19.8 100 27.1 1.00 14–15 41 47.7 181 49.1 1.27 (0.69–2.37) 16–17 18 20.9 54 14.6 1.58 (0.74–3.39) ⬎17 4 4.7 23 6.2 0.73 (0.22–2.47) Unknown 6 7.0 11 3.0 2.10 (0.65–6.81) Menopause Yes 58 67.4 180 48.8 2.15 (1.21–3.83) No 18 20.9 120 32.5 1.00 Unsure or perimenopause 10 11.6 69 18.7 Age at menopauseb ⬍45 18/58 31.0 38/180 21.1 1.00 45–50 24/58 41.4 90/180 50.0 0.56 (0.27–1.15) ⬎50 16/58 27.6 52/180 28.9 0.65 (0.29–1.44) Breastfeeding (years)a 0 41 47.7 176 47.7 1.00 ⱕ1 8 9.3 42 11.4 0.82 (0.35–1.94) ⬎1 37 43.0 151 40.9 0.55 (0.29–1.01) Regularity of periods Very regular 64 74.4 287 77.8 1.00 Sometimes irregular 18 20.9 72 19.5 1.14 (0.64–2.06) Often irregular 4 4.7 10 2.7 1.12 (0.32–3.88)
Ever used oral contraceptiona
No 84 97.7 348 94.3 1.00
Yes 2 2.3 21 5.7 0.35 (0.08–1.54)
Ever used intrauterine devicea
No 63 73.3 302 81.7 1.00
Yes 23 26.7 67 18.3 1.65 (0.95–2.84)
aAdjusted for number of live births.
the etiologic theory of incessant ovulation. Moreover, the actual reduction in risk conferred by each pregnancy is statistically much higher than the calculated risk reduction from that duration of ovulation suppression. In addition, the protection from each live birth is not equivalent to a similar duration of ovulation suppression with OC use [32]. Alter-native theories have been proposed, the most important of which is that of excessive gonadotropin stimulation leading to malignant transformation [33]. This theory accommo-dates the effects of parity and OC on disease risk; however, the decreased risk seen with breastfeeding would not fit in. So far, both theories can accommodate only some but not all the epidemiologic data, strongly suggesting ovarian cancer
to be a multifactorial disease. In addition, familial-type ovarian cancer appears to behave biologically differently than non-familial-type cases, further implicating multiple etiologies for the disease [34].
Dietary risk factors for ovarian cancer have been even less consistent than reproductive risk factors. Increased con-sumption of fat has been cited as a possible cause of the increased incidence of ovarian cancer in immigrants from Asian to Western nations [7,8,10,12,24]. Economic devel-opment in the last three decades has been dramatic in Pacific Asian nations, including Taiwan. The per capita daily intake of energy from fat in Taiwan has doubled from 63.5 g in 1970 to 133.1 g in 1990 [35]. Animal meat is a high source
Table 3
Comparison of dietary risk factors between cases and controls (with adjustments for age, income during marriage, and education)
Characteristic Cases (n⫽ 86) Controls (n⫽ 369) Odds ratio
(95% confidence interval) No. % No. % Smoking Yes 5 4.4 23 6.2 1.05 (0.38–2.91) No 81 94.2 346 93.8 1.00 Alcohol Yes 3 3.5 17 4.6 0.71 (0.20–2.51) No 83 96.5 352 95.4 1.00 Coffee Yes 9 10.5 56 15.2 0.73 (0.34–1.56) No 77 89.5 313 84.8 1.00 Tea Yes 25 29.1 125 33.9 0.79 (0.47–1.32) No 61 70.9 244 66.1 1.00 Milk Yes 38 55.8 139 37.7 0.45 (0.28–0.74) No 48 44.2 230 62.3 1.00 Soybean milk Yes 26 30.2 116 31.4 1.12 (0.65–1.90) No 60 69.8 253 68.6 1.00 Pork⬎ 1/week Yes 77 89.5 315 85.4 1.40 (0.65–3.00) No 9 10.5 54 14.6 1.00 Fish⬎ 1/week Yes 55 64.0 246 66.7 0.94 (0.57–1.56) No 31 36.0 123 33.3 1.00 Chicken⬎ 1/week Yes 75 87.2 330 89.4 0.77 (0.37–1.61) No 11 12.8 39 10.6 1.00 Beef⬎ 1/week Yes 18 20.9 73 19.8 0.81 (0.45–1.47) No 68 79.1 296 80.2 1.00 Eggs⬎ 1/week Yes 61 70.9 242 65.6 1.14 (0.67–1.92) No 25 20.1 127 34.4 1.00 Fruit 1–7 week Yes 57 66.3 232 62.9 0.80 (0.48–1.32) No 29 33.7 137 37.1 1.00
Pickled vegetable⬎ 1/week
Yes 75 87.2 323 87.5 1.08 (0.53–2.20)
No 11 12.8 46 12.5 1.00
BMIa1 year before diagnosis
⬍25 63 73.3 261 70.7 0.77 (0.45–1.33)
ⱖ25 23 26.7 108 29.3 1.00
of fat; however, we did not find an increased risk with any type of meat intake. In fact, a study from Japan [6] and a prospective study of diet and ovarian cancer [14] also found no association between risk of disease and either animal meat or fat intake, respectively. Thus, the relationship of fat intake and ovarian cancer remains unresolved.
Although milk and its component sugars have been hy-pothesized to increase ovarian cancer risk [16], our data as well as studies from Japan [18] show a reduced risk with milk intake. More recent studies out of Italy and the United States, respectively, also did not find any association of milk with disease risk [15,17,19]. Soybean milk, a staple break-fast food unique to the Chinese population, was not found to have an association with disease risk in this study.
The most consistent finding of diet in the literature has been the protective effect of fruit and vegetable intake [8,9,12,14,15]. Our results show a nonsignificant decreased disease risk with fruit intake. However, we did not find any association of disease risk with pickled vegetable intake. The protective effect of vegetables on cancer risk has been hypothesized to be due to antioxidants, vitamins, and other micronutrients [36]. Processing of vegetables may decrease these protective micronutrients. Indeed, in another case– control study, pickled vegetable intake was associated with increased disease risk [11].
The wide range of results from this and other studies on dietary factors suggests caution in interpretation of any analysis, and more evidence is needed before definitive associations with disease risk can be made.
In recent years, an increasing number of studies have shown that epithelial ovarian cancer is not a homogenous entity, and different histologic subtypes may have different etiologies [37]. The histologic subtypes of the cases in this study are markedly different than what has been reported in Caucasian populations [1,31], especially the high incidences of endometrioid and clear-cell subtypes in our population. The breakdown of subtypes in our study is reflective of Taiwan in general, as seen from national tumor registry data over the years [2,29]. Although the case numbers are too small in this study for analysis of risk factor by histologic subtypes, this difference may be another reason for the disparity in incidence rates between this and Caucasian populations.
Certain limitations of this study must be considered. Our study involves a small sample and has a limited power of test, a common drawback of single studies in low-incidence countries. This study also has several limitations of hospi-tal-based case– control studies [38]. Selection bias is possi-ble; however, the enrollment of cases and controls in major teaching and general hospitals of the areas under study and their almost complete participation make the bias less likely. The questionnaire was administered to cases and controls by the same interviewers under similar conditions, thus minimizing any information bias. Very ill individuals were excluded to minimize any recall bias due to severity of the patient’s illness, particularly for those with
advanced-stage disease. To minimize recall bias on dietary intake, we asked about food intake in the 2 years prior to diagnosis. We were unable to measure the risk association with total intake of nutrients, since only general food groups were surveyed rather than nutrient intake quantity.
In conclusion, the findings in our study support the pro-tective effect of parity on risk of epithelial ovarian cancer, and the rise in incidence in recent years correlates with a continuing decline in parity in Taiwan. Menopausal status was associated with increased disease risk, whereas breast-feeding for more than 1 year showed a trend toward pro-tection. Regarding dietary factors, our finding of a protec-tive effect of milk is consistent with recent studies from other low-incidence populations. A marked difference in histologic subtypes between this and high-risk populations may further contribute to the incidence disparity. This study adds further data to a short list of such studies in populations of low ovarian cancer incidence.
Acknowledgment
This study was supported by a grant from the National Science Council in Taiwan.
References
[1] Parazzini F, Franceschi S, La Vecchia C, Fasoli M. Review: the epidemiology of ovarian cancer. Gynecol Oncol 1990;43:9 –23. [2] Cancer registry 1998 annual report. Department of Health, Executive
Yuan, Taiwan, ROC; 2001, pp 88 –9.
[3] Whittemore AS, Harris R, Itnyre J, & the Collaborative Ovarian Cancer Group. Characteristics relating to ovarian cancer risk: collab-orative analysis of 12 US case– control studies. II. Invasive epithelial ovarian cancers in white women. Am J Epidemiol 1992;136:1184 – 203.
[4] Adami HO, Hsieh CC, Lambe M, Trichopoulos D, Leon D, Persson I. Parity, age at first childbirth, and risk of ovarian cancer. Lancet 1994;344:1250 – 4.
[5] Salazar-Martinez E, Lazcano-Ponce EC, Gonzalez Lira-Lira G, Es-cudero-De los Rios P, Salmeron-Castro J, Hernandez-Avila M. Re-productive factors of ovarian and endometrial cancer risk in a high fertility population in Mexico. Cancer Res 1999;59:3658 – 62. [6] Mori M, Nishida T, Sugiyama T, Komai K, Yakushiji M, Fukuda K,
et al. Anthropometric and other risk factors for ovarian cancer in a case– control study. Jpn J Cancer Res 1998;89:246 –53.
[7] Herrinton LJ, Stanford JL, Schwarz SM, Weiss NS. Ovarian cancer incidence among Asian migrants to the United States and their de-scendants. J Natl Cancer Inst 1994;86:1336 –9.
[8] Dunn JE. Cancer epidemiology in populations of the United States with emphasis on Hawaii and California and Japan. Cancer Res 1975;35:3240 –5.
[9] World Cancer Research Fund in Association with the American Institute for Cancer Research. Food, nutrition, and the prevention of cancer, a global perspective. Washington, DC: World Cancer Re-search Fund, 1997.
[10] Kato I, Tominaga S, Kuroishi T. Relationship between westernization of dietary habits and mortality from breast and ovarian cancers in Japan. Jpn J Cancer Res 1987;78:349 –57.
[11] Zhang M, Yang ZY, Binns CW, Lee AH. Diet and ovarian cancer risk: a case– control study in China. Br J Cancer 2002;86:712–7.
[12] Shu XO, Gao YT, Yuan JM, Ziegler RG, Brinton LA. Dietary factors and epithelial ovarian cancer. Br J Cancer 1989;59:92– 6.
[13] Risch HA, Jain M, Marett LD, Howe GR. Dietary fat intake and risk of epithelial ovarian cancer. J Natl Cancer Inst 1994;86:1409 –15. [14] Kushi LH, Mink PJ, Folsom AR, Anderson KE, Zheng W, Lazovich
D, Sellers TA. Prospective study of diet and ovarian cancer. Am J Epidemiol 1999;149:21–31.
[15] Bosetti C, Negri E, Franceschi S, Pelucchi C, Talamini R, Montella M, et al. Diet and ovarian cancer risk: a case– control study in Italy. Int J Cancer 2001;93:911–5.
[16] Cramer DW, Harlow BL, Willett WC, Welch WR, Bell DA, Scully RE, et al. Galactose consumption and metabolism in relation to the risk of ovarian cancer. Lancet 1989;2:66 –71.
[17] Cramer DW, Greenberg ER, Titus-Ernstoff L, Liberman RF, Welch WR, Li E, Ng WG. A case– control study of galactose consumption and metabolism in relation to ovarian cancer. Cancer Epidemiol Biomarkers Prev 2000;9:95–101.
[18] Mori M, Harabuchi I, Miyake H, Casagrande JT, Henderson BE, Ross RK. Reproductive, genetic, and dietary risk factors for ovarian can-cer. Am J Epidemiol 1988;128:771–7.
[19] Goodman MT, Wu AH, Tung KH, McDuffie K, Cramer DW, Wilk-ens LR, et al. Association of galactose-1-phosphate uridyltransferase activity and N314D genotype with the risk of ovarian cancer. Am J Epidemiol 2002;156:693–701.
[20] Shu XO, Brinton LA, Gao YT, Yuan JM. Population-based case– control study of ovarian cancer in Shanghai. Cancer Res 1989;49: 3670 – 4.
[21] Chen Y, Wu PC, Lang JH, Ge WJ, Hartge P, Brinton LA. Risk factor for epithelial ovarian cancer in Beijing, China. Int J Epidemiol 1992; 21:23–9.
[22] Gnagy S, Ming EE, Devesa SS, Hartge P, Whittemore AS. Declining ovarian cancer rates in U.S. women in relation to parity and oral contraceptive use. Epidemiol 2000;11:102–5.
[23] Cancer registry 1996 annual report. Department of Health, Executive Yuan, Taiwan, ROC, 1999, pp. 87– 8.
[24] Tamakoshi K, Kondo T, Yatsuya H, Hori Y, Kikkawa F, Toyoshima H. Trends in the mortality (1950 –1997) and incidence (1975–1993) of malignant ovarian neoplasm among Japanese women: analyses by age, time and birth cohort. Gynecol Oncol 2001;83:64 –71(doi: 10.1006/gyno.2001.6335).
[25] Statistical Abstract of National Income in Taiwan area, 1993–1998. Directorate General of Budget Accounting and Statistics Executive Yuan, Taipei, Taiwan, ROC.
[26] SAS Institute, Inc. SAS user’s guide: Statistics. Version 8.1.e. Cary, NC: SAS Institute, Inc., 2000.
[27] 2001 World Population Data Sheet, Population Reference Bureau; 2002. (http://www.prb.org/Content/NavigationMenu/Other_reports/ 2000-2002/sheet2.html).
[28] Department of Statistics, Ministry of the Interior. An analysis of birth rate and the fertility rate of women at childbearing ages, Taiwan, 2001 (http://www.moi.gov.tw/w3/stat/english/etopic/topic906.htm). [29] Cancer registry 1979 annual report. Department of Health, Executive
Yuan, Taiwan, ROC; 1982, pp. 67– 8.
[30] Fathalla MF. Incessant ovulation: a factor in ovarian neoplasia? Lancet 1971;2:163.
[31] Riman T, Persson I, Nilsson S. Hormonal aspects of epithelial ovarian cancer: review of epidemiological evidence. Clin Endocrinol 1998; 49:695–707.
[32] Risch HA. Hormonal etiology of epithelial ovarian cancer, with a hypothesis concerning the role of androgens and progesterone. J Natl Cancer Inst 1998;90:1774 – 86.
[33] Cramer DW, Welch WR. Determinants of ovarian cancer risk. II. Inferences regarding pathogenesis. J Natl Cancer Inst 1983;71:717– 21.
[34] Kasprzak L, Foulkes WD, Shelling AN. Fortnightly review: heredi-tary ovarian carcinoma. Br Med J 1999;318:786 –9.
[35] Council for Economic Planning and Development. Taiwan statistical data book, 1992. Taipei: Council for Economic Planning and Devel-opment, 1992. p. 279.
[36] Potter JD, Steinmetz K. Vegetables, fruit and phytoestrogens as preventive agents. In: Stewart BW, McGregor D, Kleiheus O, editors. Principles of chemoprevention. Lyon: IARC Scientific Publications, 1996. pp. 277– 87.
[37] Risch HA, Marrett LD, Jain M, Howe JR. Differences in risk factors for epithelial ovarian cancer by histologic type: results of a case– control study. Am J Epidemiol 1996;144:363–72.
[38] Breslow NE, Day NE. Statistical methods in cancer research, Vol. 1: The analysis of case– control studies. Lyon: IARC Scientific Publi-cation, 1980.