This article was downloaded by: [National Chiao Tung University 國立交通大學] On: 28 April 2014, At: 01:41
Publisher: Taylor & Francis
Informa Ltd Registered in England and Wales Registered Number: 1072954 Registered office: Mortimer House, 37-41 Mortimer Street, London W1T 3JH, UK
Aerosol Science and Technology
Publication details, including instructions for authors and subscription information:http://www.tandfonline.com/loi/uast20
Field Study of the Accuracy of Two
Respirable Sampling Cyclones
Chuen-Jinn Tsai , Horng-Guang Shiau & Tung-Sheng Shih Published online: 30 Nov 2010.
To cite this article: Chuen-Jinn Tsai , Horng-Guang Shiau & Tung-Sheng Shih (1999) Field Study of the Accuracy of Two Respirable Sampling Cyclones, Aerosol Science and Technology, 31:6, 463-472, DOI: 10.1080/027868299304011
To link to this article: http://dx.doi.org/10.1080/027868299304011
PLEASE SCROLL DOWN FOR ARTICLE
Taylor & Francis makes every effort to ensure the accuracy of all the information (the “Content”) contained in the publications on our platform. However, Taylor & Francis, our agents, and our licensors make no representations or warranties whatsoever as to the accuracy, completeness, or suitability for any purpose of the Content. Any opinions and views expressed in this publication are the opinions and views of the authors, and are not the views of or endorsed by Taylor & Francis. The accuracy of the Content should not be relied upon and should be independently verified with primary sources of information. Taylor and Francis shall not be liable for any losses, actions, claims, proceedings, demands, costs, expenses, damages, and other liabilities whatsoever or howsoever caused arising directly or indirectly in connection with, in relation to or arising out of the use of the Content.
This article may be used for research, teaching, and private study purposes. Any substantial or systematic reproduction, redistribution, reselling, loan, sub-licensing, systematic supply, or distribution in any form to anyone is expressly
s .
Aerosol Science and Technology 31:463] 472 1999
Q1999 American Association for Aerosol Rese arch
Published by Taylor and Francis
0278-6826r99r$12.00 q.00
Field Study of the Accuracy of Two
Respirable Sampling Cyclones
Chuen-Jinn Tsai*, Horng-Guang Shiau, and Tung-Sheng Shih
INSTITUTE OF ENVIRONMENTAL ENGINEERING, CHIAO TUNG UNIV ERSITY,
s .
HSIN CHU, TAIWAN, R.O.C. C.-J.T., H.-G.S.
INSTITUTE OF OCCUPATIONAL SAFETY AND HEALTH, CO UNCIL OF LABOR
s .
AFFAIRS, TAIPEI, TAIWAN, R.O.C. T.-S.S.
( ABSTRACT. This study is to evaluate the sampling bias of a new cyclone Tsai et
)
al. 1999 and a 10 mm nylon cyclone under ® eld sampling conditions. Both cyclones were operated at the optimum ¯ ow rate of 1.7 Lrrrrrmin. The Marple personal cascade impactor was used to measure the particle size distributions,
( )
wh ich were used to calculate the reference RPM Respirable Particulate Matter concentrations according to the new ACGIH criteria.
A wind tunnel was used in the ® eld to ensure uniform particle concentration and wind speed across the tested cyclones an d impactors in the working section. The wind speed, which was varied from 0.8 to 2.3 m rrrrrs, was kept constant in the wind
(
tunnel. Near the packaging area of a glazing-making factory mass median )
aerodyn amic diameter, or MMAD: 11.1 m m , the average ratio of the RPM concentrations measured by the cyclones to the standard RPM concentrations was found to be 1.20 and 1.10 for the 10 mm nylon and the new cyclone, respectively.
( )
Near the packaging area of a lead powder factory MMAD: 4.82 m m , the average ratio of the RPM measured by the cyclones to the reference RPM was found to be 1.13 an d 1.02 for the 10 mm nylon and the new cyclone, respectively. Wind speed an d total airborne particle concentration were found to have little effect on the accuracy of the two respirable cyclones. This ® eld study showed that the new cyclone is more accurate th an the 10 mm nylon cyclone based on the reference RPM.
INTRODUCTION
The 10 mm nylon cyclone is widely used as a respirable dust sampler in the United States. Most of previous studies on the penetration of the 10 mm nylon cyclone were done under laboratory conditions in
*Corresponding author.
which the particle mass concentration was low and the particle electrostatic charge
s
was neutralized Ettinger et al. 1970; Seltzer et al. 1971; Caplan et al. 1977a, 1977b; Tsai
.
and Shih 1995 . In ® eld sampling condi-tions, the sampling accuracy of the 10 mm nylon cyclone can be in¯ uenced by the par-ticle mass concentration, parpar-ticle electro-static charge, wind speed and direction.
A new cyclone was designed and tested to reduce the effect of deposited particles and particle electrostatic on particle
pene-s .
tration Tsai et al. 1999 . The inner diame-ter of the new cyclone, 18 mm, is 1.8 times that of the 10 mm nylon cyclone and made of conductive aluminum. Tested at 1.7
s .
L
r
min in the laboratory, Tsai et al. 1999 found that the particle penetration of the new cyclone matches well with the news .
ACGIH 1993 criteria for respirable dust sampling and particle electrostatic charge has little effect on particle penetration. Compared to the 10 mm nylon cyclone, variation of cutoff aerodynamic diameter caused by the deposited particles is greatly reduced for the new cyclone.
While the performance of the new cy-clone seems to be better than that of the 10 mm nylon cyclone under laboratory condi-tions, it is important to conduct the test in ® eld conditions. Also, whether or not the operating ¯ ow rate for the new cyclone, 1.7 L
r
min, is the optimum ¯ ow rate remains to be determined.In a study conducted under ® eld
condi-s .
tions, Groves et al. 1994 used the 10 mm nylon, SKC and BGI cyclones to me asure the RPM concentrations and compared to those calculated based on the size distribu-tions me asured using Marple personal
cas-s
cade impactors or standard RPM
concen-. s .
trations Rubow et al. 1987 . Based on the standard RPM concentrations, the accuracy of the me asured RPM concentrations by cyclones were found to be affected by the level of measured cyclone RPM concentra-tions. The ratio of RPM concentrations me asured with cyclones to the standard RPM concentrations increased with cy-clone sampled RPM concentrations and was close to unity at 2 mg
r
m3.In the previous study, airborne particle concentration seemed to be an important
s
factor in this study. The effect of wind
speed and direction on the me asured RPM .
concentrations was not examined .
In this study, the 8-stage Marple per-sonal impactors were used to measure the size distributions in a glazing-makin g fac-tory and a lead powder facfac-tory. Particles in both factories are solid. The reference RPM concentrations were calculated based on the new ACGIH criteria. The reference RPM concentrations were used as a basis to determine the sampling accuracy of the two cyclones, which were operated simul-tane ously with the Marple personal impactors in a wind tunnel. In order to investigate the effect of wind speed on the sampling accuracy of the cyclones, aerosol sampling by the cyclones and Marple per-sonal impactors with inlet visor were con-ducted in the wind tunnel where the wind speed was adjuste d from 0.8 to 2.3 m
r
s. The wind speed is less than the inlet veloc-ity of the two cyclones, which is approxi-mate ly 6 mr
s. The samplers were oriented so that the openings were facing toward the wind.The cutoff aerodynami c diameter of each stage, the inlet sampling ef® ciency, the par-ticle rebounce problem on coated stage, and particle inner loss for the Marple per-sonal impactor were tested using
monodis-s
perse particles in the laboratory Rubow et .
al. 1987 . The overall sampling effective-ness of the impactor, which was de® ned as the product of the inlet sampling ef® ciency
s .
and 1.0} the internal particle loss , was determined under calm wind conditions. The effectiveness was shown to be greater than 90% for particles than 7.0 m m in aerodynamic diameter, and was 84% for 10
m m particles in aerodynami c diameter for the impactor, with or without the inlet vi-sor. Although not determined under dif-ferent wind speeds, it is believed that the sampling effectiveness of the impactor should be similar to that under calm wind
Accuracy of Respirable Cyclones 31:6 December 1999
Aerosol Science and Technology 465
conditions because the inlet visor shields off the wind effectively.
Following the work of Tsai and Cheng s1995 , deposit particle mass was consid-. ered to be an important factor for the penetration of the Marple personal im-pactor and was ® rst examined in the labo-ratory.
The optimum ¯ ow rate of the new cy-clone was then determined in the labora-tory using the method of Bartley and Breuer s1982 . The ¯ ow rate was then used to. operate the new cyclone for determining its sampling accuracy under the ® eld condi-tions, while the operating ¯ ow rate for the 10 mm nylon cyclone was set at 1.7 L
r
min sBartley et al. 1994 ..EXPERIMENTAL
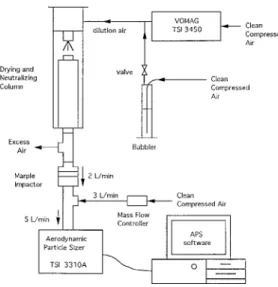
The experimental setup used to evaluate the effect of deposited particle mass of the Marple impactor on the particle penetra-tion is shown in Figure 1. When calculating the reference RPM concentrations, such deposited particle mass effect was taken
FIGURE 1. Schem atic of the experiment setup to ob-tain the penetration curves for the Marple impactor.
into account. Monodisperse solid ammo-nium ¯ uorescein particles and liquid oleic acid particles were generated by a Vibrat-ing Ori® ce Monodisperse Aerosol
Genera-s
tor VOMAG, TSI Model 3450, TSI Inc., .
St. Paul, MN, USA and passed through a drying and neutralizing column. Each stage of the Marple personal impactor was tested.
s
An Aerodynamic Particle Sizer APS, TSI .
Model 3310A was used to me asure the upstream and down stream particle size and concentrations and to determine parti-cle penetration.
The ¯ ow rate of Marple impactor was set at 2.0 L
r
min. The inlet particleconcentra-s .
tion N of the Marple impactor was mea-1
sured before and after experiment to as-sure the stability of concentration. The
out-s .
let particle concentration N2 was mea-sured and recorded every 20 seconds by the APS continuously. The collection ef® ciency
h of the Marple impactor at any sampling time was calculated as
N2
s . s .
h % s 1 y = 100% . 1
N1
After n time intervals, particle mass de-posited on the stage of the Marple im-pactor, m, was calculated as
n p
3s .
ms
p
6 r p? D N y Np 1 2,i = Q = t ,iis 1
s .2
where r p is the particle density; D is thep particle diameter; Q is the ¯ ow rate of the Marple impactor; t is the duration of eachi sampling interval i. Monodisperse particles of a certain particle size were used to de-posit on the impactor stages to investigate the effect of deposited particle mass on the collection ef® ciency of that particular size.
s .
In Equation 2 , the overall sampling ef-® ciency of solid particles by the APS is assumed to be 100% . Although the overall sampling ef® ciency is shown to be low for
s .
large liquid particles Kinney and Pui 1995 ,
it is considerably higher for solid particles sBlackford et al. 1988 . However, there have. been no accurate data for overall sampling ef® ciency of solid particles in the literature. Once the data become available, the parti-cle mass loading can be corrected.
The penetration of a small sampling cy-clone was found not only depends on the
s .
Stoke number Stk but also on the
de-s .
posited particle mass Tsai et al. 1999 . In this study, monodisperse particles of a cer-tain particle size were used to deposit on the impactor stages to investigate the effect of deposited particle mass on the collection ef® ciency of that particular size.
The S is de® ned astk
r D2Cu
p p i s .
Stks , 3
18m D
where C is the slip correction factor of the particle, u is the inlet velocity of the cy-i clone, m is the viscosity of air and D is the inner diameter of the cyclone.
To optimize the ¯ ow rate of the new cyclone under different deposited particle mass conditions, particle penetration of the new cyclone at different ¯ ow rates and different deposited particle masses must be found. At each ¯ ow rate, monodisperse particles of 6.7m m in aerodynamic diame-ter were ® rst used to deposit particles of 0, 0.3, 0.6, and 3 mg in the cyclones, then the experimental penetration curves were me
a-s .
sured Tsai et al. 1999 . The original experi-s . mental data for particle penetration, P % ,
s
at 1.7 L
r
min for the new cyclone Tsai et .al. 1999 are ® tted for four different de-posited particle masses: 0, 0.3, 0.6, and 3 mg, base d on Stk as 1 s . s . P % s 1 y a a 2 x100, 4 1
u
1 qt /
0
SX
tkwhere the ® tting parameter a 1s 0.138, 0.132, 0.127, and 0.126; a 2s 6.19, 5.3, 5.47,
5.44 for the deposited particle mass of 0, 0.3, 0.6, and 3.0 mg, respectively. Based on the above equation, the particle penetra-tion curve at a ¯ ow rate different from 1.7 L
r
min can be predicted for different de-posited particle masses.Experimental particle penetration curves of the new cyclone at the ¯ ow rate of 1.5, 1.9, and 2.1 L
r
min were also determined in the laboratory using the experimental setups .
described in Tsai et al. 1999 . After the particle penetration curves at different ¯ ow s .
X
rates are obtained, sampling bias f Q at the ¯ ow rate Q for the new cyclone can
s .
be calculated, where f Q is expressed as sBartley and Breuer 1982 :.
` 2 s . s . s . f Q s
H
w Dp a P D , Qc p a 0 2 s . s . y P D , QR p a dD ,p a 5 s . s .where P D , Q and P D , Q are thec p a R p a penetration of the new cyclone and the new ACGIH criteria, respectively, at the ¯ ow rate Q and particle aerodynami c diameter
s .
D . The weighting function w Dp a p a is a
normalized lognormal distribution function with two parameters, MMAD and GSD. The optimum ¯ ow rate is determined as the ¯ ow rate at which the sampling bias is the minimum.
The optimum ¯ ow rate determined for the new cyclone was then use to operate the new cyclone for determining its accu-racy in ® eld sampling, while the ¯ ow rate for the 10 mm nylon cyclone was set at 1.7 L
r
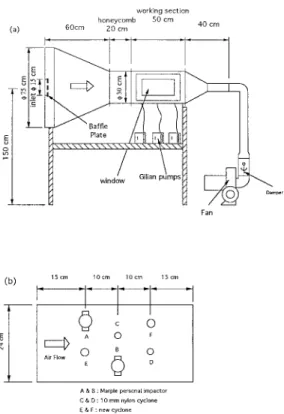
min based on the work of Bartley et al. s1994 ..A wind tunnel with the inner diameter of 30 cm in the working section was used to test the sampling accuracy of the 10 mm nylon cyclone and the new cyclone at dif-ferent wind speeds. The wind tunnel is
s .
shown in Figure 2 a . A fan with a ¯ ow-control damper drawed aerosols in the workplace through a contraction, a buf¯ e plate, a honeycomb, and a working section.
Accuracy of Respirable Cyclones 31:6 December 1999
Aerosol Science and Technology 467
FIGURE 2. Schem atic of the experiment setup for
( ) ( )
® eld sampling a wind tunnel b arrangement of samplers on working platform.
Two Marple impactors, two 10 mm nylon cyclones, and two new cyclones were collo-cated in three rows in a platform in the s . working section as shown in Figure 2 b . The height of the platform was adjusted such that the openings of the samplers were located approximately at the center of the wind tunnel. All openings of the samplers were facing toward the wind. To avoid in-terference of the samplers, the adjacent rows of the samplers were arranged in a staggered manner.
The uniformity of dust concentration in the working section was me asured by gravi-metric analysis using 37 mm cassettes in-stalled at the corresponding locations of the samplers. The variation of
concentra-tion was found to be within 5% at different wind speeds. Each sampler was driven by a Gilian pump. PE ® lters coated with silicon oil were used as substrates for the Marple impactor. The after ® lter of the Marple impactor was a PVC ® lter, which was also used for the ® lter cassettes of the 10 mm nylon cyclones and the new cyclones.
A glazing-makin g and a lead powder fac-tory were chosen for the ® eld test. During the test, temperature and humidity ranged from 19" 58 C and 76 " 8% , respectively. The tests were conducted ne ar the packag-ing areas of both factories. Each samplpackag-ing continued for 4] 5 hours to collect enough particles for weighing. At each sampling location, four runs were conducted for each wind speed, which was kept constant at 0.8, 1.3, 1.8, or 2.3 m
r
s in the working section during the test runs. In total, there were 16 runs at each sampling location.The reference RPM concentration was calculated from the particle size distribu-tion measured by the Marple impactor ap-plying the new ACGIH criteria for res-pirable sampling. Size distribution data were ® rst corrected for the deposited particle mass effect determined in this study, and the inlet ef® ciency and inter-stage particle loss according to the data reported in
s .
Rubow et al. 1987 . The TSI DISFIT pro-gram was then used to ® t the data in order to calculate the reference RPM concentra-tions. The RPM concentrations me asured by the 10 mm nylon cyclone and the new cyclone were then compared with the refer-ence RPM concentrations.
RESULTS AND DISCUSSIONS
Effect of Deposi ted Particle Mass on Particle Penetration for the Marple Impactor
The penetration ef® ciency data obtaine d in this study were found to be slightly
differ-s .
ent from those of Rubow et al. 1987 for
( )
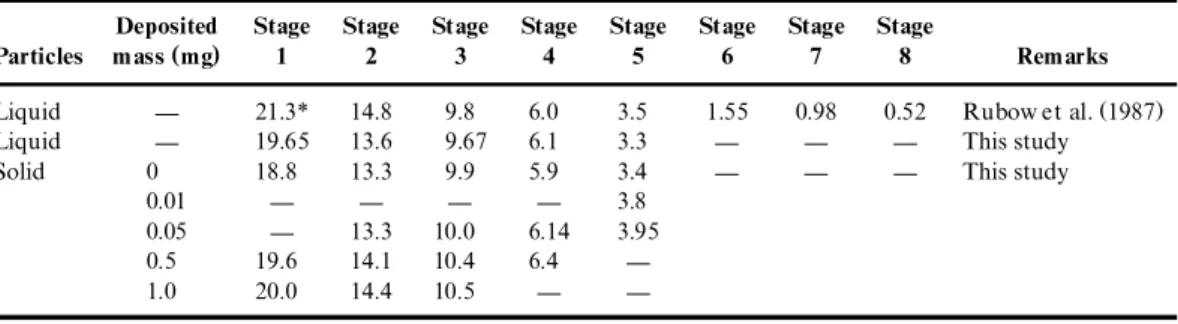
TABLE 1. Comparison of cutoff aerodyn amic diameter* m m at different deposited particle masses for the Marple Person al Impactor
Deposited Stage Stage Stage Stage Stage Stage Stage Stage ( )
Particles m ass mg 1 2 3 4 5 6 7 8 Rem arks
s .
Liquid } 21.3* 14.8 9.8 6.0 3.5 1.55 0.98 0.52 Rubow et al. 1987
Liquid } 19.65 13.6 9.67 6.1 3.3 } } } This study
Solid 0 18.8 13.3 9.9 5.9 3.4 } } } This study
0.01 } } } } 3.8
0.05 } 13.3 10.0 6.14 3.95
0.5 19.6 14.1 10.4 6.4 }
1.0 20.0 14.4 10.5 } }
stage 1] 5 of the Marple impactor. In this study, the cutoff aerodynami c diameter was found to be 19.65, 13.6, 9.67, 6.1, and 3.37
m m for the stage 1] 5, respectively. Com-pared to the cutoff aerodynamic diameters
s .
reported in Rubow et al. 1987 , the dif-ference isy 7.7% , y 8.1% , y 1.3% , q1.7% , and y 3.7% for stage 1] 5, respectively, as shown in Table 1. For liquid particles, the amount of deposited particle mass was found to have no effects on the particle penetration of the Marple impactor.
For solid particles, the penetration curves of different deposited particle masses were obtained in this study. It was found that as deposited particle mass increased, the par-ticle penetration decreased. For example , for Stage 1 the cutoff aerodynami c diame-ter is 18.8, 19.6, and 20.2 m m when the
s
deposited particle mass is 0 mg clean im-.
paction surface , 0.5 mg and 1 mg, respec-tively. For Stage 2, the cutoff aerodynamic diameter is 13.3, 13.3, 14.1, and 14.4 m m when the deposited particle mass is 0 mg, 0.05 mg, 0.5 mg, and 1 mg, respectively. The shift in penetration curves and cutoff aero-dynamic diameter with deposited particle mass was taken into account when calculat-ing the reference RPM concentrations based on the measured size distributions by the Marple impactors.
Optimization of the Flow Rate for the New Cyclone
The predicted and experimental penetra-tion curves in the new cyclone at different ¯ ow rates were obtaine d for different de-posited particle masses. Only the cases for the deposited mass of 0 and 3 mg are
s . s .
shown in Figure 3 a and b , respectively. The ® gures indicate that the agreement between the theoretical predictions and ex-perimental data is quite satisfactory. When the deposited particle mass is 0 mg, that is the inner wall of the cyclone is clean, the theoretical cutoff aerodynamic diameters are 4.54, 4.29, 4.04, and 3.84m m at the ¯ ow rate of 1.5, 1.7, 1.9, and 2.1 L
r
min, respec-tively. These cutoff diameters are very close to the experimental data of 4.67, 4.29, 4.16, and 3.74m m at the ¯ ow rate of 1.5, 1.7, 1.9, and 2.1 Lr
min, respectively. Difference be-tween the theoretical predictions and ex-perimental data is less than 3.0% for all the ¯ ow rate s.Similarly, when the deposited mass is 3 mg for the new cyclone, the theoretical cutoff aerodynamic diameters are 4.15, 3.89, 3.68, 3.50 m m for the ¯ ow rate of 1.5, 1.7, 1.9, and 2.1 L
r
min, respectively, which also are very close to the experimental data of 4.28, 3.91, 3.66, and 3.44 m m at theAccuracy of Respirable Cyclones 31:6 December 1999
Aerosol Science and Technology 469
FIGURE 3. Predicted and experimental particle pen-etration curves at different ¯ ow rates for the new
( ) ( )
cyclone. a Deposited mass: 0 mg b Deposited mass: 3 mg. Solid curvess predicted; dotted curves s best
® tted through experimental data.
sponding ¯ ow rate. Other cases for differ-ent deposited masses show similar good agreement between the theoretical predic-tions and experimental data. That is, when the penetration ef® ciency curve is deter-mined for a cyclone at a ¯ ow rate, the penetration curve for a different ¯ ow rate can be predicted accurately if the deposited particle mass remains the same.
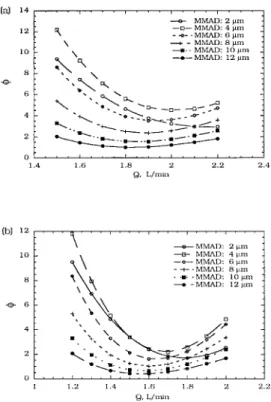
Assuming that the dust is log-normal and GSDs 2.5 and MMAD s 2, 4, 6, 8, 10, 12
m m, f for the cyclones is calculated for s . deposited particle masses. Figures 4 a and
FIGURE 4. f at GSDs 2.5 and different MMADs at
( )
different ¯ ow rates for the new cyclone. a Deposited ( )
m ass: 0 mg b Deposited m ass: 3 mg.
s .b show the case for deposited particle mass of 0 and 3 mg, respectively. Depend-ing on MMAD, it can been seen that the
s .
optimal ¯ ow rate when f is minimum ranges from 1.82 to 2.04 L
r
min when the deposited mass is 0 mg, or from 1.50 to 1.82 Lr
min when the deposited mass is 3 mg. For the deposited particle mass of 0.3 and 0.6 mg, the corresponding optimum ¯ ow rate for the new cyclone has also been determined to be 1.75 to 1.93 Lr
min and 1.64 to 1.72 Lr
min, respectively. As the deposited particle mass in the cyclone is usually on the order of several tenths of a milligram for a typical 8-hour sampling in the workplace, set the optimum ¯ ow rate to be 1.7 Lr
min is seen to be good choice for the new cyclone.Field Comparison of RPM Concentrations
In the glazing-making factory, the experi-mental data showed that the average MMAD was 11.1m m and GSD was 2.73 for the aerosols. The total airborne particle concentration, as determined from the sum of the concentrations of each stage and after ® lter of the Marple impactor, ranged from 1.65 to 4.4 mg
r
m3. The RPMconcen-trations averaged about 23% of the total airborne particle concentrations. At the wind speed of 0.8, 1.3, 1.8, and 2.3 m
r
s, the average ratio of the RPM concentration me asured by the cyclones, denoted ass . s
RPMn new cyclone or RPM10 10 mm
.
nylon cyclone , to the reference RPM
con-s .
centration denoted as RPMm is shown in s .
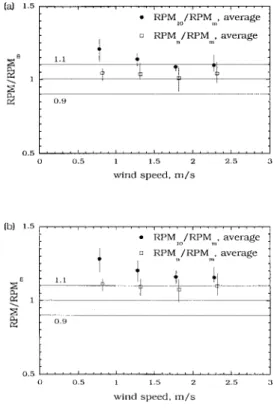
Figure 5 a . The range of each data point is also indicated in the ® gure. The calculation of RPMm is based on the size distribution corrected for the inter-stage loss and inlet ef® ciency for the Marple impactor, but the deposited particle mass effect on particle penetration is not corrected. When the RPMm is corrected for deposited particle mass, the corresponding experimental data
s . are shown in Figure 5 b .
s . s .
It is seen from Figures 5 a and b that RPM concentrations me asured by both cy-clones are higher than the reference RPM concentrations. The RPM concentration me asured by the new cyclones are closer to the reference RPM concentration than those measured by the 10 mm nylon cy-clones. Considering all wind speeds, the RPM10
r
RPMm ratio averages 1.13" 0.13 s ave rage" 2 standard deviation for the 10. mm nylon cyclone, and the RPMnr
RPMm ratio averages 1.03" 0.10 for the newcy-s .
clone, as shown in Figure 5 a . While the wind speed has some effect on the ratio RPM10
r
RPM , the effect is not obviousm for the RPMnr
RPMm ratio. As the de-posited mass effect on particle penetration is corrected for RPM , the ratio becomesmFIGURE 5. Ratio of RPM concentrations determined
( )
by cyclones to reference RPM concentration s RPMm , ( )
glazing-making factory a without correction for de-( )
posited p article m ass b with correction for deposited particle m ass. RPM10s 10 mm nylon cyclone; RPMn
s new cyclone.
7% higher for both RPMn
r
RPMm and s . RPM10r
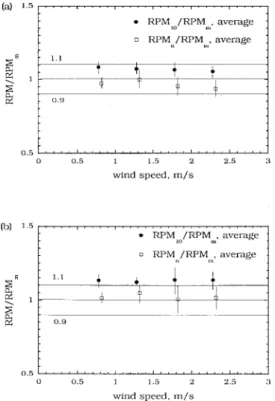
RPM , as shown in Figure 5 b .mParticles in the lead powder factory were smaller that those in the glazing-makin g factory. The average MMAD was 4.82 m m and GSD was 2.26 for the dust particles for all the test runs. The total airborne particle concentration ranged from 0.16 to 0.43 mg
r
m3 and the RPM concentrationaver-aged about 46% of the total airborne parti-cle concentrations. The RPM
r
RPM ratioms . s
is shown in Figure 6 a RPMm is not cor-.
rected for deposited particle mass and Fig-s . Fig-s
ure 6 b RPMm is corrected for deposited .
particle mass . It is seen that both cyclones sampled RPM concentrations at this
Accuracy of Respirable Cyclones 31:6 December 1999
Aerosol Science and Technology 471
FIGURE 6. Ratio of RPM concentrations determined
( )
by cyclones to reference RPM concentrations RPMm , ( )
lead powder factory a without correction for de-( )
posited particle m ass b with correction for deposited particle mass. RPM10s 10 mm nylon cyclone; RPMn
s new cyclone.
tory more accurately than at the previous factory. The RPM10
r
RPMm ratio averages 1.07" 0.07 for the 10 mm nylon cyclone, and the RPMnr
RPMm ratio averages 0.97 " 0.095 for the new cyclone for all winds .
speeds, as shown in Figure 6 a . When the RPMm is corrected for deposited particle mass, the RPM10
r
RPMm ratio becomes 1.13" 0.07 and the RPMnr
RPMm ratio becomes 1.02" 0.095, as shown in Figures .
6 b . In all cases, the new cyclones again appear to sample RPM more accurately than the 10 mm nylon cyclones. And the wind speed does not seem to in¯ uence the RPM
r
RPM ratio for any of the cyclones.mThe effect of the total airborne particle concentrations on the RPM
r
RPMm ratioss . s .
is shown in Figures 7 a and b for the glazing-making factory and lead powder factory, respectively. The ® gures show that the total airborne particle concentrations do not seem to in¯ uence the sampling ac-curacy of neither cyclone in the range of total airborne particle concentrations mea-sured in this study.
CONCLUSIONS
In the ® eld study in both glazing-makin g and lead powder factories, RPM concentra-tions measured by the new cyclone were
FIGURE 7. Ratio of RPM concentrations determined
( )
by cyclones to reference RPM concentration s RPMm , without correction for deposited p article mass, differ-( ) ent total airborn e p article con cen tration s. a
( )
glazing-making factory b lead powder factory.
RPM10s 10 mm nylon cyclone; RPM s new cyclone.n
found to be closer to the reference RPM concentrations than those measured by the 10 mm nylon cyclones. In the glazing-mak-ing factory where the solid particles were large with MMAD averaged about 11 m m, errors in the measured RPM by the cy-clones were found to be larger. The new cyclones over-sampled the RPM concentra-tion by less than 10% while the 10 mm nylon cyclone over-sampled by less than 20% .
When sampling smaller particles such as in the lead powder factory with MMAD averaged about 4.8 m m, the RPM concen-trations measured by both cyclones were closer to the reference RPM concentra-tions. Again the 10 mm nylon cyclone over-sampled by less than 10% while the new cyclone was shown to sample RPM concentrations accurately within experi-mental errors.
Results of this ® eld study also indicated that the effect of the total airborne particle concentrations on the measured RPM con-centrations of the cyclones is negligible. The effect of wind speed ranging from 0.8 to 2.3 m
r
s on the measured RPM concen-trations of the cyclones is also negligible, except for the 10 mm nylon cyclones sam-pling at the glazing-makin g factory.The authors would like to thank the Institute of
Occupa-( )
tional Safety and Health IOSH , Council of Labor Affairs, for the ® nancial support of this project under the contract number IOSH86-A104 .
References
American Conference of Governmental
Indus-s . s .
trial Hygienists ACGIH . 1993 . Threshold Limit Values and Biological Exposure In-dices, Cincinnati, OH, ACGIH, pp. 42] 45.
s .
Bartley, D. L., and Breuer, G. M. 1982 . Analy-sis and Optimization of the Performance of the 10 mm cyclone, Am. Ind. Hyg. Assoc. J. 43:520] 528.
Bartley, D. L., Chen, C. C., Song, R., and
s .
Fischbach, T. J. 1994 . Respirable Aerosol
Sampler Performance Testing, Am. Ind. Hyg. Assoc. J. 56:1036] 1046.
Blackford, D. B., Hanson, A. E., Pui, D. Y. H.,
s .
Kinney, P. D., and Ananth, G. P. 1988 . Details of Recent Work Towards Improving the Performance of the TSI Aerodynamic Particle Sizer, Proc. 2nd Annual Meeting of the Aerosol Society, Bournemouth, U.K., March 22] 24, 1988.
Ettinger, H. J., Partridge, J. E., and Royer, G.
s .
W. 1970 . Calibration of Two-Stage Air Sam-plers, Am. Ind. Hyg. Assoc. J. 31:537] 545. Caplan, K. J., Doemeny, L. J., and Sorenson, S.
s .
D. 1977a . Performance Characteristics of the 10 mm Cyclone Respirable Mass Sampler: Part II} Coal Dust Studies, Am. Ind. Hyg. Assoc. J. 38:162] 173.
Caplan, K. J., Doemeny, L. J., and Sorenson, S.
s .
D. 1977b . Performance Characteristics of the 10 mm Cyclone Respirable Mass Sampler, Am. Ind. Hyg. Assoc. J. 38:83] 95.
Groves, W. A., Hahne, R. M. A., Levine, S. P.,
s .
and Schork, M. A. 1994 . A Field Compari-son of Respirable Dust Samplers, Am. Ind. Hyg. Assoc. J. 55:748] 755.
s .
Kinney, P. D., and Pui, D. Y. H. 1995 . Inlet Ef® ciency Study for the TSI Aerodynamic Particle Sizer, Part. Part. Syst. Charact.
s .
12 4 :188] 193.
Rubow, K. L., Marple, V. A., Olin, J., and
Mc-s .
Cawley, M. A. 1987 . A Personal Cascade Impactor: Design, Evaluation and Calibra-tion, Am. Ind. Hyg. Assoc. J. 48:532] 538. Seltzer, D. F., Bernaski, W. J., and Lynch, J. R.
s1971 . Evaluation of Size-Selective Presam-. plers II. Ef® ciency of the 10 mm Nylon Cy-clone, Am. Ind. Hyg. Assoc. J. 32:441] 446.
s .
Tsai, C. J., and Cheng, Y. H. 1995 . Solid Parti-cle Collection Characteristics on Impaction Surfaces of Different Designs, Aerosol Sci. Technol. 23:96] 106.
s .
Tsai, C. J., and Shih, T. S. 1995 . Particle Col-lection Ef® ciency of Two Personal Respirable Dust Samplers, Am. Ind. Hyg Assoc. J. 56:911] 918.
Tsai, C. J., Shiau, H. G., Lin, K. C., and Shih, T.
s .
S. 1999 . Effect of Deposited Particles and Particle Charge on the Penetration of Small Sampling Cyclones, J. Aerosol. Sci. 30:313] 323.
Received December 14, 1998; accepted June 30, 1999.