www.elsevier.comrlocaterpowtec
A statistical design to evaluate the influence of manufacturing factors
and material properties on the mechanical performances of
microcrystalline cellulose
Jen-Sen Wu, Hsiu-O Ho, Ming-Thau Sheu
)Graduate Institute of Pharmaceutical Sciences, Taipei Medical College, 250 Wu-Hsing Street, Taipei 110, Taiwan Received 10 April 2000; received in revised form 26 June 2000; accepted 11 September 2000
Abstract
In this study, a statistical experimental design was used to evaluate the effects of manufacturing factors and material properties on the
Ž .
mechanical performances of microcrystalline cellulose MCC products for the purpose of optimizing mechanical performances and reducing source variations affecting tablet strength of MCC. Results demonstrated that only fracture toughness and sensitivity to compaction speed among mechanical performances were affected by the manufacturing factors; however, the use of manufacturing factors to predict the mechanical performances was poor. On the other hand, the critical stress intensity factor, fracture toughness, and sensitivity to compaction speed can be quantitatively predicted by material properties examined in this study. Meanwhile, the cohesive energy
Ž .
density CED , degree of crystallinity, crystallinity index, and shape index may serve as important material properties for controlling the mechanical performances of MCC. In conclusion, although the MCC products with high fracture toughness and low sensitivity to compaction speed could be optimally obtained, it was not possible to manipulate manufacturing factors to directly control the exact mechanical performances of MCC products. Instead, material properties of MCC products might potentially be used to precisely predict their mechanical performances. The influence of source variations of MCC products on the strength of tablets might be reduced by regulation of their CED, degree of crystallinity, crystallinity index, and shape index. q 2001 Elsevier Science B.V. All rights reserved.
Keywords: Microcrystalline cellulose; Molecular-related property; Particle morphology; Mechanical parameter; Compactibility; Compressibility
1. Introduction
Ž .
Microcrystalline cellulose MCC is a widely used ex-cipient in direct compression formulations. Source and batch variations have been reported to affect the material
w x
properties and tablet strength of MCC 1,2 . Reduction in the influence of source variation of MCC on tablet strength has been attempted by the process of harmonization. For excipients used in direct compression, both compactibility and compressibility determine the strength of tablets. The compactibility of tablets originates from the intermolecular attraction between particles. The attractive forces of a material can be represented by its cohesive energy density
ŽCED . The CED has been used to estimate Young’s. w x
modulus of a variety of pharmaceutical powders 3 . Mean-while, several mechanical parameters, including Young’s
)
Corresponding author. Tel.: q886-2-23771942; fax: q 886-2-23771942.
Ž .
E-mail address: mingsheu@tmc.edu.tw M.-T. Sheu .
Ž . Ž .
modulus E , critical stress intensity factor KIC , and
Ž .
fracture toughness FT , have been successfully used to probe the mechanical properties and fracture mechanics of
w x
pharmaceutical powders 4 . As a result, the tensile strength of compacts was reported to represent the synergism of
w x
these mechanical parameters 5 .
The compressibility describes the deformability of ma-terials. For polymer excipients, compressibility is related to the aggregation state of the polymer chains. A polymer solid with disordered polymer chains is mechanically weak
w x
and has a higher tendency to deform plastically 6 . Since the plastic deformation process is a function of time, the compressibility of a material deformed plastically is
influ-w x
enced by the speed of compaction 7 . The sensitivity of changing compressibility to compaction speed might pro-duce the problem of the deterioration in strength of tablets when the formulation designer switches from a low-speed formulation phase to high-speed large-scale production. In summary, the influence of source variation on tablet strength of an excipient deformed plastically is closely 0032-5910r01r$ - see front matter q 2001 Elsevier Science B.V. All rights reserved.
Ž .
Ž
linked to its mechanical performances mechanical
param-.
eters and sensitivity to compaction speed .
Industrially, MCC is generally manufactured by mineral acid hydrolysis. The hydrolysis conditions have been re-ported to affect the particle shape, the crystallinity, and the
w x
molecular weight of MCC 8 . It has been proposed that the irregular shapes of particles provide mechanical
inter-w x
locking to strengthen MCC compacts 9 . On the other hand, the aggregation state of a polymer chain and the molecular weight remarkably influence the viscoelasticity
w x
of semicrystalline polymers 10,11 . Further, changes of the aggregation state of a polymer chain might alter the
w x
molar volume and result in a change of its CED 12 , thus changing the intermolecular attraction between particles. Meanwhile, being a semicrystalline polymer, the viscoelas-tic behavior of the amorphous portion of MCC molecules might be responsive to the sensitivity of changing
com-w x
pressibility to compaction speed as well 13 . Therefore, it
Ž
is interesting to explore how the material properties
par-.
ticle morphology and molecular-related properties of MCC affect its mechanical performances. Furthermore, the corre-lation constructed between manufacturing factors and me-chanical performances is useful for manufacturers to opti-mize the mechanical performances of MCC products. It is also desirable to find the key material properties that control the mechanical performances of individual excipi-ents. Only then, can reduction in source variations affect-ing the strength of tablets be made by the control of manufacturing factors and regulation of key material prop-erties. However, no work has been detail reported on these matters.
In this study, the main object is to statistically evaluate the effects of manufacturing factors and material properties on the mechanical performances of MCC products. Manu-facturing conditions could then be optimized to engineer MCC products with desired mechanical performances. On the other hand, the key material properties that control the mechanical performances of MCC products were possibly deduced as a practical way to regulate the qualities of MCC products for minimizing the source variation.
2. Experimental design
A three-factor, five-level central composite design was used. This design is useful for exploring quadratic re-sponse surfaces and constructing a second-order polyno-mial model, thus helping to optimize a process using a small number of experimental runs. The design consists of replicated center points and the set of points lying at each edge of the multidimensional cube that defines the region of interest. A central composite design is made rotatable by the choice of f. The value of f for a design with three factors is 1.68179. The independent variables and their corresponding real and orthogonal values in the central composite design are listed in Table 1. The model
con-Table 1
Independent variables and their corresponding real and orthogonal values in the central composite design
Independent variable Level
y1.68179 y1 0 1 1.68179 ŽX1.Concentration 2.16 2.50 3.00 3.50 3.84 Ž . of HCl N ŽX2.Temperature 8CŽ . 73 77 83 89 93 ŽX3.Duration of 43.2 50.0 60.0 70.0 76.8 Ž . hydrolysis min structed is as follows: Y s b q b X q b X q b X q0 1 1 2 2 3 3 b X X q b X X q b X X q b X2qb X2qb X2q 4 1 2 5 2 3 6 1 3 7 1 8 2 9 3
E, where b to b are the regression coefficients; X , X ,0 9 1 2
and X3 are the factors studied; Y is the measured re-sponse; and E is the error term. The stepwise multiple regression method is a combination of forward and back-ward regressions and is used to eliminate non-significant terms from polynomial equations. In this study, the a-val-ues for both forward and backward regression processes are designated as 0.1. The polynomial equations and re-sponse surface plots were obtained with the statistical
Ž .
package, Design-Expert 5 State-Ease, USA .
3. Materials and methods
3.1. Materials and sample preparations
Ž .
Wood pulp, Temalfa 94 lot no. 61398 , was obtained
Ž .
from Tembec Canada . In preliminary studies, the ex-treme values assigned to the independent variables were first checked to establish that MCC could be prepared under these conditions. The 20 experiments designed to test the effect of three hydrolysis factors are shown in Table 2. A total of 300 g of wood pulp was used for each experiment. After hydrolysis, the hydrolyzed product was washed with distilled water until the pH value of the washing solution was near neutral, and no white precipita-tion appeared with the addiprecipita-tion of a 0.1 N AgNO solu-3
tion. Next, the hydrolyzed product was centrifuged to eliminate water. The wet mass was then forced through a 1.19-mm sieve and oven-dried for 12 h at 60 " 18C. The dried granules were milled and screened through a series
Ž
of sieves with different-sized openings 355, 150, 125, 88,
.
75, 60, and 25 mm to control the particle size distribution of the MCC products to the same range as Avicel PH 102
Žthe mean particle size lying at 10% of normal distribution
wd10 is not more than 45 mm, the mean particle size lyingx w x
at 50% of normal distribution d50 is in the range of 75–95 mm; and the mean particle size lying at 90% of
w x .
normal distribution d90 is not less than 140 mm . The obtained MCC products were stored for at least 7 days at a relative humidity of 40% before any test. The water
con-Ž .
Table 2
Three-factor central composite design: variables, their levels, and matrix and data of the response
Ž .
Run Independent variable Response mechanical performances
a 1r2 a y1 a
Ž . Ž . Ž .
X1 X2 X3 E GPa KIC MPa m FT N m Sensitivity to compaction
b y3 Ž . speed =10 1 y1 y1 y1 10.87 " 0.99 0.860 " 0.024 151.5 " 3.2 3.37 " 1.17 2 y1 1 1 12.43 " 1.31 0.750 " 0.063 105.9 " 13.9 2.81 " 0.50 3 1 y1 1 8.77 " 1.17 0.613 " 0.049 83.4 " 12.8 2.06 " 0.17 4 1 1 y1 8.95 " 0.89 0.853 " 0.081 119.8 " 21.9 2.87 " 0.58 5 0 0 0 9.57 " 0.76 0.604 " 0.019 112.4 " 19.7 2.68 " 0.95 6 0 0 0 8.79 " 0.79 0.829 " 0.119 114.7 " 23.8 2.62 " 0.45 7 y1 y1 1 7.70 " 0.15 0.685 " 0.043 130.7 " 19.4 2.45 " 0.14 8 y1 1 y1 8.51 " 0.60 0.927 " 0.137 179.3 " 44.7 2.03 " 0.11 9 1 y1 y1 9.63 " 0.82 0.645 " 0.064 89.1 " 10.5 3.02 " 1.16 10 1 1 1 6.37 " 0.47 0.477 " 0.018 58.5 " 6.5 2.19 " 1.07 11 0 0 0 10.43 " 0.51 0.781 " 0.178 165.4 " 54.0 2.79 " 0.24 12 0 0 0 7.85 " 0.54 0.572 " 0.028 95.6 " 14.3 2.23 " 0.53 13 1.68179 0 0 8.24 " 0.26 0.629 " 0.068 93.8 " 19.0 2.24 " 0.78 14 y1.68179 0 0 8.61 " 0.27 0.574 " 0.027 99.0 " 12.4 2.09 " 0.54 15 0 1.68179 0 8.98 " 0.64 0.445 " 0.029 63.7 " 11.0 2.73 " 0.46 16 0 y1.68179 0 10.44 " 1.15 0.620 " 0.019 115.7 " 16.5 2.43 " 0.51 17 0 0 1.68179 8.21 " 0.39 0.532 " 0.036 67.5 " 7.7 3.00 " 0.14 18 0 0 y1.68179 11.34 " 0.84 0.558 " 0.060 96.7 " 11.2 2.62 " 0.29 19 0 0 0 9.36 " 0.30 0.487 " 0.054 82.5 " 8.8 2.54 " 0.71 20 0 0 0 8.49 " 0.20 0.584 " 0.072 97.1 " 7.7 3.26 " 1.18 a
Variation is indicated as "S.E.
b
All values are the mean " S.D. of three determinations.
Ž
OHAUS moisture determination balance Model MB200,
.
OHAUS, USA .
3.2. Measurement of molecular-related properties ( )
3.2.1. Degree of polymerization DP
The DP was determined according to National Formu-lary XVIII. The kinematic viscosities of the MCC solution
Ž
and solvent 1.0 M cupriethylenediamine hydroxide
solu-.
tion were measured with a Wells-Brookfield plate
vis-Ž .
cometer Model DV-II q , USA .
3.2.2. Degree of crystallinity
Powder X-ray diffraction measurements were carried out at room temperature on a Shimadzu X-ray
diffractome-Ž .
ter Model XD-5, Japan using monochromatic CuK a radiation and a scan rate of 48r2u per minute over the range of 4–508r2u. According to Nelson and O’Connor
w14 , the degree of crystallinity was calculated as follows:x
% Degree of crystallinitys I
Ž
002yIam.
rI002= 100;Ž .
1 where I002sthe diffractogram height at the position of theŽ .
002 peak 2u s 22.68 ; and Iam is the height of amorphous
Ž .
background 2u s 198 .
3.2.3. Crystallinity index
The crystallinity index was determined from the solid-state 13C CPrMAS nuclear magnetic resonance spectra
w x
and was calculated as described by Ek et al. 15 . The measurements were performed on a Bruker MXL 300 spectrometer operating at 75.47 MHz with spinning at 4.5 kHz using a double air-bearing probe and ZrO rotors. The2
instrumental parameters were: 3 ms contact time, and 2048 data points filled to 4096 K. The chemical shift scale was referenced to the methyl group in adamantane located at 14.0396 ppm. The number of scans on each spectrum was 10,000.
( ) 3.2.4. True density and cohesiÕe energy density CED
The true density was measured using a nitrogen-air
Ž .
pycnometer Model PYC-G100A-1, PMI, USA . The CED of MCC products was calculated from true density as
w x
described by Roberts and Rowe 12 . The average of three determinations was reported.
3.3. Measurement of particle morphology
The image of particles was collected using an image
Ž .
analyzer Microtek, Model MRS-600ZS, Taiwan . The
Ž
software package, Image-Pro Plus 1.0 Media Cybernetics,
.
USA , was used to obtain all dimensions of particles. The shape index and the surface roughness were calculated as
w x w x
described by Iida et al. 8 and Podczeck and Newton 16 . At least 150 particles were analyzed for each MCC prod-uct. The surface roughness was calculated as follows: Surface roughness s 2p r r P f ;
Ž
e.
Ž
m.
Ž .
2where r s arithmetic mean of the distances between thee
center of gravity and the perimeter for an angle of 58 between the measurements; P s perimeter of the particlem
outline; and f is a correction factor to minimize the effect
w
of ellipticity on the surface roughness f s 1.008 y 0.231
Ž Ž ..x
= 1 y breadth of the particlerlength of the particle w16 . A perfect sphere has a surface roughness value ofx
1.00, and increasing surface roughness leads to values smaller than 1.00. The shape index was calculated as follows:
Shape index s 4p A rP2; 3
Ž
.
mŽ .
where A is the projected area of a particle. Theoretically, only a circle can have a shape index of 1.00. For other irregular figures, the value is smaller than 1.00.
3.4. Measurement of mechanical performances
All mechanical properties and sensitivity to compaction speed were determined using a three-point beam bending
Ž
test on a dynamic mechanical analyzer Perkin Elmer,
.
Model DMA 7e, USA . Beams were prepared by compact-ing the powders in a rectangular die, 25 mm in length and 5 mm in breadth. The thickness of the beams was con-trolled at 2 mm by the design of the depth of the upper punch. Since all beams were compressed to a constant thickness of 2 mm, porosity could be varied by changing the weight of powder placed in the die cavity.
3.4.1. Mechanical properties
All mechanical properties are influenced by the solid
w x
fraction of beams. By using Spriggs equation 17 , they were compared at zero porosity by extrapolating the plot of measured mechanical strength vs. porosity to zero. In order to cover a range of porosities, 18 beams of each
Ž .
MCC product were tested. Young’s modulus E was obtained by stressing beams to fracture at a frequency of 1 Hz. The maximum Young’s modulus was recorded. The
Ž .
critical stress intensity factor KIC was determined and
w x
calculated as described by Roberts et al. 18 . Fracture
Ž .
toughness FT was determined and calculated as
de-w x
scribed by Mashadi and Newton 4 .
3.4.2. SensitiÕity to compaction speed
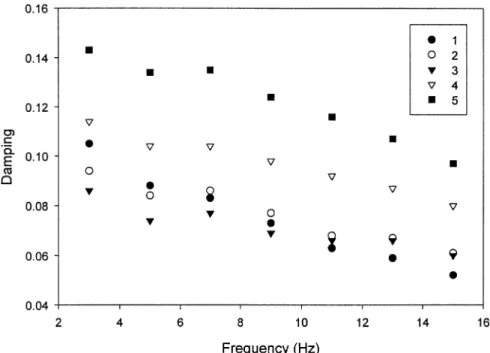
Beams with a porosity of 0.21 were prepared. The damping of beams was measured using a frequency scan on a dynamic mechanical analyzer beginning at a fre-quency of 1 Hz and ending at 16 Hz. The graphs of damping vs. frequency were plotted, and the sensitivity to compaction speed was defined as the slope multiplied by
y1. The average of three beams was reported.
3.5. Statistical methods
3.5.1. Pearson correlation analysis
Pearson correlation measures the closeness of a linear relationship between two variables. If one variable can be
expressed exactly as a linear function of another variable, then the correlation is 1 or y1, depending on whether the two variables are directly or inversely related. A correla-tion of zero means that each variable has no linear predic-tive ability for the other.
3.5.2. Canonical correlation analysis
Canonical correlation analysis is used to examine the linear relationships between a set of independent variables
ŽX. and a set of more than one dependent variable YŽ . w19 . It is especially useful when the dependent or criterionx
variables are moderately intercorrelated. The technique consists of finding one linear combination of the X vari-ables, say
U s a X q a X q a X q PPP1 1 2 2 3 3
Ž .
4 and one linear combinations of the Y variables, sayV s b Y q b Y q b Y q PPP1 1 2 2 3 3
Ž .
5U and V are called the canonical variables of the X ’s and Y ’s, respectively. For any particular choice of coefficients,
the a’s and the b’s, the values of U and V can be
Ž
computed for each individual in the sample 20 runs for
.
this study . The resulting correlation between U and V is called the first canonical correlation and is dependent on the choice of the a’s and the b’s. In canonical correlation analysis, the values of the a and b coefficients are selected to express the best correlations between U and V. Multi-variate tests based on several approximate F statistics including Wilks’ Lambda test, Hotelling–Lawley Trace test, and Roy’s Greatest Root test, are used to determine whether the first canonical correlation is significant.
Ž
The SAS System for Windows 6.12 edition SAS
Insti-.
tute, USA was used to carry out all statistical tests in this study, and P - 0.05 was considered to be statistically significant for all statistical tests.
4. Results and discussion
Measurements of mechanical performances of MCC products manufactured according to this statistical experi-mental design were conducted, and results are shown in
Ž .
Table 2. Young’s modulus E describes the stiffness of a material and originates from the dependence of the energy of interaction between molecules and their distance of
Ž .
separation. The critical stress intensity factor KIC de-scribes the state of stress around an unstable crack or flaw in a material and is an indication of the stress required to produce propagation of a crack. Thus, it is a measure of the brittleness of materials as reflected by the resistance of a material to cracking via tensile stresses acting normal to
Ž .
the crack wall. Fracture toughness FT is an estimate of the energy necessary for crack propagation.
For amorphous materials, the extent of deformation is sensitive to compaction speed. Compaction at low speed
Ž
Fig. 1. Damping of beams produced from MCC vs. the frequency of deformation numbers refer to MCC products obtained from runs 1 to 5 of
.
experimental design as listed in Table 2 .
results in the formation of tablets with low porosity, since deformation is dominated by the viscous component, which is irreversible. Compaction at high speed produces tablets with higher porosity and lower strength, because of an
w x
increase of elasticity of materials 13 . MCC is a semicrys-talline polymer, therefore, the amorphous portion of the MCC molecule might possess viscoelasticity and be sensi-tive to tableting speed. Damping has been used to measure
Ž . Ž .
w x
the viscoelasticity of a material 20 . The lower the damp-ing value, the less of a tendency there is for a material to deform irreversibly. Therefore, damping of beams pro-duced from MCC decreases with an increase of deforma-tion frequency as shown in Fig. 1. Meanwhile, at a definite frequency of deformation, damping remains constant as the
w x
porosity of MCC compacts falls below 0.4 21 . Thus,
sensitivity of changing compressibility to compaction speed of MCC products is simulated by the sensitivity of chang-ing dampchang-ing values to deformation frequency of the beams with a porosity of 0.21.
The stepwise multiple regression of these mechanical
Ž
performances with respect to hydrolysis factors X , X ,1 2
.
and X3 based on a central composite design of 20
experi-Ž . Ž .
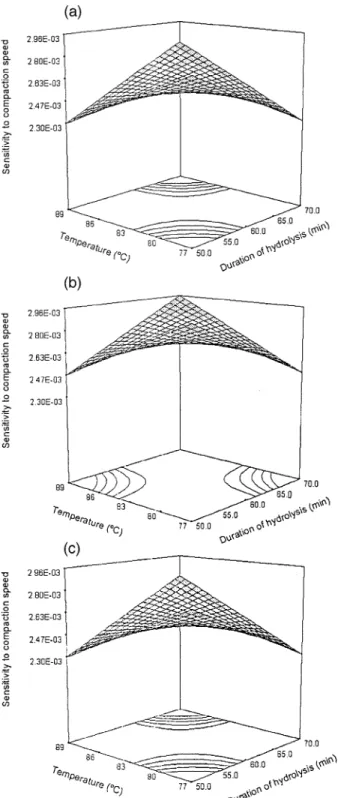
Fig. 3. Response surface plot showing the effect of temperature X2 and duration of hydrolysis X3 on the sensitivity to compaction speed of MCC
Ž . Ž . Ž .
mental sets was only able to generate two second-order
Ž .
polynomial equations for fracture toughness FT and sen-sitivity to compaction speed.
FT s 106.11 y 16.51 X y 15.39 X , R2s0.3598 ;
Ž
.
1 3
6
Ž .
Sensitivity to compaction speeds0.002717 y 0.0001679 X12
q0.0002457X X ,
Ž
R2s0.3091 ..
Ž .
7 2 3The results show that FT and sensitivity to compaction speed are significantly affected by the hydrolysis factors
ŽP - 0.05 . According to Eq. 6 , FT was independent of. Ž . Ž .
temperature X . Fig. 2 shows the effect of HCl concen-2
Ž . Ž .
tration X1 and duration of hydrolysis X3 on FT at a
Ž .
fixed temperature 838C . The fracture toughness de-creased with increasing HCl concentration and duration of hydrolysis. On the other hand, Fig. 3 shows the effect of
Ž . Ž .
temperature X2 and duration of hydrolysis X3 on sensi-tivity to compaction speed at low, medium, and high
Ž
concentrations of HCl 2.50, 3.00, and 3.50 N,
respec-.
tively . Either increasing temperature for a short duration or lowering temperature with prolonged hydrolysis would result in a decrease of sensitivity to compaction speed of MCC products irregardless of what level of HCl concentra-tion was used. Based on these two quantitative equaconcentra-tions, a MCC product with high fracture toughness and low sensi-tivity to compaction speed could be optimally obtained by
Ž . Ž
hydrolysis at high temperature 898C , short duration 50
. Ž . 2
min , and low level of HCl 2.50 N . However, the R
values of these two polynomial equations are quite low, which means that the predicted precision of FT and sensi-tivity to compaction speed by these hydrolysis factors are poor. Results also demonstrate that E and KIC depend on none of the selected variables. This means that neither the stiffness nor brittleness of MCC products are affected by these hydrolysis factors.
Since the use of manufacturing factors to predict the mechanical performances was poor, it was thought that material properties of MCC instead might possibly be correlated with mechanical performances to some extent and might be useful to predict the mechanical perfor-mances of MCC products. Material properties of MCC are divided into molecular-related properties and particle mor-phology. Table 3 shows the average experimental results of these material properties of MCC products. The degree
Ž .
of polymerization DP of MCC is the average number of glucose units in a molecule, which is proportional to the molecular mass. The degree of crystallinity was calculated from the X-ray diffractogram. This parameter describes the regularity of the arrangement of polymer chains. The crystallinity index was calculated from NMR spectra by
Ž .
dividing the intensity of the crystalline C4 peak 89 ppm
Ž .
by the sum of the crystalline and amorphous C4 84 ppm intensities. This index indicates the extent of hydrogen bonding between glucose units of the MCC molecule,
` X
since the O3 H PPP O intramolecular hydrogen bonding5 makes the C4 carbon peaks shift toward a lower magnetic
w x
field 22 . The CED was calculated from the true density. Denser molecules of the same chemical structure of MCCs result in a higher value of CED, thus indicating higher
Table 3
Molecular-related properties and particle morphology of MCC products
Run Degree of Degree of Crystallinity Cohesive energy Surface Shape
a a b b
Ž . Ž . Ž . Ž .
polymerization DP crystallinity % index % density CED, MPa roughness index
1 241.02 " 0.78 67.8 56.9 926.36 " 3.68 0.86 " 0.12 0.59 " 0.19 2 191.18 " 0.92 74.2 57.8 928.79 " 4.95 0.90 " 0.09 0.73 " 0.14 3 206.54 " 0.81 79.3 61.2 921.32 " 2.77 0.88 " 0.06 0.69 " 0.11 4 187.75 " 1.73 74.8 59.4 934.96 " 10.28 0.88 " 0.06 0.68 " 0.11 5 195.78 " 1.67 73.2 70.8 917.36 " 6.43 0.89 " 0.07 0.70 " 0.14 6 206.92 " 0.63 74.1 64.0 925.88 " 11.12 0.88 " 0.08 0.69 " 0.15 7 236.17 " 1.27 77.5 58.5 910.14 " 1.22 0.83 " 0.09 0.59 " 0.14 8 200.56 " 0.06 77.9 64.7 924.80 " 2.61 0.87 " 0.06 0.68 " 0.12 9 205.43 " 0.90 79.1 64.3 928.40 " 9.34 0.88 " 0.08 0.69 " 0.14 10 188.21 " 0.94 77.1 65.3 925.82 " 2.45 1.01 " 0.10 0.90 " 0.17 11 207.44 " 0.90 75.4 65.6 933.59 " 2.13 0.88 " 0.07 0.69 " 0.13 12 199.16 " 0.86 75.0 67.8 910.82 " 3.95 0.88 " 0.09 0.67 " 0.15 13 193.71 " 0.04 78.3 67.0 917.55 " 7.87 0.88 " 0.07 0.70 " 0.13 14 229.47 " 0.67 76.7 65.0 907.71 " 5.59 0.87 " 0.07 0.65 " 0.14 15 189.57 " 0.95 76.7 62.7 917.11 " 4.83 0.87 " 0.06 0.70 " 0.10 16 247.31 " 1.17 79.2 65.8 922.36 " 10.04 0.85 " 0.10 0.59 " 0.17 17 195.37 " 1.59 77.1 64.2 921.84 " 6.56 0.88 " 0.11 0.70 " 0.17 18 206.14 " 1.41 75.9 66.0 922.79 " 6.15 0.87 " 0.09 0.65 " 0.13 19 197.90 " 2.49 71.7 68.5 925.19 " 6.27 0.88 " 0.09 0.69 " 0.13 20 199.14 " 0.03 76.3 71.2 920.37 " 1.79 0.88 " 0.10 0.68 " 0.14 a
All values are the mean " S.D. of three determinations.
b
() J.-S. Wu et al. r Powder Technology 118 2001 219 – 228 Table 4
Correlation matrix of material properties and mechanical performances of MCC products
Variable DP Crystallinity Degree of CED Surface Shape E KIC FT Sensitivity to
index crystallinity roughness index compaction
speed ) ) DP 1 y0.27035 y0.0628 y0.2783 y0.5511 y0.7162 0.2068 0.2063 0.4026 0.0087 Ž0.2490. Ž0.7924. Ž0.2349. Ž0.0118. Ž0.0004. Ž0.3817. Ž0.3828. Ž0.0784. Ž0.9709. ) Crystallinity 1 0.1584 y0.2348 0.1898 0.2053 y0.2558 y0.4683 y0.2236 y0.1542 Ž . Ž . Ž . Ž . Ž . Ž . Ž . Ž . index 0.5048 0.3190 0.4228 0.3852 0.2763 0.0373 0.3433 0.5162 ) Degree of 1 y0.2120 0.0128 0.1352 y0.3617 y0.2585 y0.2546 y0.4839 Ž . Ž . Ž . Ž . Ž . Ž . Ž . crystallinity 0.3696 0.9573 0.5698 0.1171 0.2712 0.2787 0.0306 ) CED 1 0.2739 0.2689 0.4062 0.4683 0.2570 0.4263 Ž0.2426. Ž0.2517. Ž0.0756. Ž0.0373. Ž0.2741. Ž0.0609. ) Surface 1 0.9531 y0.3234 y0.3043 y0.4357 y0.1252 Ž . Ž . Ž . Ž . Ž . roughness 0.0001 0.1643 0.1921 0.0549 0.5989 ) Shape 1 y0.3705 y0.3019 y0.4606 y0.2106 Ž . Ž . Ž . Ž . index 0.1078 0.1957 0.0410 0.3728 E 1 0.2917 0.3143 0.4240 Ž0.2121. Ž0.1772. Ž0.0625. ) KIC 1 0.8518 0.1571 Ž0.0001. Ž0.5084. FT 1 0.0620 Ž0.7950. Sensitivity to 1 compaction speed
Figures in parentheses indicate P values.
)
w x
attractive forces between molecules 12 . On the other hand, particle morphology was described by the shape index and surface roughness. The shape index represents the regularity of particle shape, and the parameter of surface roughness describes the degree of roughness of particle surfaces.
The relationships between these molecular or particle features and mechanical performances were deduced by Pearson correlation analysis. Further, the canonical correla-tion analysis was employed to examine the key material properties for controlling mechanical performances of MCC
w x
products as described by Bohidar and Bohidar 23 . The correlation matrix for the Pearson correlation analysis is shown in Table 4. KIC shows a moderate correlation to
Ž .
CED 0.4683, P s 0.0373 . As expected, an increase in intermolecular attraction enhances resistance of MCCs to cracking. Further, KIC also shows a moderate correlation
Ž .
to the crystallinity index y0.4683, P s 0.0373 . When the extent of intramolecular hydrogen bonding increases,
KIC of MCC decreases. This might be explained by the intramolecular hydrogen bonding confining the polymer chains to a specified aggregation state, thus reducing the free polymer chains able to participate in the intermolecu-lar hydrogen bonding between particles. Since hydrogen bonding is the strongest attractive force among the inter-molecular forces, the decrease in interinter-molecular hydrogen bonding between particles is accompanied by a decrease in mechanical strength of beams. FT displays a moderate
Ž .
correlation to shape index y0.4606, P s 0.0410 . When particles of MCC become irregular, FT increases. This might be explained by the irregular particles providing a greater extent of mechanical interlocking, and the energy necessary for crack propagation being larger than that in symmetrical ones. The sensitivity to compaction speed has a moderate correlation with degree of crystallinity
Žy0.4839, P s 0.0306 . This result demonstrates that an.
increase in the amorphous portion of MCC molecules is accompanied by increasing sensitivity of changing com-pressibility to compaction speed of these polymer solids.
The key material properties of MCC products were evaluated by canonical correlation analysis. The
indepen-Ž . Ž
dent variables X are material properties degree of
crys-.
tallinity, crystallinity index, CED, and shape index . Since the DP and surface roughness correlated to none of the
Ž .
mechanical performances as shown in Table 4 , these two material properties were excluded from the canonical
cor-Ž .
relation analysis. The dependent variables Y are mechan-ical performances. The first canonmechan-ical correlation is 0.8917, which is statistically significant based on approximate F
Ž .
statistics of Wilks’ Lambda test P s 0.0132 , Hotelling–
Ž .
Lawley Trace test P s 0.0020 , and Roy’s Greatest Root
Ž .
test P s 0.0001 . Standardized coefficients and the corre-lation of the canonical variables with the original variables for the first canonical correlation are shown in Table 5. Considering the coefficients of X-set variables, the CED is the highest contributor to the X ’s canonical variable. This
Table 5
Canonical correlation analysis of material properties and mechanical performances of MCC products
Variable Standardized Correlation
coefficients
( )
Material property X Õariable
Degree of crystallinity y0.2958 y0.5540
Crystallinity index y0.1370 y0.4786
Cohesive energy density 0.7389 0.6750
Shape index y0.5907 y0.4601
( )
Mechanical property Y Õariable
Young’s modulus 0.3965 0.7413
Critical stress intensity factor 0.5458 0.7458
Fracture toughness 0.0212 0.6369
Sensitivity to compaction speed 0.4218 0.6770
shows that the attractive force between molecules is the most important material property controlling the mechani-cal performances of MCC products. The correlation
be-Ž .
tween CED and its canonical variable is moderate 0.6750 . At the same time, the degree of crystallinity, crystallinity index, and shape index also present a moderate correlation
Ž
to their canonical variables y0.5540, y0.4786, and .
y0.4601, respectively . This means that the degree of
crystallinity, crystallinity index, and shape index also serve as important material properties controlling the mechanical performances of MCC. All mechanical performances show a moderate correlation to their respective canonical vari-ables. This means that all mechanical performances are well controlled by these material properties of MCC prod-ucts examined.
5. Conclusions
Among the mechanical performances of MCC products, only fracture toughness and sensitivity to compaction speed were affected by the manufacturing factors. However, the manufacturing factors cannot be used to precisely predict mechanical performances. Nevertheless, a MCC product with high fracture toughness and low sensitivity to com-paction speed could be optimally obtained by hydrolysis at
Ž . Ž .
high temperature 898C , of short duration 50 min , and
Ž .
with a low level of HCl 2.50 N . Pearson correlation analysis revealed that the critical stress intensity factor, fracture toughness, and sensitivity to compaction speed of MCC products can be quantitatively predicted by material properties examined in this study. Thus, MCC products with optimized mechanical performances might be ob-tained by the selection of adequate material properties. The CED, representing the attractive forces between molecules, was found to be the key material property of MCC prod-ucts controlling their mechanical performances. In
addi-tion, the degree of crystallinity, crystallinity index, and shape index may also serve as important properties for controlling the mechanical performances of MCC. There-fore, the influence of source variations of MCC products on the strength of tablets might be reduced by regulation of their CED, degree of crystallinity, crystallinity index, and shape index.
List of symbols
A projected area of a particle CED cohesive energy density DP degree of polymerization
E Young’s modulus
F Fisher’s F distribution
f a correction factor defined in Eq. 2Ž .
FT fracture toughness
I002 the X-ray diffractogram height at the position of
the 002 peak of MCC products
Iam the X-ray diffractogram height of amorphous
background of MCC products
KIC critical stress intensity factor
P probability
Pm perimeter of a particle outline
R2 squared multiple correlation coefficient
re arithmetic mean of the distances between the center of gravity and the perimeter of a particle
U canonical variable of the independent variables
V canonical variable of the dependent variables
X independent variable
Y dependent variable
Greek letters
a critical value of probability used in the stepwise
multiple regression
f value for rotatability of the central composite
design
Acknowledgements
We would like to express our sincere thanks for the financial support of the National Science Council of the
Ž .
Republic of China NSC 89-2320-B038-065 .
References
w x1 M. Landin, R. Martinez-Pacheco, J.L. Gomez-Amoza, C. Souto, A. Ž .
Concheiro, R.C. Rowe, Int. J. Pharm. 91 1993 133.
w x2 M. Whiteman, R.J. Yarwood, Powder Technol. 54 1988 71.Ž . w x3 R.J. Roberts, R.C. Rowe, Powder Technol. 65 1991 139.Ž . w x4 A.B. Mashadi, J.M. Newton, J. Pharm. Pharmacol. 39 1987 961.Ž . w x5 R.J. Roberts, R.C. Rowe, P. York, Int. J. Pharm. 125 1995 157.Ž . w x6 A. Martin, Physical Pharmacy, 4th edn., Lea & Febiger,
Philadel-phia, PA, 1993, pp. 575–581.
w x7 R.J. Roberts, R.C. Rowe, J. Pharm. Pharmacol. 37 1985 377.Ž . w x8 K. Iida, K. Aoki, K. Danjo, A. Otsuka, C.Y. Chen, E. Horisawa,
Ž .
Chem. Pharm. Bull. 45 1997 217.
w x9 C. Nystrom, G. Alderborn, M. Duberg, P.G. Karehill, Drug Dev.¨ Ž .
Ind. Pharm. 19 1993 2143.
w10 S. Manabe, K. Kamide, Polym. J. 16 1984 375.x Ž .
w11 J.E. Mark, A. Eisenberg, W.W. Graessley, L. Mandelkern, E.T.x
Samulski, J.L. Koenig, G.D. Wignall, Physical Properties of Poly-mers, 2nd edn., American Chemical Society, Washington, DC, 1993, pp. 194–195.
w12 R.J. Roberts, R.C. Rowe, Int. J. Pharm. 99 1993 157.x Ž .
w13 K.V.V. Maarschalk, H. Vromans, G.K. Bolhuis, C.F. Lerk, Eur. J.x Ž .
Pharm. Biopharm. 42 1996 49.
w14 M.L. Nelson, R.T. O’Connor, J. Appl. Polym. Sci. 8 1964 1325.x Ž . w15 R. Ek, G. Alderborn, C. Nystrom, Int. J. Pharm. 111 1994 43.x ¨ Ž . w16 F. Podczeck, J.M. Newton, Int. J. Pharm. 124 1995 253.x Ž . w17 R.M. Spriggs, J. Am. Ceram. Soc. 44 1961 628.x Ž .
w18 R.J. Roberts, R.C. Rowe, P. York, Int. J. Pharm. 91 1993 173.x Ž . w19 A.A. Afifi, V. Clark, Computer-Aided Multivariate Analysis, 2ndx
edn., Van Nostrand Reinhold, New York, 1990, pp. 252–256.
w20 D.Q.M. Craig, F.A. Johnson, Thermochim. Acta 248 1995 97.x Ž . w21 G.W. Radebaugh, S.R. Babu, J.N. Bondi, Int. J. Pharm. 57 1989x Ž .
95.
w22 K. Kamide, K. Okajima, K. Kowsaka, T. Matsui, Polym. J. 17x Ž1985 701..