計劃名稱:科學知識、廣告訊息與現實生活瘦身相關行為之關聯性:
國中、高中職、大學女生及社會婦女之系列研究(1/3)
計劃編號:NSC90-2511-S-009-002
主 持 人:周倩、陳光文
執行單位:國立交通大學教育研究所
關 鍵 字:瘦身信念、廣告訊息、廣告態度、國中女生、高中女生、weight-loss attitude, weight-loss advertising, junior high females, senior high females中文摘要:本文為一系列研究之第一篇論文,本年度的研究重點放在廣告訊息的態 度測量上,其目的在發展一我國中學女生對瘦身廣告之態度量表,以作為後續研究 之工具。本量表名為 Weight-loss Advertising Attitude Scale (WAAS),其中包含五個 分量表:(1) 吸引度 (2) 廣告手法 (3) 廣告模特兒 (4) 說服性 (5) 談論話題。本研究 收集了約 3500 個台灣國高中女生的資料以作為量表信度與效度之檢驗基礎。研究 結果發現,在五個分量表中,受試者對說服性最同意,其次為廣告模特兒、吸引 度。一般而言,高中女生在瘦身廣告五個層面的態度顯著高於國中女生,但是國中 女生的廣告態度與大眾媒體(電視、電視購物頻道、廣播、報紙、雜誌、網路)的 暴露時間的正向關係較強烈,所以大眾媒體的暴露時間可能對年紀較大女生較正向 的瘦身廣告態度關聯性較弱。
英文標題:Developing an Attitude Scale of Female Junior High and High School Students toward Weight-loss Advertising in the Mass Media
英文摘要:The purpose of this study was to develop an attitude scale for assessing weight-loss advertising presented in the mass media. This scale is entitled the Weight-loss Advertising Attitude Scale (WAAS). The scale includes five factors (subscales): (1) Attractiveness of the advertisement, (2) Form and manner of the ad, (3) Beautiful models employed, (4) Perceived persuasiveness of the ad, and (5) Topics of discussion. The results indicated that senior high school students had higher mean scores on all five scales than those of junior high school students. Generally speaking, the junior high students’ media exposure was positively correlated with more aspects of weight-loss aspects. In contrast, the relationship between the senior high students’ media exposure and their weight-loss attitudes were weaker in many aspects. Therefore, one may conclude that mass media exposure may have weaker connections to older girls’ attitudes toward weight-loss advertising.
Introduction
The concept of weight-loss has been the subject of much theoretical and empirical research in recent years. Many studies have shown that the majority of adolescent girls wish to be thinner and that many engage in dieting or other weight loss behaviors (e.g., Wertheim et al., 1998; Tiggemann et al., 2000). Why do these adolescent girls do so? Posavac, Posavac, Posavac (1998) stated that the ideal image of feminine attractiveness currently presented in the media is one of the reasons: it emphasizes thinness. Some
researchers (e.g., Cash & Henry, 1995; Freedman, 1984) have suggested that media images of attractiveness may be responsible for the widespread dissatisfaction among young women regarding their own body weight.
Advertising is indeed one branch of the mass media with a clear goal – sell an idea, product, or service. Byrd-Bredbenner & Grasso (2000) stated that every day, children and adults across the United States are bombarded with advertisements. The same is true of people in Taiwan. Among all types of mass advertising, T. V. commercials are probably the most widely used medium because they reach an enormous audience of people at home, relaxed and receptive. Television ads also create many sensational or seemingly scientific messages, especially those related to health problems and weight-loss issues. These messages may contribute to the formation, maintenance, and reproduction of some weight-loss misconceptions among our adolescent girls, and in turn may significantly impact their attitudes and daily lives.
What weight-loss messages do adolescent girls receive from media advertising? Do they like the delivery of these ads? Are they persuaded by the messages? Do they recognize or identify the beautiful models in the advertising? Do they discuss the commercials or models with their family or friends? Questions such as these raise one’s curiosity and invite inquiry. Assessing adolescent girls’ attitudes toward the advertising presented in the mass media is indeed the first step for future weight-loss research. However, no valid or reliable measure is now available in Chinese. Therefore, this study aims to develop an attitude scale to assess weight-loss advertising presented in the mass media, entitled the Weight-loss Advertising Attitude Scale (WAAS). Variables including grade levels and mass media exposures were also analyzed in this study.
The development of the WAAS
To develop the weight-loss attitude scale (WAAS), a pool of items was collected in three ways. First, a six-month period of recordings and analyses were conducted on (1) Taiwan television programs and commercials on about 50 major channels (including shopping channels), (2) ten major radio stations, (3) five major newspapers, (4) 23 major women’s magazines, including popular English magazines in their Chinese versions such as ELLE, Vogue, and Cosmopolitan, and (5) the discussions on advertising-, beauty-, weight-loss-,
health- and cosmetics-related boards on the Taiwan Bulletin Board System (BBS).
Second, in-depth interviews were conducted with 25 junior high and senior high school females regarding their attitudes toward weight-loss advertising. Questions included: What weight-loss advertisements do you frequently watch, hear or read in the mass media? Do you like the models? Do you believe what the models say or do? Do you want to try the weight-loss methods presented? What weight-loss ads attract you most, and in what way? The students interviewed were not only asked to answer these questions, but also to explain why they answered as they did.
Third, ten junior high and senior high school females were asked to write down their impressions, opinions, and feelings about the weight-loss messages presented in the mass
Based on the above three methods, 29 statements were included in the initial WAAS, with a six-point Likert scale (strongly disagree, disagree, slightly disagree, slightly agree, agree, and strongly agree) assigned to each. For clarity, three health education or communication experts revised the wording, length, and format of the initial WAAS.
Using cluster sampling, approximately 3,500 Taiwan junior and senior high school students were selected as the participants of this study. The population of high school students in Taiwan was clustered into four demographic areas: northern, central, southern, and eastern. Fifty schools were selected from the four areas. For each school, two to four classes (depending on the percentage of females within that class) were randomly selected to form the subject pools. The research data gathered from these students were used to explore their attitudes toward weight-loss advertising in the mass media, their mass media exposure (hours per week), and their knowledge about body fat, body image satisfaction, actual and ideal height and weight, and some other related variables. These findings will be published later (e.g., Chou, 2002). The focus of this article is to report on just one aspect of this research: the development of the attitude scale toward weight-loss advertising in the mass media.
Collected data were visually scanned first. If there was an entire section unanswered, or all answers were the same for any one of the sections, that portion was excluded from further consideration. Single answers left blank or unidentifiable marks on some items of the initial version of the WAAS were calculated as “missing” data. Therefore, the valid number of student cases on each item or subscale of the attitude measurement varied.
Exploratory factor analysis was used on the data for item analysis; in particular, principle component analysis with varimax rotation was used to clarify the WAAS structure. The eigenvalues of the first five factors from principle component analysis were larger than one: 4.407, 3.675, 3.121, 2.128 and 2.054. Therefore, only five factors were retained in the final version of the scale and they accounted for 61.54% of variance. An item was retained only when it loaded greater than .40 on the relevant factor and less than .40 on the non-relevant factor. Thus the initial 29 items were reduced to 25, as shown in Table 1. There is no negative statement scoring in a reverse way retained in this study. A detailed description of the five subscales is presented below:
1. The attraction subscale (nine items): measures students’ attraction to the message, methods presented in weight-loss advertising.
2. The form and manner subscale (six items): measures students’ impressions of the way weight-loss advertising was presented.
3. The beautiful model subscale (five items): measures students’ feeling about the models presented in weight-loss advertising.
4. The perceived persuasion subscale (three items): measures students’ perceptions of persuasive messages delivered by the weight-loss advertising.
5. The topics of discussion subscale (two items): measures students’ degree that they like to discuss weight-loss advertising with others.
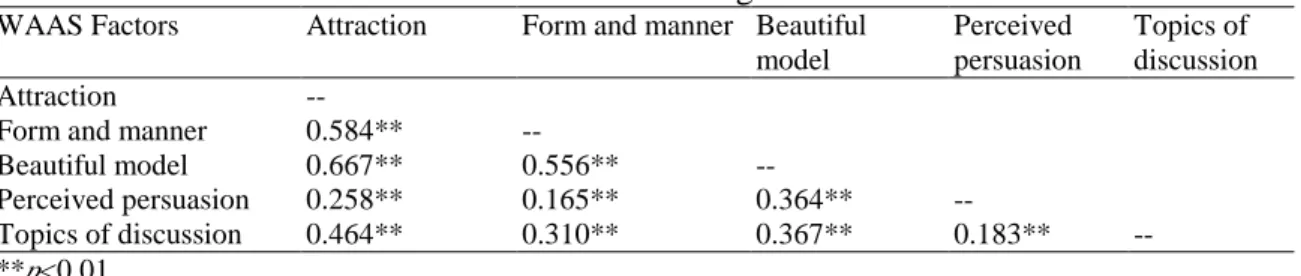
The internal reliability index, alpha coefficients, were adequate for the first five subscales: 0.903, 0.809, 0.782, 0.637, and 0.872, and for the entire scale, 0.920. Table 3 further shows the inter-correlation matrix among five subscales. Because all the correlations reached the significant level of 0.01, the five factors measure WAAS in a coherent way.
Table 1: Summary of items and factors loaded for the five-factor solution of the WAAS
Factor loadingb Itema
1 2 3 4 5 3. I would like to lose some weight. 0.830
4. I want to be thinner whenever I see slender models in advertisements. 0.783 6. Even if I don’t have enough money, I will try some inexpensive
weight-loss methods such as diet or exercise.
0.719 5. If I had enough money, I would try weight-loss methods shown in ads. 0.619 23. I usually want to try weight-loss methods advertised. 0.583 10. Weight-loss advertisements usually draw my attention over all other
kinds of ads.
0.573 7. I usually read carefully the details of weight-loss advertising. 0.570 25. I want to look like the models in the weight-loss ads. 0.557 26. I would feel more confident if I looked like the models in the
weight-loss ads.
0.490 19. Weight-loss methods demonstrated by models in ads are true. 0.712 18. On the whole, I have a good impression of weight-loss advertisements. 0.708 13. Weight-loss advertisements are emotionally touching. 0.676 21. Weight-loss methods shown in advertising can be effective. 0.672 12. Weight-loss advertisements are sensational. 0.671 17. I wish I were a model in advertising. 0.506 11. Models in commercials are pretty. 0.700 8. I pay attention to the faces and figures of models in the commercials. 0.696 9. I pay attention to the pictures/photos of the models in weight-loss ads. 0.613 16. Models in advertising have high self-confidence because of their good
figures.
0.522 15. Models in weight-loss commercials are filmed beautifully. 0.510 29. The weight-loss ads try to persuade us to buy weight-loss products. 0.722 28. Weight-loss ads tell us that it is important to have a good figure. 0.703 22. I think that many people try to lose weight because they are persuaded
by the weight-loss ads.
0.641 1. I like to talk with others about the weight-loss methods presented in
the mass media.
0.839 2. I like to talk with others about weight-loss advertising in the mass
media.
0.834
α 0.903 0.809 0.782 0.637 0.872 Eigen value 4.407 3.675 3.121 2.128 2.054 % of variance explained 17.626 14.699 12.484 8.513 8.216
N = 2771, α = 0.920 for entire measure, total variance explained is 61.537%.
a The item number indicates the item order in the initial version of the WAAS (a total of 29 items) b
Factor 1=Attraction, 2=Form and manner, 3=Beautiful models, 4=Perceived persuasion, 5=Topics of discussion
Table 2: Correlation coefficients for relations among five factors of WAAS
WAAS Factors Attraction Form and manner Beautiful model Perceived persuasion Topics of discussion Attraction
--Form and manner 0.584**
--Beautiful model 0.667** 0.556**
--Perceived persuasion 0.258** 0.165** 0.364**
--Students’ scor es on the WAAS scale
Table 3 shows the students’ mean scores and standard deviations on the five subscales. Each subject’s mean score for every subscale was calculated by the sum of the answers to each statement (1, 2, 3, 4, 5, or 6) in that subscale, and then divided by the number of statements of that subscale. Most of the mean scores are between slightly-disagree (3) and agree (5).
Table 3: The item numbers, number of subjects, means and standard deviations of each subscale
Subscale Item number N mean S.D.
Attraction 9 2910 3.984 1.427
Form and manner 6 2927 3.280 1.167
Beautiful models 5 2949 4.394 1.317
Perceived persuasion 3 2973 4.888 1.317
Topics of discussion 2 3025 3.869 1.746
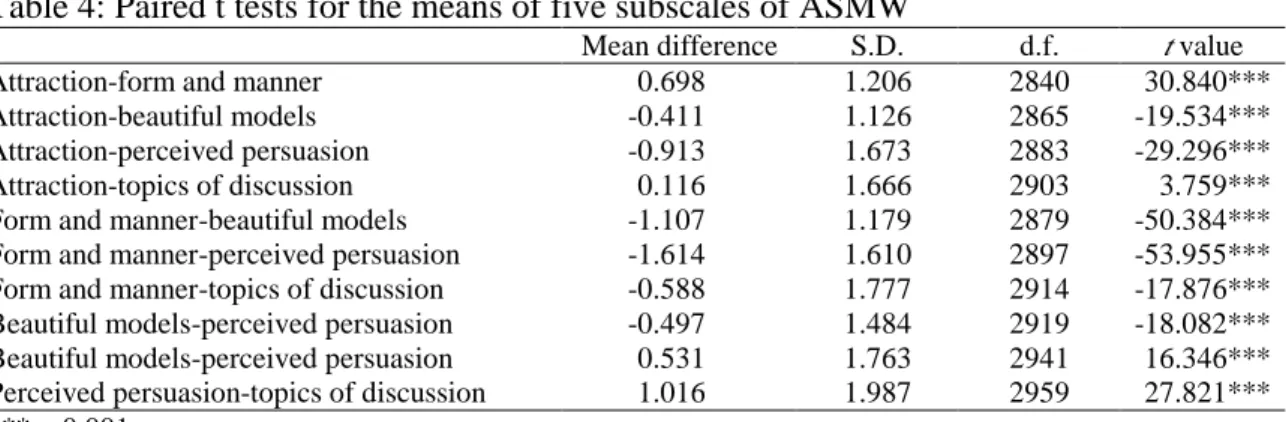
To investigate the differences among the five WAAS subscales, a repeated measure of multivariate analyses of variance (MANOVA) was conducted. The results indicated that five subscales are significantly different (Wilks’ LambdaΛ=0.437, F= 889.078, p<0.001).
Therefore, paired t tests were conducted to detect the difference between every two
subjects. Table 4 showed the mean differences, standard deviations, degree of freedom, and t value of the comparisons. The results indicate that the largest mean scores were for
perceived persuasion and, in descending order, beautiful models, attraction, topics of discussion, and form and manner.
Table 4: Paired t tests for the means of five subscales of ASMW
Mean difference S.D. d.f. t value
Attraction-form and manner 0.698 1.206 2840 30.840***
Attraction-beautiful models -0.411 1.126 2865 -19.534***
Attraction-perceived persuasion -0.913 1.673 2883 -29.296***
Attraction-topics of discussion 0.116 1.666 2903 3.759***
Form and manner-beautiful models -1.107 1.179 2879 -50.384*** Form and manner-perceived persuasion -1.614 1.610 2897 -53.955*** Form and manner-topics of discussion -0.588 1.777 2914 -17.876*** Beautiful models-perceived persuasion -0.497 1.484 2919 -18.082*** Beautiful models-perceived persuasion 0.531 1.763 2941 16.346*** Perceived persuasion-topics of discussion 1.016 1.987 2959 27.821*** ***p<0.001
Level differences on the scale
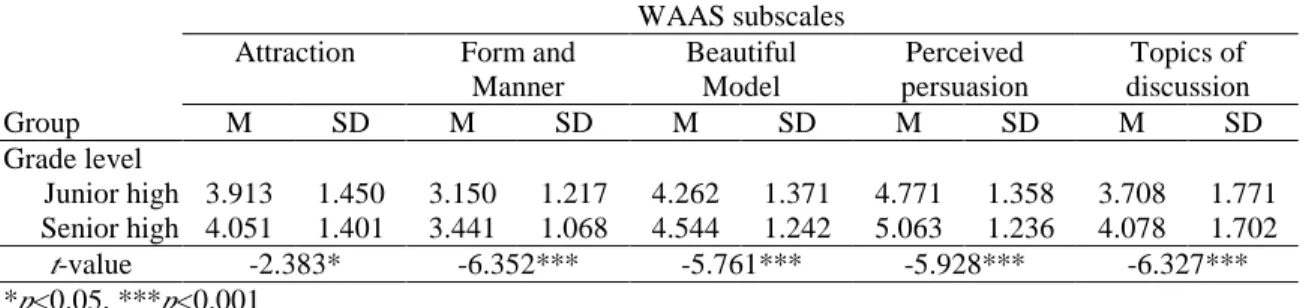
To investigate the differences between grade levels (junior high vs. senior high) on the five subscales, a repeated measure of MANOVA was conducted. The results indicated that grade level significantly impacted the five scales (Wilks’ Lambda Λ=0.992. F=5.383, p<0.001). Furthermore, independent sample t tests indicated that senior high school
students had higher means scores on all five scales than those of junior high school students. Table 5 showed students’ mean scores and standard deviations for five subscales of WAAS as a function of grade level.
Table 5: mean scores, standard deviations and t values for subscales of WAAS as function of grade level
WAAS subscales Attraction Form and
Manner Beautiful Model Perceived persuasion Topics of discussion Group M SD M SD M SD M SD M SD Grade level Junior high 3.913 1.450 3.150 1.217 4.262 1.371 4.771 1.358 3.708 1.771 Senior high 4.051 1.401 3.441 1.068 4.544 1.242 5.063 1.236 4.078 1.702 t-value -2.383* -6.352*** -5.761*** -5.928*** -6.327*** *p<0.05, ***p<0.001
Mass media exposure and weight-loss adver tising attitude scale
This study also analyzed the relationship between students’ attitudes toward weight-loss advertising and the students’ levels of media exposure. Mass media identified in this study included these six: television, television shopping channels, radio, magazines, newspapers, and the Internet. This study split television shopping channels and regular television into two separate categories because there are several T. V. channels (usually three, depending on the area) which heavily market health services and products (weight-loss machines, juice makers, diet foods, etc.). Levels of media exposure were defined by the numbers of hours per week watched (or listened to), as self-reported by the subjects. Table 6 shows the correlation matrix of six levels of media exposure and five subscales of WAAS for junior high and senior high students, respectively. It was found that junior high students’ television, magazine, and Internet exposure hours correlated positively with the mean scores of the attraction, form and manner, beautiful models, and topics of discussion subscales at significant levels. Television shopping channel exposure had a significantly positive correlation with the attraction, form and manner, and beautiful models subscales. On the other hand, senior high students’ television exposure was positively correlated with the mean scores of the attraction and beautiful models subscales; TV shopping channel with the attraction and the form and manner subscales; and magazines with the attraction and topics of discussion subscales.
Table 6: Correlation matrix of media exposure and WAAS subscales by grade level
Attraction Form and manner Beautiful models Perceived persuasion Topics of discussion Junior high Television 0.072** 0.070** 0.097** 0.032 0.057* TV shopping channel 0.065** 0.084** 0.054* -0.004 0.028 Radio 0.057* 0.033 0.036 0.011 0.029 Magazine 0.098** 0.116** 0.075** -0.020 0.090** Newspaper 0.002 0.026 -0.016 -0.005 0.004 Internet 0.083** 0.094** 0.054* 0.013 0.064** Senior high Television 0.071* 0.046 0.072* -0.018 0.054 TV shopping channel 0.097** 0.072* 0.048 -0.029 0.040 Radio -0.013 -0.042 -0.020 -0.066* 0.024 Magazine 0.082** 0.025 0.049 -0.002 0.081** Newspaper 0.066* 0.053 0.038 -0.027 0.101 Internet 0.027 -0.018 0.003 0.008 0.065*
Discussions
The results of this study reveal that, among the five aspects of high school students’ attitudes toward weight-loss advertising in the mass media, the highest degree of agreement was on the perceived persuasion aspect, followed by the beautiful models and attraction aspects. The lowest degree of agreement was on the form and manner. This tells us that female high school students in Taiwan recognize that weight-loss advertising indeed persuades people to have a “good” (i.e. thin) figure and seeks to sell weight-loss products. Students also agreed in general that at least some people are persuaded by these advertisements to try to lose some weight. These findings likewise show that Taiwan’s media-savvy youth indeed realize the major goal of advertising. The students agreed that models, especially the female ones, were portrayed beautifully, confidently, and the youth pay close attention to the models’ shapes/photos. In contrast, there was a slight but general disagreement with the statement that the weight-loss methods presented in the ads were really true, effective, or sensational. As Richins (1991) stated, there is a general complaint that advertising presents an unrealistic or idealized picture of people and their lives. The subjects in this study seemed to realize that not all messages in the weight-loss advertising were real or true. The present researcher speculates that the weight-loss messages may not really affect the viewers’ cognition, but beautiful models may touch their hearts. Myers and Biocca (1992) concluded that the mass media’s portrayal of the thin, ideal female body is already well documented. This study further reveals that high school students indeed to pay attention to these media’s beautiful portrayals.
Grade level seemed to play an important role in differentiating the five aspects. On all five subscales, female senior high school students had more positive attitudes toward weight-loss advertising than did junior high students. This may be due to their greater sophistication and age; that is, they may pay more attention to health-related issues, take better care of their bodies, or better identify with the models who are usually female adults. Another possible reason is that the high school students’ attitudes may be shaped by their subculture, since many agreed that weight-loss advertisements are topics to discuss with others. Moreover, senior high school students in Taiwan are generally more independent than are junior high students; therefore, they may have more time and pocket money to spend on various aspects of their lives, including weight-loss products (so-called weight-loss creams, soap, diet foods/teas, or medicines such as Zenical).
While investigating the relationships among mass media exposure levels and different weight-loss attitudes, a positive correlation between the two was found. It was also noted that grade level contributed to the difference. Generally speaking, junior high students’ media exposure was positively correlated with more aspects of weight-loss attitudes. For example, the more exposure junior high students had to television, television shopping channels, radio, magazine, and the Internet, the more they were attracted to the weight-loss advertising, the more they believed the advertising was true, effective, and sensational, and the more they paid attention to the beautiful models. Interestingly, in contrast, the correlation for senior high students was weaker in many aspects. As mentioned above, generally speaking, senior high students had more positive attitudes toward weight-loss advertising than did junior high students. Therefore, it is concluded
that mass media exposure contributes less to senior high students’ attitudes toward weight-loss advertising. Some other mediating factors such as the message in advertising (e.g., Byrd-Bredbenner & Grasso, 2000), these students’ dissatisfaction with their own bodies compared with the ones portrayed in the commercials (e.g., Richins), and the gap between their actual weight and wishful weight (e.g., Botta, 1999), may also play important roles in the relationship between their mass media exposure and attitudes toward weight-loss advertising.
It is interesting to note that there was almost no relationship between all kinds of mass media exposures and the students’ perceived persuasion, except for senior high students’ radio exposure. In other words, both junior high and senior high students fully realized the goal behind the messages delivered by these advertisements, regardless of the length of their exposure to the media.
Does more time watching T.V. and shopping channels, as well as reading magazines, lead to more positive attitudes toward weight-loss ads imbedded in mass media programming? Or do subjects who have more positive attitudes toward weight-loss advertisements spend more time engaged with these media? Either way, it seems clear that high school students who have ample exposure to mass media (T. V., TV shopping channels, and magazines in particular) have more positive attitudes toward weight-loss commercials delivered by these media. Nevertheless, further research is needed.
As Byrd-Bredbenner and Grasso (2000) said, the potential effects of television advertising on knowledge, attitudes, and behavior have generated considerable concern. This study claims that not only television, but also other mass media vehicles such as magazines, newspapers, the Internet, and television shopping channels all have great impact on adolescent girls’ attitudes toward weight-loss advertising and other health and identity issues. This study makes a small step toward addressing this concern by developing an attitude scale with validity and reliability checks. Perhaps future studies can use the scale and findings of this study to advance our understanding of the role of mass media in this crucial area.
Acknowledgement
This study was supported by the National Science Council, Taiwan, R.O.C., under Project NSC90-2511-S-009-002.
References
Botta, R. A. (1999). Television images and adolescent girls’ body image disturbance.
Journal of Communication, Spring, 22-41.
Byrd-Bredbenner, C., & Grasso, D. (2000). Health, medicine, and food messages in television commercials during 1992-1998. Journal of School Health, 70(2), 61-65.
Cash, T. F., & Henry, P. E. (1995). Women’s body images: The results of a national survey in the U.S.A. Sex Roles, 33, 19-28.
Chou, C. (2002, August). Adolescents’ mass media exposure, attitude, and knowledge of body fat. Poster presented at 110th American Psychology Association Annual
Freedman, R. J. (1984). Reflections on beauty as it relates to health in adolescent females.
Women and Health, 9(2/3), 29-45.
Myers, P. N., & Biocca, F. A. (1992). The elastic body image: The effect of television advertising and programming on body image distortions in young women. Journal of Communication, 42(3), 108-133.
Posavac, H. D., Posavac, S. S., & Posavac, E. J. (1998). Exposure to media images of female attractiveness and concern with body weight among young women. Sex Roles, 38(3/4), 187-201.
Richins, M. L. (1991). Social comparison and the idealized images of advertising.
Journal of Consumer Research, 18, 71-83.
Tiggemann, M., Gardiner, M., & Slater, A. (2000). “I would rather be size 10 than have straight A’s”: A focus group study of adolescent girls’ wish to be thinner. Journal of Adolescence. 23, 645-659.
Wertheim, E. H., Paxton, S. J., Schutz, H. K., & Muir, S. L. (1998). Why do adolescent girls watch their weight: an interview study examining sociocultural pressures to be thin. Journal of Psychosomatic Research, 42, 345-355.