algorithms and software analytics of the home-based urinalysis system are presented. Section 5 contains the result and analysis of the home-based urinalysis system design. Finally, the project's conclusions and future aspirations are given in Section 6.
2 Survey of Existing Solutions
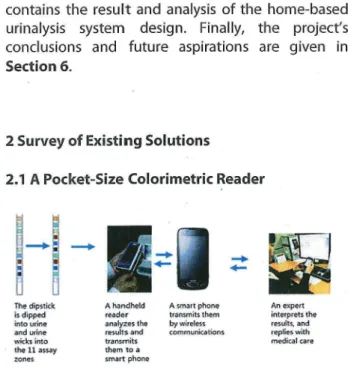
2.1 A Pocket-Size Colorimetric Reader
The dipstick is dipped into urine and urine wicks into the 11 assay zones --+ A handheld reader analyzes the results and transmits them to a smart phone A smart phone transmits them by wireless communications Ao expert interprets the results, and replies with medical care
Figure 7: Data transfer from the colorimetric analyzer made by
KA/ST researchers
Korea Advanced Institute of Science and Technology (KAIST) researchers have created a pocket-sized colorimetric reader for dipstick urinalysis [3]. By utilizing charge-coupled device (CCD) camera, a small digital camera with high image capture resolution, multiple color pads on the dipstick paper can be distinguished accurately, thus enabling a more accurate health screening and diagnosis. This invention is capable of detecting 11 parameters in dipstick paper, which include measurement substances such as glucose, protein, nitrite, pH, and bilirubin. Data obtained through this portable device can be sent to a smartphone through Bluetooth connection and later be consulted with a doctor. Although the device is portable and improves the accuracy of home-based urinalysis, patients still have to perform urine collection and apply the dipstick paper to the urine solution by themselves before analysis . can be performed.
2.2 Robust Dipstick Urinalysis using a low-cost micro-volume slipping manifold and mobile phone platform
Figure 2: Home-Based urinalysis system, made by Stanford biomedical optics group
A different approach to home-based urinalysis device was taken by a group of researchers at Stanford University. Instead of using a CCD camera, they utilize a smartphone camera [2]. A dipstick paper is first inserted into their device. Afterwards, prepared urine sample by patients has to be carefully spread in a specific area of the device. The device then automatically performs dipstick urinalysis by exposing the dipstick paper to the urine sample through swiping. Changes in reagents' colors are analyzed from the image taken by the smartphone's camera. Finally, the urinalysis result is shown directly on their smartphones. Even though patients do not have to dip the dipstick paper into their urine, they still have to collect their urine samples manually, which is still inconvenient.
2.3 Using Digital Filters to Obtain Accurate Trended Urine Glucose Levels from Toilet-Deployable Near-Infrared Spectrometers
On the contrary, instead of creating a portable device, researchers at Medic Life, a US-based company working on developing a smart toilet, installed their fully automated urinalysis system in the toilet bowl [5]. Rather than using dipstick urinalysis, they are using infrared sensors. When patients urinate to the toilet bowl, the infrared light source will transmit infrared signal that hits the urine. Afterwards, reflected infrared signal will be analyzed by the spectrometer, a device that measures light intensity. Depending on the intensity of light reflected, existence of substances inside the urine, such as glucose or ketones, can be identified. Although this approach simplifies the whole urinalysis process by not requiring patients to collect their own urine samples, the infrared sensor used in the project costs as much as USD$2,499 [6], whereas a single dipstick paper only costs USD$0.8. Moreover, in order to use this system, patients have to replace their whole toilet system, thus reducing its practicality.
·=--=· ---
-Figure 3: Optical home-based urinalysis installed in toilet bowl
2.4 Urine color change as an Indicator of Change in Daily Water Intake : A Quantitative Analysis
Hydration is one important parameter which can be used to measure the health of a person. By keeping the body hydrated, diseases such as chronic kidney diseases, diabetes type-II, kidney stone, and other malignant diseases can be prevented. Since there exists a strong correlation [6] between the 24-hour urine color difference and daily water intake difference, by obtaining several data points of daily water intake from the user, a predictive model can be devised to track and provide suggested daily water intake for the users. By performing daily monitoring, health prediction based on hydration level can also be performed. In order to do so, the 8 shades of urine color guideline is used in this research.
1 2 3 4 5 6 7 8
AM I HYDRATED?
Urine Color Chart
Jfyour urine matches these color~.
)'OU are drinking enough fluids
Drink more wal'er to get the ideal color in Shndc I and 2.
Dchydraled
You mar.surrcr front cramps Rl?d. hear-related problem~
llealth risk! Drink more water.
Health risk! Drink more \vater.
Health risk! Drink more water. lkalltt risk! Drink more water-. Figure 5: Formula to calculate approximate daily water intake
differences
By categorizing and tracking daily urine color with respect to figure 5, approximate difference in daily water intake can be measured. The relation of 24-hour urine color difference and water intake difference can be seen from figure 6.
2.5 The CIELAB Color System
The CIELAB color space is a color system introduced by Commission internationale de l'eclairage (French for International Commission on Illumination) in 1976 [8]. It consists of three dimensions:
1. 'L' stands for lightness. L=O represents black and L=100 represents diffuse white
2. 'a' describes color measurement from green to magenta. Negative value represents green while positive value represents magenta
3. 'b' describes color measurement from blue to yellow. Negative value represents blue and positive value represents yellow
The CIELAB color system is specially designed to describe all the colors visible to the human eye and was created to be a device-independent model to be used as a reference.
The gamut (all possible subsets of color) of this color system is larger than that of the majority of computer displays and printers, which usually utilizes the sRGB color system.
-a
Green
White I
Black
Figure 7: The C/ELAB Color Space Diagram
+a
Red
The CIELAB color system is fully mathematically defined. In order to convert a color data point from RGB to CIELAB format, we employ the following forward transformation:
X
=
0.412452 * R+
0.357580*
G+
0.180423*
B Y = 0.212671 * R + 0.715160 * G + 0.072169 * B Z = 0.019334 * R+
0.119193*
G+
0.950227*
BEquation 1: Converting RGB toXYZ
2. Convert (X, Y, Z) data point to (L, a, b)
Where:
L
=
116J(i,,) - 16
a
=
500(/(fn) -f( [,, ))
b = 200(/(
in) - !<in ))
Equation 2: Converting XYZ to C/ELABXn = 95.047 Y n = 100.000 Zn = 108.883 f(t) =
-yr
if t > &3 , 3~2 +~otherwise & =z\
Equation 3: Constant Definitions
2.6 Interpretation of Urine Dipstick Results
Based On Color Similarity Using Linear
Interpolation Curve Fitting
A research project [7] developed a software
product which utilizes linear interpolation curve
fitting algorithm to measure the color similarity of
_ urine dipstick results. The system works as follows.
Initially, a mobile phone captures the dipstick paper after being dipped into urine. After acquiring the captured image, a special computer software will accurately calculate the color distance between the captured image and the provided reference data of
the dipstick paper. From this distance, accurate
quantification of chemical substances inside urine sample can then be calculated. Overall, the system performs with a high level of accuracy and provides an affordable solution for people in less developed areas. However, the system lacks automation, a patient still needs to manually dip the dipstick paper into the urine and capture image manually using his / her own mobile phone camera. This is prone to error and the test result may not be consistent.
The Linear Interpolation Curve Fitting
Algorithm works as follows:
Figure 8: Diagram ofTest and Reference Data
1. Convert the color space of the test data and all
reference data from RGB color space to CIELAB
color space as explained in section 2.4. For
every two adjacent reference data, calculate the Euclidean distance. Distances between the test
data and each reference data are also
calculated. The formula of Euclidean distance is
given as:
d
=
~
(L1,;;r - Lrejl + (a;m - aref}1+
(btE;t - b,ef)1Equation 4: Euclidean Distance Formula
2. A point in reference data which has the closest
distance to the test data is chosen and labeled as 'n'.
a. If 'n-1' is 0, node number n is chosen as
node 'B' and the node n+ 1 is labeled as
'C'. After that, proceed to step 4.
b. If 'n+ 1' overshoots the number of
reference data, this means node n is
located on the last level. Node n is labeled
as node 'C' and 'n-1' as 'B'. Proceed to step
4.
c. If none of the status is achieved above,
the target node is located between two nodes. Proceed to step 5.
3. Calculate the Euclidean distance between test
data and node 'C'. if the distance is longer than
the distance between node 'B' and 'C'. We
regard this test data as an error. The algorithm
stops here.
4. Calculate the Euclidean distance of test data to
node 'n-1' and the distance of test data to node
'n+ 1 '. Note the shortest node and store it into a variable.
5. If the chosen node from step 4 is node 'n-1 ':
calculate the Euclidean distance of test data to
node 'n-1 ', if it is smaller than the distance from
'n-1' to 'n', denote 'n-1' as 'B' and 'n' as 'C'.
6. If the chosen node from step 4 is node 'n+ l '.
Calculate the Euclidean distance of test data to
node 'n+ l '. If it is smaller than the distance of
node 'n+ 1' to 'n', mark 'n+ 1' as 'C' and 'n' as 'B'.
7. If both conditions listed in step 5 and 6 are not
completed, the test data is regarded as an error.
8. The figure below shows the relationship of test
data, node 'B' and node 'C':
B C
~
testA
Figure 9: Relationship Diagram of Nodes
9. The score of the tested reagent can be
Final score= (~ x (Score C - Score B))
+
Score B Equation 5: Final Score Prediction· Formula3 Overview of Technology Design
We designed and implemented a home-based urinalysis system for fully automatic urine collection and analysis including dipstick testing to analyze the existence and concentrations of biomarkers inside urine such as glucose as well as urine color can be performed seamlessly.
The implementation of our automated
home-based urinalysis device involves the
integration of several electronics sensors,
microcontrollers and actuators. As shown in Figure
10, the urine sample collector initially collects a urine sample from a patient unobtrusively. By utilizing a peristaltic pump, the main device retrieves the urine sample and drops it onto a pre-destined cartridge area with dipstick paper attached. The process is then followed by analyzing color gradient change with the dipstick pad by using a camera image as an input. Urinalysis result is then displayed on an LCD monitor and transmitted through Bluetooth to the Android app. Finally, the mobile app sends the test result to the remote server through internet. The
internet-connected remote server makes the
transmitted urinalysis data available to be accessed
on the patient's Android mobile devices. The remote
server performs various analytics measure and
personalized recommendation system which is delivered back to the app.
~ Kamoer Pump -HC-06 Stepper Bluetooth Motor C ll
OV9655 ANAtYSES Urine
Glucose Camera Color
Figure 70: The Overall System Diagram
3.1 Urine Sample Collector
Urine sample collector is an object in our home-urinalysis system used to collect urine sample directly when the user urinates. The device is designed with the goal to unobtrusively collect urine sample with minimum contamination. The device is also compatible with modern and diverse toilet bowl model. In addition, the urine sample collector needs to have an opening collection area that is easily targeted during urination process, regardless of the user's gender. The urine collected will be transported to the urinalysis device through biocompatible tube,
where the tube opening is positioned near the
collection area.
3.2 Urinalysis device
The main device serves as the main hub of our system. It transports urine sample from the
collector and analyzes it before sending the result to
the mobile app. It consists of several embedded devices interconnected to each other. Each of the
device is connected using various protocols and serves different purposes. In here, STM32F4 micro-controller serves as the main control which is used to programmatically command other devices such as:
1. Peristaltic pump for transporting urine
2. Bluetooth module for connection with the
mobile app
3. Camera for analyzing the urine
4. LCD display for displaying essential information while doing the urine analysis 5. Stepper motor for rotating the dipstick
cartridge
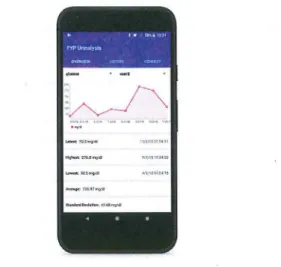
3.3 Companion App
The Android-based app connects to our device seamlessly using Bluetooth and provides a convenient tool for users to see their health trends
with a user-friendly visualization. It also provides users recommendations on how to improve their heglth, for instance: suggested extra water intake.
The app is also connected to a remote server
by internet. The remote server hosts all the analysis
history and performs various analytics measure and personalized recommendation system which is then delivered back to the app. The server is coded in Python programming language, specifically using
the Django REST Framework.
l> t• u...1011 FYPUnnalysls
O~tl»'ICN ,,,en ce,n:~
:
A
"
/'v,-1
',
·~:!"'-'' ,;.~ ·.,,,. t;,.,, ~:;;;;: ~ . ..-,;; ;;".
Figure 7 7: Our In-house developed Android App
4 Analytics Based on Home-Based Urinalysis
System
Mature and reliable analytics for real-time
home-based urinalysis system is crucial. As the
system designed in this project relies heavily on
image analysis or colorimetric to analyze the change
of color on dipstick paper and the collected urine
color, proper selection of algorithms and appropriate color system are necessary.
4.1 Usage of CIELAB Color System
The raw data produced by our device's
camera is in RGB (Red-Green-Blue) format. RGB color
system is not suitable for our project because the
RGB color system is platform dependent. This means
the perceived dipstick paper color by human eyes may be different from what the camera perceives. Moreover, the RGB color system is easily interfered
by environmental lighting [8]. Based on these
reasons, we decided to convert the device camera
output format from RGB to CIELAB with the formula
explained in section 2.4. The result of this method
will be elaborated in section 5.
4.2 Usage of Linear Interpolation Curve Fitting
Algorithm and Improving Its Accuracy
The Linear Interpolation Curve Fitting
Algorithm explained in section 2.6 is utilized in our
system to predict the amount of glucose substance
from the dipstick paper and color of the urine. The
algorithm performs with a relatively high level of
accuracy. The difference between the predicted
amount and manual eyeball checking is nearly
negligible.
However, the algorithm does not factor in
the duration of dipstick paper being exposed to the
urine. From our findings, different duration will yield
different predicted output. To cope with this
shortcoming, we propose an extra algorithm on top of the Linear Interpolation Curve Fitting Algorithm. We call this the 'Gradient Change Algorithm'.
The Gradient Change Algorithm works as follows:
1. Within 30 seconds of the entire read-out time
(as suggested by the instruction of our dipstick
paper's brand "Macherey - Nagel"), capture the
dipstick paper color and predict the amount of substance using the Linear Interpolation Curve Fitting Algorithm. Do it every 6 seconds interval. Finally there will be 5 different predicted result in 5 different timestamps.
2. For every subsequent data point, calculate the
gradient using the following formula:
gradient,,= (substance11 - substancen-i) + (tn -
t
,,
_
)
Equation 6: Gradient Calculation Formula
3. Pick the lowest gradient, denote it as gradient 'n' and use the predicted amount with timestamp 'n-1' C ::, 0 55 -~ 50 ., V
"
t!
'§ 45 "'~
~ 40 0.. 35Analyzing Gradient Change to Improve Accuracy
0 3 4
Time stamp
Figure 12: The Visualization of 'Gradient Change' Algorithm
4.3 Urine Color and Water Intake Case Study
In order to correctly implement a
home-based urinalysis system that is capable of not only
analyzing the biomarkers contained inside it but also
the hydration level of the user, a study regarding the variation of daily urine color is needed. However,
since there is little to none publicly available urine
color data published online, 40 days of personal urine data from the three team members of the
project were collected twice a day and analyzed. To
simplify the analysis process, we collect two data points: the first urine sample in the morning and last
urine sample before sleeping.
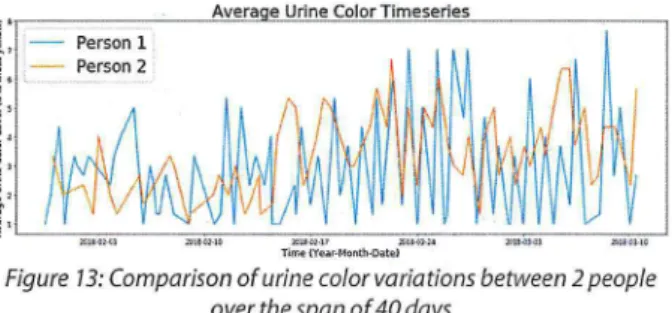
From figure 13, it can be seen that different
people with different habits would have different
variation of daily urine-color. In order to provide
meaningful and accurate suggestion on water intake
to the user, a generalized solution is not an option.
There is a strong need to provide a personalized
suggestion and which in turn requires a personalized
urine analysis system.
j'·y--~~~-'----"A~ve"-'.'ra'!l'-e"-'U!'.!.ri~ne~c,_.,,01'."!or:.1.T!'!im~es~enr_l!'·e~s~ - ~ ~ ~ ~ ~
t, : - Person 1 ,
_
!
,
;
-
Person 2;
)
~ ~ ~ l ; ' ~ i''---;;;,.;;;-~,;;;:;;;;---=--,~ ___:_----;;-;~_:__:;,,:_:__...:__....'...JFigure 13: Comparison of urine color variations between 2 people
over the span of 40 days
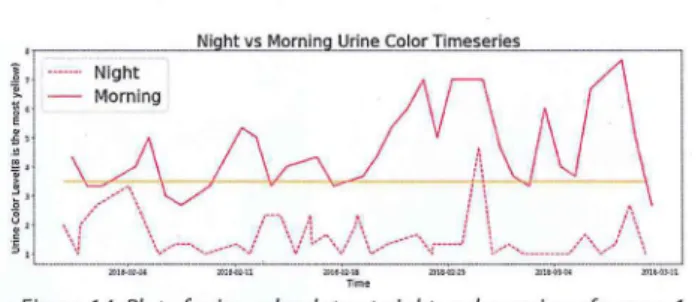
In-depth analysis of person 1 's urine data is
performed by separating the color data of the urine
collected in the morning and at night. Plot of the
\l
Ni ht vs Momin Urine Color Timeseries
J 1 ••••••• Night ~ - Morning
~ ~
'
Figure 14: Plot of urine color data at night and morning of person 1 According to the 8-shades of urine color
universally used in medical area, if a person's urine
color is classified with a value more than 3, then that
person is dehydrated. In figure 14, the boundary
decision between being dehydrated or not is marked
by orange line. Nevertheless, the information
whether a person is dehydrated or not may be
uninformative since that person does not know how to adjust their water intake according to their present body condition.
Since the (mean, variance) of both morning
and night urine data are close, (4.33, 4.67) and (1.33,
1.56) respectively, it can be seen that the personal
urine data is not too skewed. Furthermore, the
var/mean value of both morning and night urine
data are about the same, 0.42 and 0.39 respectively.
This means that the daily urine variations at night
and in the morning of the same day are about the
same. This is important as it means that in the long
run, hydration level analysis can be done by using
either the morning urine data or the night urine data,
making it more practical for real-life use case.
Implementing the formula that approximates
the difference in daily water intake from section 2
suggested that extra water intake per day can be calculated. Currently, the analysis is done based only on the comparison of 24-hour urine color in the
morning. In figure 15, Positive value means that the person drinks more water during that day compared
to the previous day and negative value means that the person drinks less water during that day compared to the previous day.
1c1oci
~~l
-l
~1
Dailv Water Intake Difference
I
I
I
I
II
II
II
Ill
1•
-
1
-
1• I
I II II
1••11-···111
l l J ~ l I > I t 1'I Il U II ,t ll U 11 ii It :!!l 21 Zl U JI D :lll 11 II Z, JO II Ii !I M !) JI I> li lt .;,
o,y
Su ested Extra Water Intake er Da
=
1
LhUull
ml,· 11 , • ~•I ,,~u~ll1'U~o~1111-•~•-• •_•_ui11n11nJO•vn~~J11>1t1t~ °''
Figure 15: Approximation of suggested water intake per day
Focusing more on the days where the person
drinks less water, the home-based urinalysis system
is able to provide suggestion on the extra water
intake that person needs to take daily.
5. Result & Evaluation
A complete fully automatic home-based
urinalysis system has been successfully implemented
from scratch with multiple design iterations. The
system consists of two main sub-systems: the
physical device that collects urine and the software
on the main device which tracks and analyzes the
data obtained from the physical device.
The urine collector is designed and 30
printed such that it can be easily integrated in any
toilet's design for both male and female users. It will
be elaborated in section 5.1.
To achieve high accuracy for urinalysis, our
main device has to be able to withstand different
lighting conditions. This will be further explained in
section 5.2 and section 5.3.
5.1 Urine Sample Collector result
Throughout this research, the urine sample
collector has undergone two major design iterations.
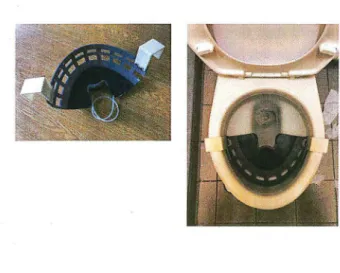
The original urine sample collector, shown in Figure
16, was modified from a commercial urine collector by inserting an opening from the bottom. The
collector can be installed in various toilet bowl
models and easily collect urine from users regardless
their gender. Nevertheless, the first urine sample
collector model covers most of the toilet bowl
surface when installed. This implies that users have
to take off the collector before defecation and set the
collector back to its original position before redoing
the urinalysis test.
Figure 16: Original urine sample collector (left) and when it's installed in toilet bowl (right)
The troublesome setup process triggered our
motivation to redesign it which led to the second
urine sample collector model with the goal of one
model consists of three main parts, the collector structure and two support structures. As shown in Figure 17, the collector structure is a protruding concave object placed on the inner wall of the front of the toilet bowl. This collector is specifically designed for both male and female users. The
process works as follows. First, a small amount of urine will be collected and analyzed automatically. The flushing of the toilet would also automatically clean the urine collector. Nevertheless, despite the independence of this design, the structure might not be compatible for all toilet designs due to its fixed curvature.
Figure 17: Second urine sample collector model (left) and when it's
installed in toilet bowl (right)
This limitation is further overcome by the third model which is designed to be more versatile and compact. The third model, shown in Figure 18, features an adjustable toilet rim holder and collector structure. The flexible design of the toilet rim holder enables it to clamp against diverse toilet bowl designs. Unlike the previous iteration model, the
third urine sample collection structure is independent from the toilet bowls' curvature and can be easily installed at the center of any toilet bowl
rim. The smaller urine collection structure also implies that this design requires more attention from
its users as they have to aim their urine drop. Moreover, we have conducted a case study for both male and female usage. While both genders express concerns regarding the urine collection area being relatively small, it is generally still feasible for them to
target their urine into the collector.
Figure 18: Third urine sample collector model (left) and when it's
installed in toilet bowl (right)
5.2 Urinalysis Accuracy Result
By integrating our methods described in Section 2.5, 2.6 and 4.1, we achieved a relatively
high accurate reading of the dipstick paper color. Our device's reading accuracy is comparable to a manual dipstick testing.
Figure 19: Reference Colors From Our Dipstick Paper's Manufacturer
STATUS
:
CLEAN P
UM
P
9
L
:
47
.
7
6
A
:
- 12
.
26
B
:
5
.
93
glucose sco
r
e
:
12
9
.
01
Figure 20: The Predicted Substance Value From Our Novel Device
5.3 Environment Lighting Change
Performance Result
Our system's performance is relatively robust to environmental lighting change. By doing the
reading in the CIELAB colorspace (as described in section 2.5), as opposed to RGB, the value of the color reading from each color level in the reference data changed less given two highly distinct lighting environments. From the figures below, we slashed the margin of reading error by -73%.
-~-r
L A BL. h . i With
I
Light is With I Light is WithLevel ,g t,sl Bright fl Bright I fl Bright fl
absent i LED absent
LED I absent LED
1 68.28 J 65.08 3.2 -1.48 -2.91 1.43 4.13 8.35 4.22 2 65.28 I 61.22 4.06 -1.49 -7.36 5.87 4.16 11.68 7.52 3 I 68.08 1 62.37 5.71 -2.89 -2.38 0.51 8.27 17.95 9.68 4 I 61.09 i 61.2s 5.84 -8.57 -8.86 0.29 15.62 29.53 13.91
I
S
I 63.08 I 52.51 10.57 0.83 -6.76 7.59 19.04 39.45 20.41 6 62.92 I 53.27 I 9.65 -0.24 -3.15 I 2.91 23.26 40.51 17.25 7 58.63 I 47 .84 ' 10.79 7.63 1.16 6.47 21.82 42 20.18 I 8 s3.11L
43.9 ~ 0.03 -1.74 1.77 23.99 37.34 13.35l~
~=~;Tne
_
--- _7.4537~ --· ---- _ ___ l}J( ·---· 13.31~ R G I B .I Level L,g t ,s Bright . h . With ti L. h . ,g t IS Bright With ti
I
!L. h ,g t IS . Bright With- I i ti ! absent LED absent LED !absent LED 1I 1 167 167 o 175 , 167 8 I 167 151 16 I 2 167 143 24 167 151 16 ' 159 119 40 ! i - -3--+---175 143 32 ·175 143 ~32--+·159··-~,1,-- 48 i I 4 159 151 8 1 167 151 16 I 135 95 -~ ---; ! 5 167 143 24 159 135 24 I 119 63 56 6 167 135 32 151 i 127 24 i 111 47 64 7 167 135 32 135 ' 111 24 ! 95 39 56 ! f···8···--···143_1109 ____ 34 __ j 12]_! ____ 103 .... 24_l_Y5.I 39 56
L
A
~:;~fne
23.251 21 I ~;[Figure 2 7: Comparing C/ELAB to RGB Under Two Distinct Lighting Environments
6 Conclusion
In the project, we demonstrate that a frilly automated home-based urinalysis system with lab level accuracy is feasible. In our experiments, the accuracy of dipstick testing has been evaluated. The system we designed and implemented, which consists of a device to perform the urinalysis and an app for users to keep track of their urine data, can be easily integrated into users' daily lives. In addition to performing dipstick testing, hydration level can also be analyzed to provide suggestion for the users on
how much water intake they should take daily which is very important to prevent chronic diseases such as
CKD (chronic kidney diseases) and diabetes type-II. From analysis results of the team members' urine collected in 40 days span, it was observed that different people have different variations of daily hydration level and this in turn highlights the value of having a personalized urinalysis system to fend chronic diseases. In the future, with more data and further improved hardware, even more insightful and accurate analysis for users' health tracking and even future health prediction could be achieved.
References
[1] J. C. Eric Thomas, "Urine collection and processing for protein biomarker discovery and quantification",
Cancer Epidemiology, Biomarkers & Prevention: A
Publication of the American Association for Cancer
Research, Cosponsored by the American Society of
Preventive Oncology, vol. 19, no. 4, p. 953, 2010.
[Accessed: 23-Aug-2016].
[2] G. Smith, N. Dwork, S. Khan, M. Millet, K. Magar, M. Javanmard and A. Ellerbee Bowden, "Robust dipstick urinalysis using a low-cost, micro-volume slipping
manifold and mobile phone platform,"Lab Chip, vol. 16,
no. 11, pp. 2069-2078, 2016.
[3] D. Lee, B. Jeon, C. Ihm, J. Park and M. Jung, "A simple and smart telemedicine device for developing
regions: a pocket-sized colorimetric reader", Lab Chip,
vol. 11, no. 1, pp. 120-126, 2011.
[4] C. sample, "Clean catch urine sample: MedlinePlus Medical Encyclopedia", Medlineplus.gov,
2017. [Online]. Available: https://medlineplus.gov/ency/article/007487.htm. [Accessed: 04-Nov-2017].
[5] H. Kim and D. G Allen, "Using Digital Filters to Obtain Accurate Trended Urine Glucose Levels from Toilet-Deployable Near-Infrared Spectrometers",
Openaccessjournals.com, 2017.
[Online].Available:http://www.openaccessjournals.com / scholarly-a rtic I es/using-dig ita 1-fi lte rs-to-obtain
-accu rate-trended-u ri n e-g I u cose-1 evels
-fromtoi letdeploya ble-nearinfra red-spectrometers
-2155-9872-1000338.pdf. [Accessed: 04-Nov-2017].
[6] E. Perrier, E. Johnson, A. McKenzie, L. Ellis and L. Armstrong, "Urine colour change as an indicator of change in daily water intake: a quantitative analysis",
NCBI, 2018. [Online].
Available:https://www.ncbi.nlm.nih.gov/pubmed/2628 6348. [Accessed: 29-Mar-2018].
[7] R.Tiara Shanty, R. Hari Ginardi and R. Sarno, "Interpretation of urine dipstick results based on color similarity using linear interpolation curve fitting", 2013 IEEE International Conference on Computational Intelligence and Cybernetics (CYBERNETICSCOM), 2013.
[8] CIE (Commission Internationale de l'Eclairage), Recommendations on uniform color spaces, color difference equations, psychometric color terms.
Supplement No.2 to CIE publication, Paris Cedex 16, Paris, France, 1978, 68: 1791