Fundamental Frequency Estimation Based
on the Joint Time-Frequency Analysis of
Harmonic Spectral Structure
Der-Jenq Liu and Chin-Teng Lin, Senior Member, IEEE
Abstract—In this paper, we propose a new scheme to analyze
the spectral structure of speech signals for fundamental fre-quency estimation. First, we propose a pitch measure to detect the harmonic characteristics of voiced sounds on the spectrum of a speech signal. This measure utilizes the properties that there are distinct impulses located at the positions of fundamental frequency and its harmonics, and the energy of voiced sound is dominated by the energy of these distinct harmonic impulses. The spectrum can be obtained by the fast Fourier transform (FFT); however, it may be destroyed when the speech is interfered with by additive noise. To enhance the robustness of the proposed scheme in noisy environments, we apply the joint time-frequency analysis (JTFA) technique to obtain the adaptive representation of the spectrum of speech signals. The adaptive representation can accurately extract important harmonic structure of noisy speech signals at the expense of high computation cost. To solve this problem, we further propose a fast adaptive representation (FAR) algorithm, which reduces the computation complexity of the original algorithm by 50%. The performance of the proposed fundamental-frequency estimation scheme is evaluated on a large database with or without additive noise. The performance is compared to that of other approaches on the same database. The experimental results show that the proposed scheme performs well on clean speech and is robust in noisy environments.
Index Terms—Adaptive representation, harmonic structure,
partial FFT, pitch contour, pitch measure, spectrum analysis.
I. INTRODUCTION
T
HE estimation of fundamental frequency is an essential component in a variety of speech processing systems such as the speech analysis-synthesis system and speech coding system [1], [2]. The contour of fundamental-frequency (i.e., pitch contour) also plays an important role in language commu-nication [3]–[6]. There are some difficulties in the estimation of fundamental frequency, although it can be observed by eye inspection. First, the voiced speech is not a perfectly periodic waveform because of the variation of fundamental frequency and the movement of vocal tract. Second, it is difficult to esti-mate the fundamental frequency of low-level voiced speech at its beginning and ending. Third, the performance of estimation will degrade when the speech signal is corrupted by noise.Manuscript received February 28, 2000; revised April 17, 2001. This work was supported by the National Research Council, R.O.C., under Grant NSC 89-2218-E-009-040. The associate editor coordinating the review of this paper and approving it for publication was Dr. Philip C. Loizou.
The authors are with the Department of Electrical and Control Engi-neering, National Chiao-Tung University, Hsinchu, Taiwan, R.O.C. (e-mail: william@falcon3.cn.nctu.edu.tw; ctlin@fnn.cn.nctu.edu.tw).
Publisher Item Identifier S 1063-6676(01)07431-4.
Several algorithms for the estimation of fundamental fre-quency, which may utilize the properties of speech signals in either time-domain or frequency-domain, or in both, have been proposed in [7]. Time-domain estimators operate directly on the speech waveform to estimate the pitch period. The measurements used include peak and valley measurement, zero-crossing and energy measurement, and auto correlation measurement. The class of frequency-domain estimators uses the property that if the signal is periodic in the time domain, then its spectrum will consist of a series of impulses at the fundamental frequency and its harmonics. The measurement for detecting the impulses is made on the spectrum of the signal. The class of hybrid estimators incorporates features of both the time-domain and frequency-domain approaches for pitch detection [8], [9]. The performance of these algorithms is good on clean speech, but degrades rapidly in noisy conditions. In this paper, we propose a new scheme to analyze the spec-tral structure of speech signals for fundamental-frequency es-timation. First, we propose a new measure, called pitch
mea-sure, to detect the harmonic characteristic of voiced sound on
the spectrum of speech signals. It is proved that this measure will not be trapped by the pitch-doubling or pitch-halving problems. The spectrum for analysis can be obtained by the fast Fourier transform (FFT); however, it may be destroyed when the speech signal is interfered with by additive noise. This will degrade the performance of our scheme based on the FFT-spectrum. To enhance the robustness of the proposed scheme in noisy envi-ronments, we apply the joint time-frequency analysis (JTFA) [10], [11] technique to find the adaptive representation of the spectrum of a speech signal. Adaptive representation [12], [13] flexibly decomposes any signal into a linear expansion of wave-forms which are selected from a redundant dictionary of func-tions. It selects the best matching elementary function in some optimal sense to approximate the signal we want. The inspection of the JTFA of a Gaussian-type function reveals that it is local-ized in time and frequency domains simultaneously such that the problem of cross-term interference [11] is reduced. Hence, we adopt the Gaussian-type functions as the dictionary to charac-terize the speech signal’s time-varying nature in adaptive repre-sentation. Since only important factors are used to represent the speech signal, the adaptive representation can accurately extract important harmonic structure from noisy speech signals. How-ever, this is achieved at the expense of high computation cost. To attack this problem, we further propose a fast adaptive represen-tation (FAR) algorithm, which performs partial FFT and reduces the computation complexity of the original algorithm by 50%. 1063–6676/01$10.00 © 2001 IEEE
610 IEEE TRANSACTIONS ON SPEECH AND AUDIO PROCESSING, VOL. 9, NO. 6, SEPTEMBER 2001
The performance of the proposed fundamental-frequency esti-mation scheme is evaluated on a large database with or without additive noise. It is compared to that of other approaches on the same database. The comparison results show that the proposed scheme performs well on clean speech and is robust in noisy en-vironments.
The organization of this paper is as follows. In Section II, we propose the pitch measure and study its properties on the speech spectrum. A pitch-tracking algorithm is also proposed in this section to identify continuous pitch contours and make voiced/unvoiced decisions. In Section III, we propose the FAR algorithm to obtain the spectrum of speech signals. The pitch measure is then applied to the FAR-spectrum to form a robust fundamental-frequency estimation scheme. In Section IV, six meaningful objective error measurements to evaluate the performance of a fundamental-frequency estimator are defined, based on which the performance of the proposed and compared schemes is evaluated. Finally, conclusions are made in Section V.
II. DETECTION OFHARMONICSPECTRALSTRUCTURE
A. Spectral Analysis
The production of voiced speech can be described by a linear system mathematically [14], [15]. We use to denote the Fourier transform of the impulse response of the vocal tract model . Because the excitation source for voiced speech is essentially a quasi-periodic train of pulses, its Fourier transform can be described as , by the Poisson sum formula, where is the period of the pulse, or is the fundamental frequency, and the delta function is the unit impulse function. The voiced speech signal is modeled in the time domain as the convolution of and . That is, , where is the convolution operator. Using the convolution property of Fourier transform, we have
(1) where is the Fourier transform of .
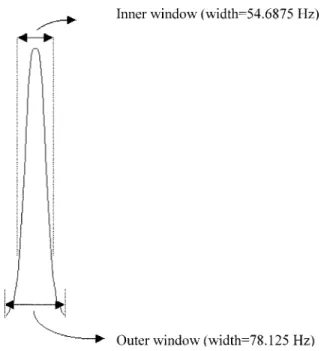
Equation (1) gives an important insight into the spectral struc-ture of voiced sounds; it is a linear combination of the impulses located at harmonics of fundamental frequency. If the harmonic spectral structure can be identified, the corresponding funda-mental frequency can also be obtained. The point to do this is to detect the distinct impulses at fundamental frequency and its harmonics. To detect a distinct impulse, we apply two windows, inner window and outer window, on an impulse, where the cen-ters of both windows are located at the center of the impulse. A distinct impulse as well as the two windows are illustrated in Fig. 1. The widths of the two windows in our study are deter-mined experimentally, as described in Section II-C. Based on these two windows, we define three basic indexes on an indi-vidual impulse:
1) inner energy, , the area
under the curve of spectrum bounded by the inner window;
Fig. 1. Obvious impulse with inner and outer windows.
2) outer energy, , the
area under the curve of spectrum bounded by the outer window;
3) total energy: , the total area under the curve of spectrum.
If there is a distinct impulse located at frequency , the values
of and will be very large.
Based on the above three indexes, we define three measures to identify the harmonic spectral structure of speech signals in the following.
• Energy Measure: The energy measure of a fundamental-frequency candidate, , is defined as
(2) subject to the constraint
for each (3)
where is the number of the harmonics of funda-mental frequency , and is a preset threshold. If a distinct impulse is located at some harmonic , the
value will be large. The constraint
in (3) means that only the harmonics with distinct im-pulses are considered in the calculation of the energy mea-sure. In other words, (2) measures the total energy con-centrated on the harmonics with distinct impulses of the fundamental-frequency candidate . The value of is set as 0.85 in this study as described in Section II-C. If
is a true fundamental frequency, the value of
will be quite large since the voiced-sound energy is dom-inated by the energies of distinct harmonic impulses. One good property of the energy measure is that it exists no pitch-halving problem; i.e., we always have
. However, the energy measure could lead to the confusion between and , i.e., the pitch-doubling problem. In other words, it could happen that
. The proof of these properties can be found in Appendix A.
• Impulse Measure: The impulse measure of a fundamental-frequency candidate is defined as
(4)
Equation (4) measures if there always exist distinct im-pulses on the harmonic positions of the fundamental-fre-quency candidate . If is a true fundamental frequency, the value will be close to 1 since a distinct impulse is always located on each harmonic. This situation does not exist on the frequencies other than the fundamental frequency and its harmonics in normal speech signals. In other words, a large impulse-mea-sure value can indicate the fundamental frequency or its multiples . Hence, the impulse measure ex-ists no pitch-doubling problem; i.e., we always have . However, might not be
the maximum over , . Hence, there
could exist confusion between and in the impulse measure (i.e., the pitch-halving problem); it might happen that . The proof for these properties is given in Appendix B.
The energy measure and the impulse measure , respectively, capture the two major characteristics of the harmonic spectral structure of voiced speech; there are distinct impulses at the harmonics of fundamental frequency, and the total energy is dominated by these distinct harmonic impulses. Since both of these two measures have large values at the true fundamental frequency simultaneously, we take the product of these two measures to form the final form of our measure for detecting the true fundamental frequency. This measure, called pitch measure, is defined as follows.
• Pitch Measure: The pitch measure at the fundamental fre-quency candidate, , is defined as
(5) The equation to estimate the fundamental frequency is
(6) It can be shown that the pitch measure does not have the pitch-doubling and pitch-halving problems (see Appendix C); in other
words, we always have and
for the true fundamental frequency .
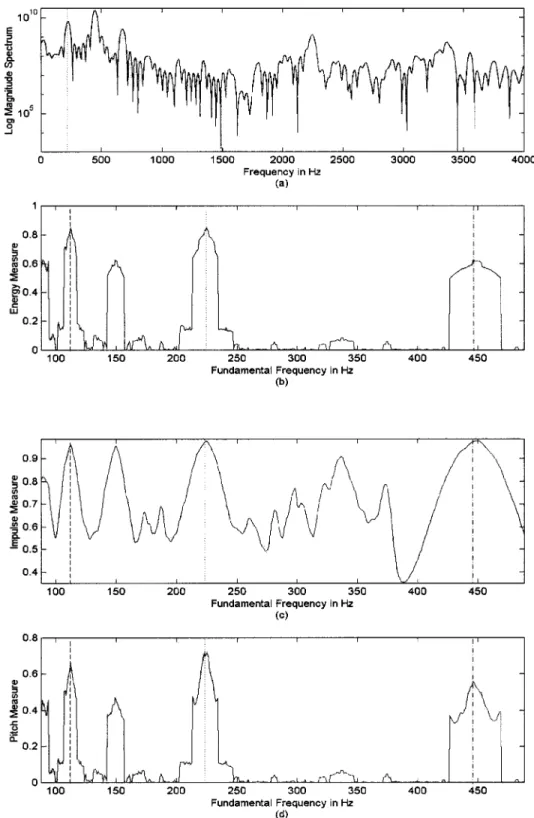
One example to illustrate the behavior of the above measures for fundamental frequency estimation on a speech segment is shown in Fig. 2. The fundamental frequency of the speech seg-ment shown in Fig. 2(a) is Hz. We observe that
in Fig. 2(b),
and in Fig. 2(c).
Hence, we have
in Fig. 2(d), and Hz is determined to be a true fun-damental frequency.
B. Continuous Pitch-Tracking Algorithm With Voiced/Unvoiced Decision
Applying the pitch measure in (5) and (6) on each frame of a speech signal, we can obtain the estimated fundamental fre-quency for each frame; whether it is voiced or unvoiced. A pitch-tracking algorithm is then utilized to obtain the contin-uous pitch contours and make the voiced/unvoiced decision. The algorithm utilizes the property that the pitch curve of voiced sound is continuous in local region. The steps of the proposed pitch-tracking algorithm are as follows.
Step 1) Pitch Detection: Apply the pitch measure in (5) and (6) to find the fundamental frequency of each frame of the input speech signal.
Step 2) Pitch Contour Search: For every two adjacent frames, check if the difference of their fundamental frequencies estimated in Step 1 is less than 12% of either one of these two frequencies, and check if the impulse-measure values of them are both greater than the threshold . If every two adjacent frames pass this checking, they form a portion of one pitch contour with the pitch of each frame being the reciprocal of the fundamental frequency estimated in Step 1. This step will produce a set of piecewise-continuous pitch contours.
Step 3) Continuity Detection: Check if the length of each pitch contour formed in Step 2 is greater than eight frames. If yes, it is recognized to be a continuous pitch contour; otherwise it is discarded.
Step 4) Pitch Doubling/Halving Checking: Track each con-tinuous pitch contour recognized in Step 3 by ex-tending it forward from its beginning and backward from its ending along the frames axis to see if there are pitch doubling or halving errors. If yes, the ex-tended frame with error is added to the current con-tinuous pitch contour, and its fundamental frequency is corrected by multiplying (for pitch doubling) or dividing (for pitch halving) the one estimated in Step 1 by two.
Step 5) V/UV Decision: If a frame is on a continuous pitch contour finally formed in Step 4, it is considered to be voiced; otherwise it is unvoiced.
In the above algorithm, the first checking in Step 2 is to make sure the piecewise continuity of a pitch contour, where the dif-ference “12%” is set by experience. The second checking for impulse-measure values is to make sure that the two adjacent frames are both voiced sound, where the threshold is set as 0.8 in our study, as described in Section II-C. The pitch contour with short length in frames may not be a voiced contour as de-tected in Step 3, where the minimum length of eight frames is set by trial and error. Although the fundamental frequencies of voiced frames can always be estimated by the pitch measure, there still exists the possibility of pitch doubling or halving er-rors, especially at the transition of voiced and unvoiced frames.
612 IEEE TRANSACTIONS ON SPEECH AND AUDIO PROCESSING, VOL. 9, NO. 6, SEPTEMBER 2001
Fig. 2. Illustrations of the proposed measures on one speech frame. (a) Spectrum of the speech signal, where the fundamental frequency! is labeled by the dotted line. (b) Energy measureR (!) on (a). (c) Impulse measure R (!) on (a). (d) Pitch measure R (!) on (a). The frequencies, ! =2; ! ; and 2! are labeled by dashed, dotted, and dash-dotted lines, respectively, in (b), (c), and (d).
Hence, the checking and correction of such errors are done in Step 4 to reinforce the smoothness of the obtained pitch con-tours.
C. Determination of Window Widths and Threshold Values
In applying the pitch measure and pitch-tracking algorithm, the widths of inner and outer windows ( and ), as well
as the thresholds in (3) and in Step 2 of the pitch-tracking algorithm need to be determined in advance. The widths should be chosen such that the energies of all distinct impulses on speech spectrum are included in the numerator of (2) while computing the energy measure at true fundamental frequency. The width should be greater than to the extend that the impulse measure approaches one while computing the impulse measure at true fundamental frequency. To achieve these goals,
Fig. 3. Flowchart of using the proposed pitch measure for estimating the fundamental frequency based on FFT-spectrum or FAR-spectrum.
we observe the 2048-point FFT-spectrum of a 16- kHz-sam-pled voiced speech signal from the prepared database. The ini-tial search value for is set as three points [equivalent to k Hz] by visual inspection, since the widths three points are smaller than the widths of main lobes of most distinct impulses on the spectrum. Starting from points and setting , we can calculate an average energy-measure value [denoted by ] by averaging the energy measures at true fundamental frequen-cies of all voiced frames for each points. It is observed that the average energy-measure value increases as increasing, and then saturates when is about 13 points. Hence, the search region for is from 3 to 13 points. To re-duce the search complexity, we set the ratio as ac-cording to visual inspection, since the width satisfying this ratio can cover most side lobes of a distinct impulse and exclude the side lobes of its neighboring impulses. In the search re-gion (3, 13) and with the ratio , we search for the and values such that the average impulse-measure value of the same prepared voiced frames is above 0.9. In this
way, we obtained points Hz, and
points Hz.
With these and values, the thresholds and are determined according to the average energy-measure value
, and the variance of energy measure of the prepared voiced frames. They are
and
where and are the parameters allowing us to adjust the values of and to obtain a good result. It is better to have , so we set . When all the parameters, , , , and are determined, they are fixed and used in all the experiments in the rest of this paper.
D. Experiments
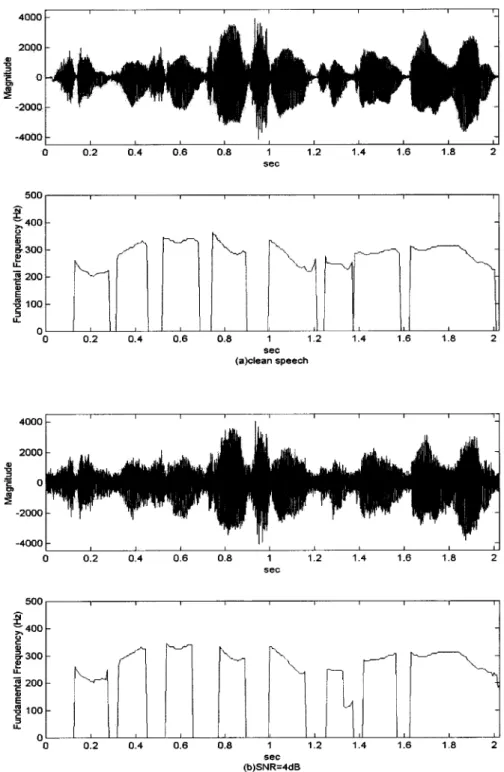
We shall now apply the pitch measure to estimate the fun-damental frequency on the speech spectrum obtained by FFT, called FFT-spectrum. The flowchart of the proposed estimation scheme based on FFT-spectrum is shown in Fig. 3. In the exper-iments, the speech signal, sampled at 16 kHz, is blocked into
frames of samples using a rectangular window, with adjacent frames being separated by samples. Then we use 2048-point FFT to obtain the spectrum of each frame. The -sample frame are zero-padded to 2048 sam-ples. Since the sampling rate of speech signals is 16 kHz and the 2048-point FFT is used, the resolution of the estimated fun-damental frequency is only 4 Hz. To achieve a better resolution in fundamental frequency, the auto correlation of the periods around the estimated period (the reciprocal of the estimated fun-damental frequency) is calculated and the period with the max-imum auto correlation value is adopted as pitch period and the corresponding fundamental frequency is calculated as the final estimated result. The performance of the proposed scheme on clean speech of a female is shown in Fig. 4(a), which shows the clean speech waveform and the estimated pitch contour. The proposed scheme is also evaluated on noisy speech. A Gaussian noise was added to the clean speech at SNR value of 4 dB. The estimated pitch contour as well as the corresponding noisy speech waveform are shown in Fig. 4(b). We observe that the performance degrades greatly when the speech is interfered with by additive noise. To enhance the robustness of the proposed scheme in noisy condition, we shall propose a FAR algorithm to obtain the speech spectrum for robust fundamental frequency estimation in the following section.
III. ADAPTIVEREPRESENTATION OFSPEECHSPECTRUM In this section, we shall give the details of adaptive represen-tation, propose a fast algorithm to realize it, and then integrate this algorithm with the pitch-measure-based scheme developed in Section II to form a robust fundamental-frequency estimator.
A. Adaptive Representation
The adaptive representation is to find the most important factors that characterize the signals in which we are interested [12], [13]. Adaptive representation flexibly decomposes a signal, , into a linear expansion of waveforms selected from a redundant dictionary of elementary functions,
(7)
where is a proper coefficient. Adaptive representation allows us to select a set of appropriate elementary functions to best match the structure of a target function for both time and frequency localization. Because of capturing only important factors of speech signals, adaptive representation can provide useful information in noisy environments.
The Gaussian-type function, which is defined as
(8) is a natural selection to form the set of elementary functions for adaptive representation according to the lower bound of the uncertainty principle [11] and the fact that any function can be decomposed into a linear combination of Gaussian-type func-tions [12], [13]. To see this, we take the Wigner–Ville distri-bution (WVD) [16] of a Gaussian-type function. The WVD is a tool to study the time-frequency characteristic of a signal; it
614 IEEE TRANSACTIONS ON SPEECH AND AUDIO PROCESSING, VOL. 9, NO. 6, SEPTEMBER 2001
Fig. 4. Performance of the proposed pitch-measure-based fundamental frequency estimation scheme based on the FFT-spectrum of a female’s speech. (a) Clean speech signal and the estimated pitch contour. (b) Speech signal with adding noise at SNR= 4 dB, and the estimated pitch contour.
calculates the time-dependent power spectrum of a signal. The WVD of a Gaussian-type function is defined by
WVD
(9) This equation indicates that the Gaussian-type function is localized in both time and frequency domains with the time-frequency center located at .
Based on the above analysis, the dictionary we choose in our scheme is the family of Gaussian-type functions defined by , where is defined in (8). However, in the three parameters, of , we fix the value of for all , since the length of each speech frame is fixed, and set the parameter located at the center of a speech frame. Then the frequency is the only parameter to be determined in choosing the best [or denoted as ] from . Since the dictionary is redundant, there is no unique solu-tion for (7). We need an iterative procedure to select from successively to best match the structure of the speech signal
. This is done by successive approximations of with or-thogonal projections on elements of ; that is, the coefficients in (7) are determined by
(10) which reflects the similarity between and , where is the residual after the th iteration of approximating signal in the direction of . The coefficient reflects the signal’s local behavior over .
Let us start with and , which is the original speech signal. The signal can be decomposed into
(11) in the sense of
(12) and
(13) for . Repeat this process to sub-decompose the residual , for , by projecting it on an elementary function from , which has the best match with . Finally, we can obtain a set of elementary functions, , selected from
, which most resemble the structure of .
According to the above equation, to find the best-matching Gaussian-type function at the th iteration, we must take Fourier
transform of and search for the
fre-quency such that the determined Gaussian-type function has the maximum similarity with the th residual of a speech signal. To gain the best accuracy at lower computation cost, we choose the eight most important Gaussian-type functions to expand a frame of a speech signal. This needs eight times of Fourier trans-form, where the number “8” is determined by experience.
As was done in the experiments of Section II, we use 2048-point FFT to implement the adaptive representation to obtain the spectrum of a speech signal. At the th iteration, the th residual of a -sample frame is zero-padded to 2048 samples. The estimated fundamental frequency for each frame is also finely tuned by the auto correlation method as done in Section II. In the following, we aim at reducing the computation complexity of adaptive representation.
B. Fast Adaptive Representation (FAR) Algorithm
High computation complexity is the major shortcoming of the adaptive representation scheme, especially for the requirement of high frequency resolution. For example, if we take
2048-point FFT, we need times of
com-plex multiplications to obtain the adaptive representation in each search iteration, , for each frame, if the butterfly computation is used. Reducing the computation complexity for real-time ap-plications becomes an important issue. In this section, we pro-pose a fast algorithm to realize the adaptive representation with
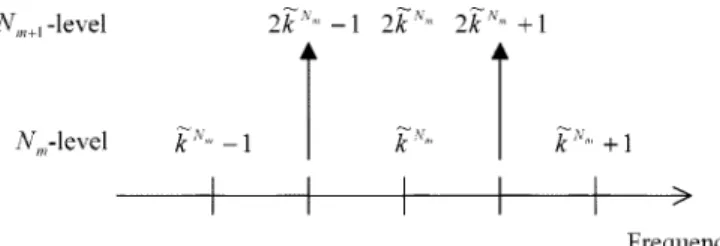
Fig. 5. Illustration of the proposed FAR algorithm; selection of ~k at N -level from the three candidates:2~k 0 1; 2~k , and2~k + 1 at N -level.
lower computation complexity. The basic concept of the fast al-gorithm is that, for each search iteration, we start the search from the frequency of the best-matching Gaussian-type func-tion at lower frequency resolufunc-tion on the full frequency range, and then increase the search resolution on more focused search region step by step to reach the final desired resolution. In other words, for each (e.g., the th) search iteration in the FAR algo-rithm, we start from using smaller point-number FFT to find the raw candidate frequency region, in which the frequency of the Gaussian-type function that can best describe is located. Then, in the next step, we focus our search only on this raw can-didate frequency region using larger point-number FFT to ob-tain a finer candidate frequency region. Continuing such steps, we can finally find the best-matching Gaussian-type function , whose frequency lies within the desired resolution for the th search iteration. This kind of “divide-and-conquer” approach reduces the computation complexity obviously.
The proposed FAR algorithm is summarized as follows (see Fig. 5) and the details are given in Appendix D.
At the initial step: We set
(14)
at -level, where , and
.
At the th step: We set
(15)
at -level, where , and
.
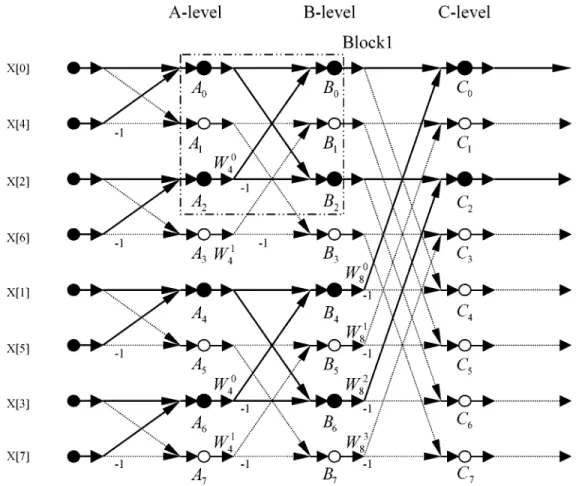
To implement the procedure proposed above, we define an operation called “partial FFT,” which computes only some FFT values we want, in contrast to the traditional FFT, which computes all the FFT values. The computation flow graph for computing 8-point (traditional) FFT values is shown in Fig. 6
[17], where . Assume and
are the two values we want. Then, the solid lines and solid circles in the figure show the partial FFT for computing and . The partial-FFT computation flow in Fig. 6 reveals
that nodes and as well as nodes
and form a flow of butterfly. The number of complex multiplications to obtain the FFT values of node and is 1, if the simplified butterfly computation is used. The number of complex multiplications to obtain the values of node and is . By induction, the number of complex multipli-cations to obtain the FFT values of index and at -level
616 IEEE TRANSACTIONS ON SPEECH AND AUDIO PROCESSING, VOL. 9, NO. 6, SEPTEMBER 2001
Fig. 6. Computation flow graph of traditional FFT and partial FFT.
is .
In our algorithm, we perform the search steps from 512-level to 2048-level (i.e., ) to find the frequency for the best-matching Gaussian-type function . The total number of complex multiplications in our case is , which is much less than , the total number of complex multiplications for 2048-point FFT. That is, by the proposed FAR algorithm, we reduce the number of complex multiplications of the original algorithm by about 50% in each search iteration, , for each speech frame.
C. Fundamental Frequency Estimation Based on Adaptive Representation
By the FAR algorithm, we can obtain the adaptive represen-tation of a speech frame as in (7). We then take the WVD of (7) and ignore the cross terms to obtain the speech spectrum, called FAR-spectrum, as
WVD
(16)
The reason for ignoring the cross-terms is that the term of double indefinite integral of cross-term over time and frequency is zero. It implies that the cross-term contains zero energy. More de-tailed information can be found in [11, ch. 8].
We can now use the proposed pitch measure in (5) and (6) to analyze the FAR-spectrum to estimate the fundamental frequency of speech signals. The flowchart of this scheme is shown in Fig. 3. The performance of the scheme based on FAR-spectrum for the clean speech of a female is shown in Fig. 7(a). The corresponding wave of the clean speech is shown in Fig. 4(a). The performance of this FAR-spectrum-based estimation scheme is also evaluated on noisy speech at SNR value of 4 dB shown in Fig. 4(b). The corresponding estimation results are shown in Fig. 7(b). Comparing the estimation results in Fig. 7 and Fig. 4, we observe that both of the two proposed schemes have good performance on clean speech. However, the performance of the FAR-spectrum-based scheme is better than that of the FFT-spectrum-based scheme in noisy condition.
IV. EXPERIMENTALRESULTS ANDCOMPARISONS In this section, we evaluate the performance of the pro-posed schemes on a large database according to six error measurements, and compare it to the performance of the sim-plified inverse filter tracking algorithm (SIFT) [9], cepstrum method [18]–[20], and a commercial fundamental-frequency estimation software, ESPS.
A. Testing Database
The prepared database for performance evaluation consists of 50 files of speech utterances spoken by 25 males and 25 fe-males, where the sampling rate of the speech signals is 16 kHz. Every speaker provides one file to the database. These 50 files
Fig. 7. Performance of the proposed pitch-measure-based fundamental-frequency estimation scheme based on the FAR-spectrum of a female’s speech. (a) Estimated pitch contour on the clean speech signal shown in Fig. 4(a). (b) Estimated pitch contour on the speech signal with adding noise at SNR= 4 dB shown in Fig. 4(b).
are selected from the continuous speech database recorded by “Chunghwa Telecommunication Laboratories” in Taiwan. Each speech file is composed of the sentences from an article. The contents of the articles of all the files are different. Each speaker uttered one of the articles in continuous speech type to form a file. As a total, the whole database consists of 50 articles, about 500 sentences, 5000 Chinese characters, with length of 1500 s (240 000 frames).
We also provide a reference of pitch contour for each file in the database. It is obvious that a standard and perfectly la-beled database does not exist. A lala-beled reference database of the pitch contours was generated by visual inspection of the original waveforms by authors. We recognized all the periods of the waveforms displayed on the monitor. This was done by labeling the positions of the beginning and ending of all periods on screen using the action of mouse clicking. At the beginning of a voiced sound, there are some valleys with maximum nega-tive amplitude within the region of one pitch period. Since these valleys can be identified obviously and easily, we labeled these valleys to find the pitch of the waveform. Then we traced along the waveform to find the next valley one by one. It should be noted that the distance between any pair of two adjacent labeled valleys is indeed the pitch period of the speech signal in local region. After recognizing all the pitch periods on the waveform, we determined whether it is voiced or unvoiced sound and cal-culated the fundamental frequency if it is voiced for each frame. If a frame is at the middle of a voiced sound, it is full of periodic pulses and it is viewed as a voiced frame, and the corresponding pitch period is the average distance of all pairs of two adjacent labeled valleys within the frame. If a frame is at the beginning or ending of a voiced frame, it is viewed as a voiced frame if the length of periodic pulses is over 50% of the frame; otherwise it is viewed as an unvoiced one. The determination of pitch pe-riods for the frames at the beginning or ending of a voiced sound is the same as that for the middle-frame of a voiced sound, i.e., taking the average pitch value. All the labeled positions were recorded and then the pitch-contour references were obtained.
B. Error Measurements
The performance measurements we use in the evaluation include voiced-to-unvoiced (V–UV) and unvoiced-to-voiced (UV–V) error rates, and the error of the estimated fundamental frequency. The first two measurements are used to indicate the accuracy in classifying voiced and unvoiced frames, respectively. The last measurement is to check the deviation of the estimated fundamental frequency from the reference. A V–UV error results from that a voiced frame in the reference is detected as an unvoiced one by the estimation algorithm, and an UV–V error results from that an unvoiced frame in the reference is detected as a voiced frame. These two measure-ments are defined as the ratio of the frame numbers of V–UV or UV–V errors to the total frame numbers in the database.
The weighted gross pitch error [21] is used to measure the dif-ference between the estimated fundamental frequency and the reference. This measurement is defined as follows:
GPE (17)
where
number of voiced frames in the reference; short-time energy of the th frame; maximum energy of the frames;
and reference and estimated fundamental frequencies for the th frame, respectively;
is used for normalization.
The GPE measurement is applied to the voiced frames indi-cated by the reference database. A good fundamental-frequency estimation algorithm should have lower GPE. If we make an insight into the GPE measurement, we can see that the GPE is proportional to the frame energy and the term . While computing the GPE for one given frame, the value has been determined since is fixed for the given frame. The exact GPE value contributed by one given frame depends on the accuracy of the estimated fundamental
618 IEEE TRANSACTIONS ON SPEECH AND AUDIO PROCESSING, VOL. 9, NO. 6, SEPTEMBER 2001
frequency. The frame with higher estimation accuracy con-tributes less to the overall GPE. This means that the estimation accuracy of a frame with larger energy is more important than that with smaller energy. If a voiced frame in the reference is classified as an unvoiced one by the estimation algorithm, then the value of is contributed to the overall GPE. That is, the maximum GPE value contributed by one frame is when a V–UV error occurs. Thus, the GPE measurement indicates not only the difference between the estimated fundamental frequency and the reference, but also the V–UV error.
In addition to the above three performance measurements, Rabiner [7] suggested three other measurements, gross error count (GEC), fine pitch error—average value (FPEAV), fine pitch error—standard deviation (FPESD). These three mea-surements are also adopted to evaluate the performance of various fundamental-frequency estimation algorithms in this paper. A voiced frame results in a gross pitch period error if ms, where represents the frame index. Gross error count is defined as the ratio of the frame numbers with gross pitch period error to the total frame num-bers. A fine pitch error occurs when ms. The average value of fine pitch errors is defined as , where is the number of fine pitch errors. The standard deviation of fine pitch errors is defined as
C. Performance Evaluation and Discussion
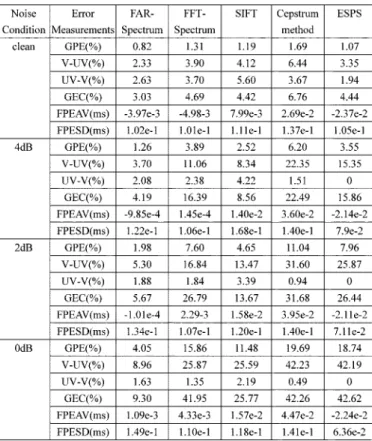
Using the proposed algorithms, i.e., the pitch-measure-based estimation scheme based on FFT-spectrum or FAR-spectrum, we can obtain the estimated pitch contour of each file in the data-base. The performance of the proposed schemes is also evalu-ated in adding white noisy conditions with different SNR values 4 dB, 2 dB, and 0 dB. The evaluation results for male and female speakers are given in Tables I and II, respectively. Both tables include the estimation results of the proposed schemes based on FAR-spectrum and FFT-spectrum. The widths of inner and outer windows used in energy measure and impulse measure as well as the values of and are the same for all speakers. These results are also compared against those of SIFT [9], cep-strum method [18]–[20], and ESPS on the same database. In SIFT, a spectrally flattened time waveform is first obtained and the auto correlation measurement is made on the waveform to estimate the pitch period. In the cepstrum method, the detec-tion of peaks on cepstrum is used to detect the pitch period. The ESPS is the Entropic Signal Processing System (or Soft-ware) designed by Entropic Research Laboratory. We used one function of this software, called Get-f0, which performs funda-mental-frequency estimation using the normalized cross corre-lation function, dynamic programming, and a robust algorithm for pitch tracking (RAPT) [22]. The same database and refer-ences are used to evaluate the performance of SIFT, cepstrum method, and ESPS in clean and noisy conditions. The corre-sponding evaluation results are also shown in Tables I and II.
TABLE I
PERFORMANCE OF THEPROPOSEDFUNDAMENTAL-FREQUENCYESTIMATION
SCHEMES ANDSIFT, CEPSTRUMMETHOD,ANDESPSINDIFFERENT
NOISECONDITIONS FORMALESPEAKERS
TABLE II
PERFORMANCE OF THEPROPOSEDFUNDAMENTAL-FREQUENCYESTIMATION
SCHEMES ANDSIFT, CEPSTRUMMETHOD,ANDESPSINDIFFERENT
TABLE III
COMPUTATIONTIMECOST OF THECOMPAREDALGORITHMS FOREACHSPEECHFRAME
Discussion on the results listed in Tables I and II is made here. The results on the GPE measurement showed that the FAR-spectrum-based scheme performed better than other compared algorithms on clean speech. That is, the fundamental frequencies of most important voiced frames with high energy were successfully estimated by this scheme. The cepstrum method failed at some tail portion of voiced sound for both male and female speakers. In noisy conditions, the results on the GPE measurement showed that the FAR-spectrum-based scheme was obviously superior to all the other algorithms. The results also indicated that the performance of the proposed FFT-spectrum-based scheme degraded in noisy conditions, es-pecially for female speakers, although it had good performance on clean speech.
The results on the GEC measurement showed that the FAR-spectrum-based scheme performed better than the other algorithms. The FFT-spectrum-based scheme performed well for male speakers, however, it failed for female speakers. The measurements of V–UV and UV–V errors provided several interesting results. These categories cannot be examined sepa-rately because they are often intimately related. For example, a V–UV detector which is biased toward the category voiced will generally have a low V–UV error rate, but in compensation will have a high UV–V error rate [7]. The results on V–UV error and UV–V error showed that our two proposed schemes and SIFT are examples of this case. On the other hand, ESPS and cepstrum method are examples opposite to this case. A simple threshold on one or more measurements to classify a frame as voiced or unvoiced is used for the compared algo-rithms. In our study, a continuous pitch-tracking algorithm was adopted to make voicing decision. The property of continuity on pitch contours and the impulse measure were utilized for V/UV decision. In our thinking, it is important to detect the fundamental frequency of one frame if it is voiced, so we adjusted the threshold in the pitch-tracking algorithm to achieve a low V–UV error rate. It should be noted that the better performance of the proposed FAR-spectrum-based scheme in noisy conditions is gained at the expense of higher computation complexity. The computation time cost of all the compared algorithms for each speech frame is listed in Table III.
V. CONCLUSIONS
In this paper, we first proposed a pitch measure to detect the harmonic spectral structure of speech signals, based on which a new fundamental-frequency estimation scheme was developed. This scheme can analyze the spectrum of a speech signal and produce the corresponding pitch contours. Although the spec-trum of a speech signal can be obtained by the traditional FFT, it
is easily contaminated by additive noise. To enhance the robust-ness of the proposed estimation scheme, we developed a FAR algorithm to obtain the spectrum of a speech signal. This fast algorithm was based on the techniques of adaptive represen-tation, divide-and-conquer, and partial FFT. The obtained ro-bust spectrum, called FAR-spectrum, was then analyzed by the pitch-measure-based estimation scheme to obtain the pitch con-tours. Experimental results have demonstrated the robustness and accuracy of the proposed fundamental-frequency estima-tion scheme based on the FAR-spectrum, especially in compar-ison with SIFT, cepstrum method, and a commercial software, ESPS. The superiority of the proposed scheme is gained at the expense of higher computation cost. Although the proposed fast algorithm has reduced the computation complexity of the orig-inal algorithm by 50%, it still takes longer than the compared counterparts. The goal of our future work is to further reduce this gap of computation cost.
APPENDIX A
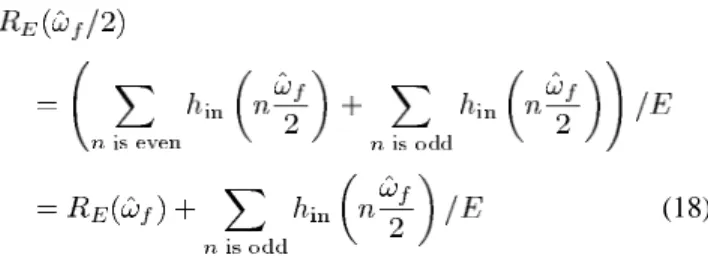
PROOF FOR THEPROPERTIES OFENERGYMEASURE The energy measure at , i.e., is
(18)
subject to (3). The value of the second term in the last equa-tion is very small such that it can be neglected, because there is no distinct impulse located on for odd .
There-fore, and we might determine by
mis-take the fundamental frequency to be , instead of , ac-cording to the energy measure alone. It should be noted that there is no confusion between and , since
subject to (3). The value of the second term in the equation cannot be neglected, so we have . Hence, the energy measure does not have the pitch-halving problem.
APPENDIX B
PROOF FOR THEPROPERTIES OFIMPULSEMEASURE
Subtracting from , we obtain
620 IEEE TRANSACTIONS ON SPEECH AND AUDIO PROCESSING, VOL. 9, NO. 6, SEPTEMBER 2001
The condition for satisfying the inequality is
Since it always appears that
we might determine by mistake the fundamental-frequency to be , instead of , according to the impulse measure alone. It should be noted that the confusion between and (i.e., the pitch-doubling problem) doesn’t exist in the impulse mea-sure. This can be observed from subtracting from
(20)
The condition
always holds, because there is no distinct impulse lo-cated on for odd . Therefore, we always have
.
APPENDIX C
PROOF FOR THEPROPERTIES OFPITCHMEASURE We assume that the true fundamental frequency is . Then the most possible frequencies that are easily confused with the fundamental frequency are and . We now compare
to and . The pitch measure at ,
, and are
(21) respectively. Due to the facts that
, and
, we have and
. Hence the pitch measure at the true fundamental frequency, , has the maximum value, and will not cause confusion at and . In other words, the pitch measure does not have the pitch-doubling and pitch-halving problems.
APPENDIX D DETAILS OFFAR ALGORITHM
We now describe the proposed FAR algorithm in de-tails. In the following, we assume that we are looking for the Gaussian-type function , which best describes the (residual) speech signal , at the th search iteration for adaptive representation. Suppose we want to take -point FFT of the -sample frames of the speech signal to achieve the desired resolution of the estimated fundamental frequency. At the initial step of the FAR algorithm, we take -point FFT of the speech signal on the full frequency range, where is a preset integer determining the number of steps for searching the best-matching Gaussian-type function . The -sample frames are zero-padded to samples such that the spectrum can be obtained by -point FFT. Then at the following steps, we take -point FFT, for , and , of on the frequency region se-lected by the previous th step. The -sample frames are zero-padded to samples as done at the initial step. For convenience of explanation, we divide the frequency axis into different levels of resolution, where the -level
is defined as ,
where , and .
The index represents the th step to search the fre-quency whose corresponding Gaussian-type function, , best describes , where means the initial step. We can see that . At the initial step (i.e., ), we take -point FFT of the speech signal, and find the index , called the chosen index at
-level, such that , where
, and . At the next
step, we set the search region centered at index
and bounded by at
-level, where , as illustrated in Fig. 5. Then we select the index , called the chosen index at -level,
from , whose corresponding
FFT’s value (the spectrum magnitude after FFT) is maximum. This is equivalent to taking -point FFT and selecting the fre-quency with the maximum FFT value among three candidates,
, , and .
Similarly, at the third step, we can obtain the chosen index at -level, , from the three candidates, , ,
and at -level, where . We carry
on this iterative step-by-step procedure until the estimated fundamental frequency lies within the desired resolution at -level after steps. The chosen index at -level, , is what we look for finally. We pick the Gaussian-type function with the frequency corresponding to (i.e., ) as the th elementary function at the
REFERENCES
[1] J. L. Flanagan, Speech Analysis, Synthesis, and Perception. New York: Springer-Verlag, 1972.
[2] A. V. McGree and T. P. Barnwell, III, “A mixed excitation LPC vocoder model for low bit rate speech coding,” IEEE Trans. Speech Audio
Pro-cessing, vol. 3, pp. 242–250, July 1995.
[3] S. H. Chen and Y. R. Wang, “Tone recognition of continuous Man-darin speech based on neural networks,” IEEE Trans. Speech Audio
Pro-cessing, vol. 3, pp. 146–150, Mar. 1995.
[4] T. Lee, P. C. Ching, L. W. Chan, Y. H. Cheng, and B. Mak, “Tone recog-nition of isolated Cantones syllables,” IEEE Trans. Speech Audio
Pro-cessing, vol. 3, pp. 204–209, May 1995.
[5] L. S. Lee, C. Y. Tseng, H. Y. Gu, F. H. Liu, C. H. Chang, Y. H. Lin, Y. Lee, S. L. Tu, S. H. Hsieh, and C. H. Chen, “Golden Mandarin (I)—A real-time Mandarin speech dictation machine for Chinese language with very large vocabulary,” IEEE Trans. Speech Audio Processing, vol. 1, pp. 158–178, Apr. 1998.
[6] S. Potisuk, M. P. Harper, and J. Gandour, “Classification of Thai tone sequences in syllable-segmented speech using the analysis-by-synthesis method,” IEEE Trans. Speech Audio Processing, vol. 7, pp. 95–102, Jan. 1999.
[7] L. R. Rabiner, M. J. Cheng, A. E. Rosenberg, and C. A. McGonegal, “A comparative performance study of several pitch detection algorithms,”
IEEE Trans. Acoust., Speech, Signal Processing, vol. ASSP-24, pp.
399–417, Oct. 1976.
[8] S. Ahmadi and A. S. Spanias, “Cepstrum-based pitch detection using a new statistical V/UV classification algorithm,” IEEE Trans. Speech
Audio Processing, vol. 7, pp. 333–338, May 1999.
[9] J. D. Markel, “The SIFT algorithm for fundamental frequency estima-tion,” IEEE Trans. Audio Electroacoust., vol. AU-20, pp. 367–377, Dec. 1972.
[10] B. Boashash, Time-Frequency Signal Analysis. New York: Wiley, 1992.
[11] S. Qian and D. Chen, Joint Time-Frequency Analysis. Englewood Cliffs, NJ: Prentice-Hall, 1996.
[12] S. G. Mallat and Z. Zhang, “Matching pursuits with time-frequency dic-tionaries,” IEEE Trans. Signal Processing, vol. 41, pp. 3397–3415, Dec. 1993.
[13] S. Qian and D. Chen, “Signal representation using adaptive normalized Gaussian functions,” Signal Process., vol. 36, pp. 1–11, 1994. [14] L. R. Rabiner and B. H. Juang, Fundamentals of Speech
Recogni-tion. Englewood Cliffs, NJ: Prentice-Hall, 1993.
[15] J. G. Deller, J. G. Proakis, and J. H. L. Hansen, Discrete-Time Processing
of Speech Signals. New York: Macmillan, 1993.
[16] T. A. C. M. Classen and W. F. G. Mecklenbräuker, “The Wigner distribu-tion—A tool for time-frequency signal analysis—Parts I, II, III,” Philips
J. Res., vol. 35, pp. 217–250, 276–300, 372–389, 1980.
[17] A. V. Oppenheim and R. W. Schafer, Discrete-Time Signal
Pro-cessing. Englewood Cliffs, NJ: Prentice-Hall, 1989.
[18] R. W. Schafer and L. R. Rabiner, “Digital representations of speech sig-nals,” Proc. IEEE, vol. 63, no. 4, pp. 662–677, 1975.
[19] , “System for automatic formant analysis of voiced speech,” J.
Acoust. Soc. Amer., vol. 47, pp. 634–648, Feb. 1970.
[20] A. M. Noll, “Cepstrum pitch determination,” J. Acoust. Soc. Amer., vol. 41, pp. 293–309, Feb. 1967.
[21] B. G. Secrest and G. R. Doddington, “Postprocessing techniques for voice pitch trackers,” in Proc. IEEE ICASSP’82, 1982, pp. 172–175. [22] D. Talkin, “A robust algorithm for pitch tracking (RAPT),” in Speech
Coding and Synthesis, W. B. Kleijn and K. K. Paliwal, Eds. New York: Elsevier, 1995.
Der-Jenq Liu received the B.S. degree in
me-chanical engineering from the National Central University, Chung-li, Taiwan, R.O.C., in 1992, and the M.S. degree in power mechanical engineering from the National Tsing-Hua University, Hsinchu, Taiwan, in 1994. He is currently pursuing the Ph.D. degree in the Department of Electrical and Control Engineering, National Chiao-Tung University, Hsinchu. His current research interests include speech recognition, neural networks, and the applications of short-range wireless communication like Bluetooth system.
Chin-Teng Lin (SM’88–M’91–SM’99) received the
B.S. degree in control engineering from the National Chiao-Tung University, Hsinchu, Taiwan, R.O.C., in 1986, and the M.S.E.E. and Ph.D. degrees in electrical engineering from Purdue University, West Lafayette, IN, in 1989 and 1992, respectively.
Since August 1992, he has been with the College of Electrical Engineering and Computer Science, Na-tional Chiao-Tung University, where he is currently a Professor and Chairman of Electrical and Control En-gineering Department. He served as the Deputy Dean of the Research and Development Office of the National Chiao-Tung Univer-sity from 1998 to 2000. His current research interests are fuzzy systems, neural networks, intelligent control, human-machine interface, image processing, pat-tern recognition, video and audio (speech) processing, and intelligent transporta-tion system (ITS). He is the coauthor of Neural Fuzzy Systems—A Neuro-Fuzzy
Synergism to Intelligent Systems (Englewood Cliffs, NJ: Prentice-Hall, 1996),
and the author of Neural Fuzzy Control Systems with Structure and
Param-eter Learning (Singapore: World Scientific, 1994). He has published about 60
journal papers in the areas of soft computing, neural networks, and fuzzy sys-tems, including 35 paper for the IEEE.
Dr. Lin is a member of Tau Beta Pi and Eta Kappa Nu. He is also a member of the IEEE Computer Society, the IEEE Robotics and Automation Society, and the IEEE Systems, Man, and Cybernetics Society. He has been the Executive Council Member of Chinese Fuzzy System Association (CFSA) since 1995, and the Supervisor of Chinese Automation Association since 1998. He is the Chairman of the IEEE Robotics and Automation Taipei Chapter since 2000. He won the Outstanding Research Award granted by National Science Council (NSC), Taiwan, from 1997 to 2000, the Outstanding Electrical Engineering Pro-fessor Award granted by the Chinese Institute of Electrical Engineering (CIEE) in 1997, and the Outstanding Engineering Professor Award granted by the Chi-nese Institute of Engineering (CIE) in 2000. He was also elected to be one of the 38th Ten Outstanding Young Persons in Taiwan (2000).