Abstract—Goal: The goal of this study is to present a modified pulse contour method to estimate the stroke volume (SV) based on an oscillometric sphygmomanometer. Methods: The pulse contour was extracted from the pulse signal of the cuff pressure. The characteristics of the brachial artery, as well as the compliance (Cartery) and time constant (τ) of the Windkessel model, could be determined and used to estimate the SV once the apparatus finished the blood pressure measurement. Results: Assessments of the SV by echocardiography and our method were carried out in 55 subjects. The change in the brachial arterial volume obtained by our method was significantly correlated with that of the two-dimensional ultrasound method (rv=0.871). The estimated SV values by our method for male and female groups, SVestimate, were also significantly correlated with the echocardiography results, SVref (rmale=0.680, rfemale=0.706). The Bland-Altman plot showed agreement between SVref and SVestimate, with all data points contained within the limits of agreement (±2SD). The mean difference and standard deviation (mean ±SD) were 0.101±14.880 ml and 0.650±11.990 ml for the male and female groups, respectively. Conclusion: The blood pressure, SV and cardiac output were measured simultaneously, making our method well-suited for home use. Significance: Our method was embedded in an oscillometric sphygmomanometer.
Index Terms—Stroke volume, oscillometry, brachial artery, pulse contour.
I. INTRODUCTION
N clinical diagnosis, the mean arterial pressure and the cardiac output are generally used to estimate the total peripheral resistance [1]. Many studies have shown that reduced compliance leads to a higher risk for coronary artery diseases [2-3]. Therefore, it has been recommended that people with high risk factors for coronary artery diseases should measure their blood pressure every day. However, the blood pressure is only an output variable of the circulatory system and is related to the cardiac output and peripheral resistance. If high-risk individuals not only measure their blood pressure but also measure their cardiac output daily, they can more clearly understand their cardiovascular condition. However, all of the conventional cardiac output measurements have the complex operating procedures that
I
This work was supported by the Ministry of Science and Technology, Taiwan, under Grants: NSC 102-2221-E-214-005-MY3 and MOST 103-2221-E-324-010.
S.-H. Liu is with the Department of Computer Science and Information Engineering, Chaoyang University of Technology, Taiwan. *T.-H. Lin is with Department of Cardiology, Lin-Shin Hospital, Taiwan. *D.-C. Cheng is with the Department of Biomedical Imaging and Radiological Science, China Medical University, Taiwan. J.-J. Wang is with the Department of Biomedical Engineering, I-Shou University, Taiwan. (correspondence e-mails: medical aspect is with linegg.linegg@msa.hinet.net; engineering aspect is with dccheng@mail.cmu.edu.tw).
belong to the minimally invasive/noninvasive measurements, and are expensive [4]. For example, the thermodilution method, which is used in most intensive care units and surgical suites, requires pulmonary artery catheterization.
The pulse contour method, which measures cardiac output by the Windkessel model, differs from the thermodilution method. Wesseling et al. used a nonlinear three-element model to compute the stroke volume (SV) on a beat-to-beat basis [5]. In this model, the authors used the arctangent model of aortic mechanics of Langewouters et al. [6] to estimate the aortic impedance and compliance. The radial arterial pressure was used as the input for this model. Similarly, Bogert et al. used the arterial pressure of the finger to estimate the beat-to-beat SV using the Windkessel model. However, this methodology was only able to track the trend of SV during various types of postural stress and exercise [7]. Romano et al. simplified the Windkessel model to estimate SV by computing the whole systolic area of the arterial pressure curve and the arterial impedance [8]. Because the pressure contours vary between the aorta and peripheral arteries, the computation of arterial impedance required modification according to the characteristics of the pressure contour. Mukkamala et al. identified an impulse response to represent the arterial tree, and they derived the time constant from the exponentially decaying portion of the impulse response. [9]. McDonald [10] used two pressure measurements in the aorta, 3-5 cm apart. These data were incorporated into the Wormersley equation [11] to calculate the aortic flow and stroke volume. Welkowitz et al. used the model of Welkowitz and Fich to estimate the SV [12, 13]. Currently, there are three well-known commercial devices on the market that use the pulse contour method to estimate the continuous SV, FloTRac/VigileoTM
[14], the PiCCOplusTM [15], and the LiDCOplusTM
[16].However, Critchley et al. reviewed these devices and found that to obtain absolute values of cardiac output, it is necessary to determine a calibration factor by comparing the study result with an absolute cardiac output measurement at least once for each patient [17].
According to the pulse contour method with the Windkessel model, if the total peripheral resistance and arterial compliance are known, the SV can be estimated. Moreover, the time constant τ in the Windkessel model exhibits a strong correlation with the total peripheral resistance and arterial compliance [8]. However, the pulse contours of smaller arteries, such as the radial artery or the finger artery, may appear as a non-evident exponential diastolic decay. Thus, SV estimation using a peripheral artery has two problems. One is obtaining a good pressure contour that has an evident
Assessment of Stroke Volume from Brachial
Blood Pressure Using Arterial Characteristics
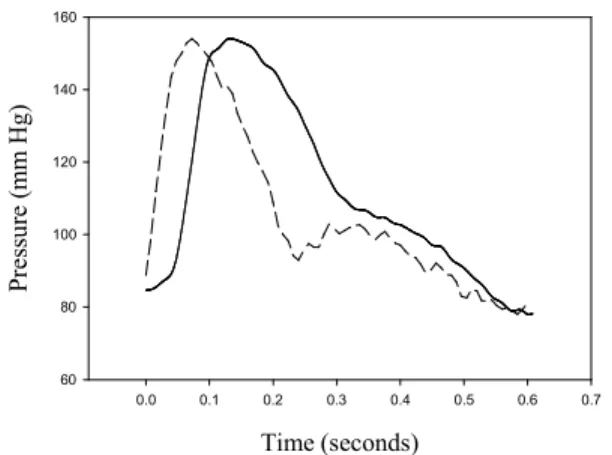
exponential diastolic decay. Peripheral blood pressure waveforms measured by a tonometer are inherently corrupted by wave reflections. When the brachial pressure waveform measured by the cuff has a more inherent distortion due to the characteristics of the cuff, the higher cuff pressure leads to a higher distortion of the pulse contour. Moreover, a lower cuff pressure leads to more artifacts in the pulse contour. Figure 1 shows two pulse contours with cuff pressures of 94 mm Hg (solid line) and 39 mmHg (dashed line). That particular patient was an 84-year-old male with blood pressure of 154/78 mm Hg. The pulse contour has a large distortion within the diastolic duration and a shift within the systolic duration. The motion artifact was coupled in the pulse contour when the cuff pressure was 39 mm Hg, as shown in Fig. 1. Another problem is determining how to evaluate the arterial compliance from the arterial tree.
Time (seconds) 0.0 0.1 0.2 0.3 0.4 0.5 0.6 0.7 Pr es su re ( m m H g) 60 80 100 120 140 160
Fig. 1. The pulse contours extracted from the various cuff pressures. The solid lie is 94 mm Hg, and the dashed line is 39 mm Hg. That particular patient was an 84-year-old male with blood pressure of 154/78 mm Hg.
In this study, the goal is to develop a novel method of estimating the SV based on an oscillometric sphygmomanometer. Our target was to quickly estimate the SV using the pulse contour method after measuring the blood pressure. Thus, the first step was to obtain a pure pulse contour. The pulse contour was measured from the brachial artery by the cuff. The next step was to determine the brachial arterial compliance according to the method proposed by Liu [18]. The SV was subsequently estimated from the pulse contour and the compliance. A total of 55 subjects participated in this study. The SV values estimated by our method were compared with those measured by echocardiography.
II. MATERIALSAND METHODS
A. Technique Background
In any vessel, volume changes occur mainly because of radial expansion in response to variations in pressure. This process involves several physical variables, such as the force of blood ejection by the left ventricle, arterial impedance, arterial compliance, and the resistance of the peripheral vessel.
These variables are tightly dependent and need to be simultaneously evaluated. Therefore, if a variable R representing the relationship between the pressure change and the volume change over time in the vessel is directly estimated, then R and the arterial pulse pressure waveform can be used to estimate the SV.
According to this concept, Romano et al. proposed a pulse contour method using finger pressure to estimate the SV,
SV =
A (mmHg ∙ sec)
Z (mmHg/ml ∙ sec)
, (1)where A is the integrative area of the pressure waveform under the systolic duration, Z represents the change in the pressure waveform with time (mmHg/sec) multiplied by a factor, k, related to the inverse of the instantaneous acceleration of the vessel cross-sectional area (sec2/cm ∙1/cm2)
[8]. This factor, k, was considered to be a variable of the mean arterial pressure (MAP).
In the Romano method, the main challenge is determining how to estimate the instantaneous acceleration of the vessel cross-sectional area from the characteristics of the arterial tree comprising the peripheral arteries. According to the Windkessel model, the time constant, τ, is related to the characteristics and is defined as
τ =RC
, (2)where R is the resistance of the peripheral arteries and C is the compliance. Therefore, in this study, we modified the Romano method to estimate SV,
SV =
A
dP∙ R
, (3)dP=
P
sys−
P
diat
1+
P
3T −t
3−
P
2T −t
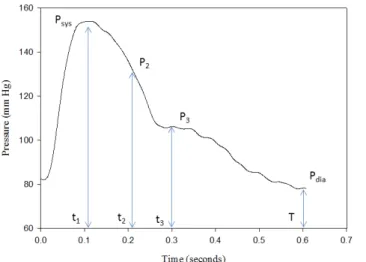
2 . (4)Figure 2 is a brachial pressure waveform extracted from the cuff pressure when the mean cuff pressure was 82 mm Hg. According to the notation in Fig. 2, Psys is the pressure
occurring at the time (t1) of the maximum value of the
pressure waveform, Pdia is the minimum value of the pressure
waveform, P2 is the pressure occurring at the time (t2) of the
maximum value of the second derivative of the pressure waveform between Psys and P3, and P3 is the pressure
occurring at the time (t3) of the dicrotic notch. T is the time of
the cardiac cycle.
B. Measurement System
Our measurement system was based on an oscillometric sphygmomanometer. To quickly compute the SV after performing the blood pressure measurement, we needed to detect a perfect pulse contour, with pure evident exponential diastolic decay, when the cuff was deflating. However, the pulse contour has a larger distortion when the cuff pressure exceeds the MAP [19, 20]. When the cuff pressure drops below the MAP, we detected a perfect pulse contour that had the most evident exponential diastolic decay by the curve fitting method. The best pulse contour was calibrated using the blood pressure, and the time constant of the exponential
diastolic decay was then calculated. Liu et al. proposed a method to detect changes in arterial vessels [18] from the cuff model. Thus, the compliance of the brachial artery could be measured. The variable R is related to the compliance and the time constant τ. Thus, the SV could be detected.
Fig. 2. The definitions of pressure and time symbols on the waveform of brachial artery.
1) Hardware
In the oscillometric sphygmomanometer used here (i-BP 100, BIOSTAR Corp., Taiwan), the pressure sensor is digital (MPM 100, range: 0 to 300 mm Hg, resolution: 16 bits, Metrodyne Microsystem Corp., Taiwan), as is the flow sensor (MFS 100, range: 0.3 to 2 l/minute, resolution: 12 bits, Metrodyne Microsystem Corp., Taiwan). A TI MSP 430 F6736IPZ is used to perform the peripheral interface control and detect the blood pressure, brachial arterial compliance, and SV. The sampling rate is 125 Hz. The measured signals from the sensors are transmitted to a notebook computer by Bluetooth. This sphygmomanometer has a CE certificate (No: 3816-2013-CE-RGC-NA).
2) Brachial Arterial Compliance
Drzewiecki proposed a simple oscillometric model that included an arterial model and a cuff model [19]. Liu et al. used a pressure sensor and a flow sensor to construct the
cuff model, Ccuff, during the inflating cycle [18].According
to the cuff model, they proposed a method to measure the brachial arterial compliance under the loading condition. In the Liu method, the amplitude of the pulse pressure,
ΔPamp, was extracted from the pulse signal of the cuff
pressure in the deflating cycle when the cuff pressure was the diastolic pressure. Then, the change in the arterial
volume, ΔVartery, was computed according to the equation
below:
∆ V
artery=
C
cuff∙ ∆ P
amp (5)Therefore, the brachial arterial compliance, Cartery, could be
computed,
C
artery=
∆ V
arteryPP
, (6)where PP is the pulse pressure.
3) Extracting a Good Pulse Contour
We defined a good pulse contour as having a diastolic decay with an evident exponential decay. According to the notation in Fig. 1, a perfect pulse contour happens not only at the condition of low cuff pressure but will also happen under conditions of high cuff pressure. The pulse signal was filtered from the cuff pressure signal. The order of the high-pass filter was one, and its cutoff frequency was 0.1 Hz. The order of the low-pass filter was two, and its cutoff frequency was 40 Hz. Because the memory of the MSP 430 F6736IPZ has a limit and the signal must be processed in real time, the search for a perfect pulse contour is performed beat by beat. We began to search for a perfect pulse contour by the curve fitting method when the maximum amplitude of the pulse wave occurred during the deflation. The end time was same as for oscillometry. If the correlation coefficient of the pulse contour exceeded 0.95 and was higher than the value for the previous pulse, then the new pulse contour waveform replaced the recorded pulse contour.
The pulse contour was calibrated using the blood pressure as the pressure waveform. An exponential decay function,
Pcurve_fit, was used to fit the diastolic decay curve,
P
curvefit=
A exp
−Bt (7)
ln
(
P
curvefit)
=ln
(
A
)
−
Bt
(8)L et ln
(
P
curvefit)
=
~
P , ln ( A )=
~
A
(9)~
P=
~
A−Bt
(10)We used the data of the pressure waveform, (
~
P
n, t
n ),to estimate the coefficients
~
A
and B by the inversematrix method,
[
^
A
B
]
=
[
1 −t
1⋮ ⋮
1 −t
n]
−1[
~
P
1⋮
~
P
n]
(11)τ =
1
B
(12)where n is the number of data points.
C. Experimental Protocol
Assessments of the SV by echocardiography and the pulse contour method were carried out in 55 subjects (26 men and 29 women), aged 67 ± 20 years (mean ± SD; range: 25 to 96 years), who underwent routine cardiac disease diagnosis at Linshing Hospital, Taiwan, between Jan. 2013 and May 2014. This experiment was approved by the Asia University Medical Research Ethics Committee. The brachial blood pressure was measured with the oscillometric sphygmomanometer (i-BP 100) in the left arm of each patient. Then, the change of the brachial arterial diameter was measured at the same position by a duplex ultrasound scan machine (SIEMENS Acuson X300) with B mode, which can record 60 frames. The nurse adjusted the linear transducer (11.4 MHz) to obtain the clearest image possible, such as that shown in Fig. 3(a). That particular patient was the same as in Fig. 1. Each patient was measured three times. In the next step, the nurse would measure the SV with the same machine [21]. She also adjusted the transducer (3.1 MHz) to obtain the clearest image possible, such as that shown in Fig. 4. Based on the ECG signal, she marked the maximum and minimum diameters of the left ventricle during the systolic and diastolic cycles. She also measured each patient three times.
We processed the images of the brachial artery to obtain the change of the brachial arterial diameter using the method proposed by Cheng [22]. Because the arterial intima in the image was not clear for all of the patients, we detected the arterial adventitial layer to calculate the change of diameter. We manually marked the position of maximum diameter, shown by the yellow line. The change in arterial diameter is shown in Fig. 3(b). The change of arterial volume was defined according to the equation below,
∆ V
echo=
πl
4
(
D
sys 2−
D
dia2)
=
πl
4
∆ D
2 (13) where l is the length of the artery, Dsys is the maximum arterialdiameter during the systolic cycle, and Ddia is the minimum
arterial diameter during the diastolic cycle. The standard approach was to use the average of the three ΔD2
measurements, but if one of the three ΔD2 values was both the
smallest value and had a larger difference compared to the other two, it was deleted.
Fig.3. The change of brachial arterial diameter was measured by ultrasound, (a) the image is the first frame, the white circle shows the mark point, yellow line, by the manual method, (b) the detected diameters in the 60 frames.
Fig.4. SV was measured by ultrasound. According to the ECG, the nurse determines the systolic cycle and diastolic cycle of the left ventricle and marks the maximum and minimum diameters.
III. RESULTS
The baseline hemodynamic data of the important variables for characterizing the patients are presented in Table 1. The relationship between ΔD2 and ΔV
correlation coefficient was rv=0.871. Figure 6shows the Bland
and Altman plot for the differences and the mean betweenΔD2
and ΔVartery. The mean and standard deviation (mean ±SD) of
the differences were 0.960±0.782 (mm2-ml). Figure 7 shows a
pulse pressure waveform extracted from the same patient as in Fig. 1. In the deflating cycle, the diastolic duration of this pulse contour had the best evident exponential decay. The solid and dashed curves describing the curve fitting results are the raw data and curve fitting data, respectively. Notably, these two curves were much closer during the diastolic cycle. The correlation coefficient was rτ=0.990.
TABLE I
BASELINE HEMODYNAMIC CHARACTERISTICSOF 55 PATIENTS
Internal diameter of brachial artery (cm) 0.344 ± 0.079 Brachial blood flow velocity (cm/s) 80.5 ± 21.7 Arterial compliance (10–3 cm4/dyne) 6.864 ± 2.645
MAP (mmHg) 92.3 ± 11.9
SBP (mmHg) 135.4 ± 23.6
DBP (mmHg) 67.5 ± 8.8
Data are the mean±SD.
The value of R will be different for every patient due to the presence of physical phenomena that may affect the pressure wave transmission. According to the study by Langewouters, the arterial characteristics will be affected by gender [6]. Therefore, we separated the data to determine the relationship between k and R for males and females. Figure 8 shows the relation between k and R, as well as the correlation coefficients, rmale=0.680, rfemale=0.706. We used their linear
regression equation to calibrate the R values. The estimated SV values, SVestimated, of the brachial arteries determined for the
55 patients are summarized in Table 2. The ΔD2, the ejection
fraction and the reference SV values, SVref, are also shown in
this table. We compared differences in the parameters for the male and female groups. Only ΔD2 was significantly different.
A linear relationship between the SVref values and SVestimate
values for the male and female groups is shown in Fig. 9, and the correlation coefficients were rsv_male=0.727 and
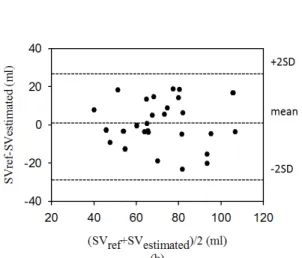
rsv_female=0.781. Figure 10 shows the Bland and Altman plot for
the differences and the mean between SVref and SVestimated. The
mean and standard deviation (mean ±SD) of the differences were 0.101±14.880 (ml) and 0.650±11.990 (ml) for the male and female groups, respectively. Moreover, the percent errors of the two groups were 15.7±7.0% and 13.6±9.8%. We found that the averages of all values were close, and all data points were within the limits of agreement, although one data point from the male group fell outside of the limits of agreement, as shown in Fig. 10 (a).
TABLE II
THE STATISTICS RESULTSOF THE SV AND ΔD2 FOR THE
MALEAND FEMALE GROUPS
Male
(n=26)
Female
(n=29)
p
SV
ref(ml)
80.6 ± 17.7
71.7±
17.8
0.067
SV
estimate(ml)
80.4 ± 21.4
71.0 ±
18.4
0.086
Ejection Fraction
(%)
71.6 ± 8.0
72.6 ±
6.9
0.605
ΔD
2(mm
2)
3.33 ± 1.4
2.52 ±
1.47
0.041
*
Data are the mean±SD, * indicates p < 0.05.
delta D2 (mm2) 0 1 2 3 4 5 6 7 de lta Var te ry ( m l) 0.5 1.0 1.5 2.0 2.5 3.0 3.5 4.0 4.5
Fig. 5. The relation between ΔD2 and ΔV
artery. The correlation
coefficient, rv=0.871.
Fig. 6. The Bland and Altman plot of the differences betweenΔD2 and
ΔVartery; the mean and standard deviation (mean ±SD) are
Time (seconds) 0.0 0.1 0.2 0.3 0.4 0.5 0.6 0.7 Pr es su re ( m m H g) 60 80 100 120 140 160
Fig. 7. Shows a pulse pressure waveform extracted from the same patient as in Fig. 1. The solid and dashed curves describing the relationship are based on the raw and curve-fitting data, respectively. The correlation coefficient is rτ=0.990.
R (a) 0 20 40 60 80 100 120 k 0.003 0.006 0.009 0.012 R (b) 0 20 40 60 80 100 120 140 k 0.003 0.006 0.009 0.012 0.015
Fig. 8. Shows the relation between k and R, the correlation coefficients, (a) male group, rmale=0.680, (b) female group, rfemale=0.706. SVestimated (ml) (a) 20 40 60 80 100 120 140 S Vre f (m l) 20 40 60 80 100 120 140 SVestimated (ml) (b) 20 40 60 80 100 120 S Vre f (m l) 20 40 60 80 100 120
Fig. 9. The linear relation between SVref values and SVestimate values for the male and female groups, (a) male group, rsv_male=0.727,SVref=0.60 . SVestimated+32.4, (b) female group, rsv_female=0.781, SVref=0.75.SVestimated+18.2.
Fig. 10. The Bland and Altman plot for the differences between SVref and SVestimated for male and female groups, (a) the mean and standard deviation (mean ±SD) is 0.101±14.880 ml for the male group, (b) the mean and standard deviation is 0.650±11.990 ml for the female group.
IV. DISCUSSIONSAND CONCLUSION
The present study aimed to describe a SV measurement method based on an oscillometric sphygmomanometer. According to the oscillometry, we not only measured the blood pressure but also measured the brachial arterial compliance. Moreover, we extracted a “good” pulse contour from the cuff pressure during the deflating cycle by the curve fitting method. Therefore, when the sphygmomanometer finishes the blood pressure measurement at approximately 35 to 40 seconds, one SV value was also measured. The results indicate that SV values obtained by our new approach were in good agreement with those measured by echocardiography. Although we did not use an invasive method to measure true reference SV values, we measured the SV three times by two-dimensional echocardiography and calculated the mean of these measurements as the reference for each patient. Christie et al. compared the correlation of SV measured by the noninvasive method, two-dimensional echocardiography, and invasive methods, thermodilution and Fick oximetry [23]. The results showed that the correlation coefficients between two-dimensional echocardiography and thermodilution, or Fick oximetry were 0.72 or 0.81, respectively. However, the correlation coefficients of the cardiac output between two-dimensional echocardiography and thermodilution, or Fick oximetry were higher at 0.88 or 0.90, respectively. The cardiac output is derived by multiplying the SV and heart rate.
We have shown that the correlation between ΔVartery and ΔD2 was acceptable. Because ΔV
artery and ΔD2could not be
measured simultaneously and the blood flow varies for each heartbeat, there is some error between ΔVartery and ΔD2. In Fig.
6, we show a Bland and Altman plot of ΔVartery and ΔD2.
Although the units of these two parameters are not the same and the mean of their difference has an offset, the offset could be adjusted close to zero when ΔD2is multiplied by the vessel
length. Moreover, the difference between ΔVartery and ΔD2 is
below the mean when the blood flow is lower. The
phenomenon could be caused by the resolution of the ultrasound scan machine.
In recent years, several studies based on the pulse contour method have attempted to provide reliable, noninvasive, continuous estimation of CO from the arterial pressure. These studies used empirical formulas [8, 24], nonlinear models based on age and gender variables [5,7], or lumped networks [12] to establish a relationship between the blood pressure and flow. Moreover, they would combine this information with the approximate mechanical properties of the aorta to estimate changes in the continuous SV. However, Romano et al. proposed that the estimation of SV by the pulse contour method does not depend on fixed variables but rather on the description of shape changes within the time domain of the whole pulse contour [8]. Their results confirmed this concept, but the k variable in their formula was also a difficult problem. Liu et al. presented a method to estimate the flow of the brachial artery with a Cartery value using the Windkessel model
[25]. For this method, the characteristics of the brachial artery must be different than those of the aorta. Thus, according to the Windkessel model, the R variable estimated by the characteristics of the brachial artery, τ and Cartery, need to be
calibrated to fit the aorta. By performing a comparison with established techniques, our results showed that this approach accurately reflects the relationship between the artery blood pressure and flow.
Langewouters et al. presented a model of the aorta for male and female groups [6]. The mean cross-sectional area of the aorta for the male group was larger than that of the female group. As shown in Table II, the SVref and ΔD2 were greater in
the male group than in the female group. Thus, our results are similar to those of Langewouters et al. However, in our study, the correlation coefficient of the female group, rsv_female=0.781,
was better than that of the male group, rsv_male=0.727. The
reason may be due to the difference in the diameter of the artery between the genders.
The linear relationship between the SVref values and
SVestimate values does not appear to be stronger than those of
previous studies [5, 7-8]. In our study, the SVestimate values
were estimated by the pulse contour and Cartery. The SVref
values were measured by two-dimensional echocardiography. Thus, there are three possible explanations. One, the blood pressure measurement by oscillometry is guesstimated [26].
ΔVartery was estimated by the cuff model and amplitude of pulse
contour. Therefore, Cartery has a higher tolerance. Second, the
previous studies compared the estimated SV with the synchronous invasive SV measurements. It is well known that the SV of each heartbeat is different, just as the blood pressure values are different for each heartbeat. In our study, we used a noninvasive SV measurement, two-dimensional echocardio -graphy, as the reference. Thus, SVestimate and SVref are not
synchronous. Third, the pulse contours are highly variable under different cuff pressures, as shown in Fig. 1. Although we defined a good pulse contour as having a best evident exponential decay within the diastolic duration, the status of a good pulse contour as a standard pulse contour remained in question. This is the same problem encountered when using
the noninvasive pulse contour to estimate the SV.
A commercial sphygmomanometer used at home can only guesstimate one systolic and diastolic pressure at each measurement. No one measures the continuous blood pressure at home because the blood pressure is used to evaluate daily changes. The purpose of our study is also to design a SV-measuring apparatus to evaluate daily changes at home. The structure of this apparatus is based on an oscillometric sphygmomanometer that can guesstimate the blood pressure, SV and cardiac output simultaneously.
REFERENCES
[1] G. P. Toorop, N. Westerhof, and G. Elzinga, "beat-to-beat estimation of peripheral resistance and arterial compliance during pressure transients," Am. J. Physio., vol. 252, pp. H1275-H1283, 1987.
[2] I. Mackenzie, I. Wilkinson, and J. Cockcroft, "Assessment of arterial stiffness in clinical practice," Q. J. Med., vol. 95, pp. 67-74, 2002. [3] J. Oliver and D. Webb, "Noninvasive assessment of arterial stiffness and
risk of atherosclerotic events," Art. Thromb. Vasc. Biol., vol. 23, pp. 554-566, 2003.
[4] K. C. Ehlers, K. C. Mylrea, C. K. Waterson, and J. M. Calkins, "Cardiac output measurements. Areview of current techniques and research," Ann. Biomed. Eng., vol. 14, pp. 219-239, 1986.
[5] K. H. Wesseling, J. C. Jansen, J. J. Settels, and J. J. Schreuder, "Computation of arrtic flow from pressure in humans using a nonlinear three-element model," J. Appl. Physiol., vol. 74, pp. 2566-2573, 1993. [6] G. J. Langewouters, K. H. Wesseling, and W. A. Goedhard, "The static
elastic properties of 45 human thoracic and 20 abdominal aortas in vitro and the parameters of a new model," J. Biomech., vol. 17, pp. 425-435, 1984.
[7] L. W. J. Bogert and J. J. Lieshout, "Non-invasive pulsatile arterial pressure and stroke volume changes from the human finger," Exp. Physiol., vol. 90, pp. 437-446, 2005.
[8] S. M. Romano and M. Pistolesi, "Assessment of cardiac output from systemic arterial pressure in human," Crit. Care. Med., vol. 30, pp. 1834-1841, 2002.
[9] R. Mukkamala, A. J. Reisner, H. M. Hojman, R. G. Mark, and R. J. Cohen, "Continuous cardiac output monitoring by peripheral blood pressure waveform analysis," IEEE Trans. Biomed. Eng., vol. 53, pp. 459-467, 2006.
[10] D. A. McDonald, Blood Flow in Arteries. London: Edward Amold., 1960.
[11] J. R. Womersley. “The mathematical analysis of the arterial circulationin a state of oscillatory motion.” WADC Tech. Rep. 1957.
[12] W. Welkowitz, Q. Cui, Y. Qi, and J. B. Kostis, "Noninvasive estimation of cardiac output," IEEE Trans. Biomed. Eng., vol. 38, pp. 1100-1105, 1991.
[13] W. Welkowitz, S. Fich, and J. J. Strano, "Cost function analysis applied to the determination of aorta parameters," J. Eng. Sci., vol. 10, pp. 1081-1091, 1972.
[14] http://www.edwards.com/products/mininvasive/pages/flotracsensor.aspx [15] http://www.healthcare.philips.com/main/products/patient_monitoring/pr
oducts/picco/
[16] http://www.lidco.com/clinical/lidco_science/cardiac.php
[17] L. A. Critchley, A. Lee, and A. Ho, "A critical review of ability of continuous cardiac output monitors to measure trends in cardiac output," Anesth. Analg., vol. 111, pp. 1180-1192, 2010.
[18] S. H. Liu, J. J. Wang, and K. S. Huang, "A New Oscillometry-Based Method for Estimating the Dynamic Brachial Artery Compliance under loaded conditions," IEEE. Trans. Biomed. Eng., vol. 55, pp. 2463-4270, 2008.
[19] G. Drzewiecki, R. Hood, and H. Apple, "Theory of the oscillometric maximum and the systolic and diastolic detection ratios," Ann. Biomed. Eng., vol. 22, pp. 88-96, 1994.
[20] M. Ursino and C. Cristalli, "Mathematical modeling of noninvasive blood pressure estimation techniques—part I: pressure transmission across the arm tissue," ASME J. Biomech. Eng., vol. 117, pp. 107-116, 1995.
[21] N. Schiller, H. Acquatella, Y. Ports, D. Drew, J. Goerke, H. Ringertz, et al., "Left ventricular volume from paired bioplane two-dimensional echocardiography," Circulation, vol. 60, pp. 547-555, 1979.
[22] D. C. Cheng and X. Jiang, "Detections of arterial wall in sonographic artery iImages using dual dynamic programming," IEEE Trans. Inf. Tech. Biomed., vol. 12, pp. 792-799, 2008.
[23] J. Christie, L. M. Sheldahl, F. E. Tristani, K. B. Sagar, M. J. Ptacin, and S. Wann, "Determination of stroke volume and cardiac output during exercise: comparison of two-dimensional and Doppler echocardiography, Fick oximetry, and thermodilution," Circulation, vol. 76, pp. 539-547, 1987.
[24] O. Gödje, K. Höke, A. E. Goetz, T. W. Felbinger, D. A. Reuter, B. Reichart, et al., "Reliability of a new algorithm for
continuous cardiac output determination by pulse-contour analysis during hemodynamic instability," Crit. Care. Med., vol. 30, pp. 52-58, 2002.
[25] S. H. Liu, D. C. Cheng, and J. J. Wang, "Estimating the mean blood flow of arm based on windkessel model," Biomedical Engineering: Applications, Basis and Communications, vol. 23, pp. 1-8, 2011.
[26] J. 1. Liu, J. O. Hahn, R. Mukkamala, “Error mechanisms of the oscillometric fixed-ratio blood pressure measurement method,” Ann Biomed Eng. vol. 41, pp587-597, 2013.
Shing-Hong Liu
received the B.S. degree in electronic engineering from the Feng-Jia University, Taichung, Taiwan, R.O.C., in 1990, the M.S. degree in biomedical engineering from the National Cheng-Kung University, Tainan, Taiwan, R.O.C., in 1992 and
the Ph.D. degree in the Department of Electrical and Control Engineering at the National Chiao-Tung University, Hsinchu, Taiwan, R.O.C., in 2002.
August 1994, he has been a Lecturer in the Department of Biomedical Engineering, Yuanpei University, Hsinchu,
Taiwan, R.O.C., and is an Associate Professor from 2002 to 2008. Now, he is a Professor in the Department of Computer Science and Information Engineering, Chaoyang University of Technology. His current research interests are digital signal processing, fuzzy control and designing biomedical instrument.
Tzu-Hsin Lin was graduated from medical school of the National Taiwan University Taiwan, R.O.C., in 1986, whose internal medicine and cardiologist were trained in the National Taiwan University Hospital, Taipei, Taiwan, R.O.C., from 1988 to 1993. He got cardiological instructor doctor since1999 and cardiac echo specialist since 2009. He was a cardiologist in the Municipal ZhongXiao Hospital, Taipei, Taiwan, R.O.C., from 1993 to 1999. Now, he is the head of cardiologist of Lin-Shin Hospital in Taichung Taiwan, R.O.C., from 1999-2015.
Da-Chuan Cheng studied Electrical Engineering (B.S) at Chinese Culture University, Taiwan, Biomedical Engineering (M.S. and Ph.D.) at National Cheng Kung University, Taiwan. He was a research assistant at the Department of Computer Science of the Albert-Ludwigs University Freiburg, Germany and a post doctor at the Department of Mathematics and Computer Science of the Westfaelische Wilhelms University Muenster, Germany. He is an associate professor at the Department of Biomedical Imaging and Radiological Science of the China Medical University, Taiwan. His research interests include medical image processing, optimisation, and object tracking in videos.
Jia-Jung Wang received the B.S. degree in 1985 and the M.S. degree in 1987 in Biomedical Engineering from Chung-Yuan Christian University, Taiwan, R.O.C. He received the M.S. degree in 1995 and the Ph.D. degree in 1996 in Biomedical Engineering from Rutgers University, New Jersey, USA. He was the Chairman of the Department of Biomedical Engineering, Yuanpei Technical College, Taiwan, from 1996 to 2000 and the Chairman of the Department of Biomedical Engineering, I-Shou University, Taiwan, from 2004 to 2007 and from 2011 to 2014. He is a Professor with the Department of Biomedical Engineering, I-Shou University, Kaohsiung, Taiwan. His research interests include the design of biomedical instrumentation, the analysis of cardiovascular signals, and the application of medical transducers.