Abstract—Over the last two decades, radiotherapy techniques have become more sophisticated. Three-dimensional (3D) dose verification is required to ensure accurate dose delivery to the planning target volume. Gel dosimeters have the potential to measure the 3D dose distribution and thus can be applicable in radiotherapy. In this study, we developed a novel DEMBIG gel dosimeter based on the 2-(Dimethylamino) ethyl acrylate (DEMA) monomer and used computed tomography (CT) to evaluate its characteristics. The DEMBIG gel was composed of 7% gelatin, 5% monomer, and 4% crosslinker. The gel response to a dose from 1 to 25 Gy was examined. The energy dependence, dose rate dependence, and spatial resolution were evaluated as well. After 24 hours post-irradiation, the DEMBIG gel reached steady state. The average sensitivity at the photon energy of 6 MV was 0.459 HU/Gy (R2=0.995). The variations in
sensitivity between 6, 10, and 15 MV photons were lower than 3%, and the difference in sensitivity between the dose rate of 100 and 600 MU/min was 28%. For a beam profile of 3×6 cm2 and 6 MV, the 80%-20% penumbra for 0/5, 0/15, and 5/15 Gy can be around 2.73, 6.24, and 2.34 mm, respectively. We conclude that the DEMBIG gel dosimeter has high linearity of R2=0.995 and high sensitivity of 0.459 HU/Gy. With CT readout, it could be used in clinical radiotherapy to verify the accuracy of 3D dose delivery.
Index Terms—Computed Tomography, DEMBIG, Gel. I. INTRODUCTION
UALITY assurance measurements of clinical radiotherapy need to explicitly include independent validation of the delivered dose and the spatial location of the dose. Current radiation measurement instruments achieve high accuracy and reliability [1]. However, these tools can only measure point or plane doses. Modern non-coplanar
Q
Manuscript received May 29, 2012. This work was supported in part by the National Science Council of Taiwan under Grant NSC 99-2632-B-166-001-MY3.
Tian Y. Shih is with the Graduate Institute of Clinical Science, China Medical University, Taichung, Taiwan. He is now with the Department of Radiology, Cheng Ching Hospital at Chung Kang, Taichung, Taiwan.
Cheng T. Shih is with the Department of Biomedical Engineering and Environmental Sciences, National Tsing-Hua University, Taiwan.
Yuan J. Chang is with the Department of Management Information Systems, Central Taiwan University of Science and Technology, Taichung, Taiwan.
Chun Y. Yu is with the Department of Radiation Oncology, China Medical University Hospital, Taichung, Taiwan. He is now with the Biomedical Engineering and Environmental Science, Tsing-Hua University, Taiwan.
Bor T. Hsieh is with the Institute of Radiological Science, Central Taiwan University of Science and Technology, Taichung, Taiwan.
Shu J. Chang is with the Health Physics Division, Institute of Nuclear Energy Research, Taoyuan, Taiwan.
Ji A. Liang is with the Department of Radiation Oncology, China Medical University Hospital, Taichung, Taiwan. He is now with the College of Medicine School, China Medical University, Taichung, Taiwan.
*Jay Wu is the corresponding author. He is with the Department of Biomedical Imaging and Radiological Science, College of Health Care, China Medical University, Taichung, Taiwan. (phone: 886-4-2205-3366 #7809; fax: 886-4-2205-3366; e-mail: jwu@mail.cmu.edu.tw).
radiotherapy techniques are progressing toward more complex three-dimensional (3D) dose delivery. Thus, a dosimetric system with 3D imaging capabilities would be extremely valuable for treatment quality assurance. Of the options available, polymer gels have the potential to be applied in clinical practice.
The development of readout techniques for gel dosimeters and the characteristic analysis of polymer gels [2] are both important. In the readout techniques, optical computed tomography scanning [3]-[4], based on the photo-absorbency characteristic, can obtain high-resolution and high-sensitivity dose distribution. It is regarded as the standard practice for reading gel dosimeters. Using magnetic resonance imaging (MRI) on gels is another popular choice. After irradiation, water molecules and monomers are combined to form the macromolecular proton group. By using the multiple spin echo pulse sequence, the spin-spin relaxation rate (R2), which is a function of absorbed doses, can be measured [5]-[6]. In recent years, the advancement and widespread use of computed tomography (CT) scanners have provided a more immediate and convenient way for analyzing gel dosimeters [7]-[12]. The dosimetric results can be applied to verify the clinical acceptance of treatment planning by gamma evaluation. The gamma pass rate (3% and 3 mm) of 93.4% was reported for an IMRT study using CT scan on a new N-isopropylacrylamide- based gel recipe [13].
Polymer gels consisting of monomers in an aqueous gel matrix undergo polymerization after irradiation. The reaction rate is proportional to the radiation dose. Acrylamide is the most commonly used monomer. However, it is neurotoxic [14] and thus unsuitable for clinical use. The 2-(Dimethylamino) ethyl acrylate monomer has a lower toxicity and higher sensitivity; thus, it is a potentially useful monomer for gel dosimeters [15].
In this study, we proposed a new gel dosimeter, using 2-(Dimethylamino) ethyl acrylate (DEMA) as the monomer, named as DEMBIG (2-(Dimethylamino) ethyl acrylate,
N’N’-methylene-bisacrylamide, Gelatin). CT scanning was
used to determine the dose response, energy dependence, and dose-rate dependence. Furthermore, the spatial resolution was estimated. Through a detailed characterization analysis, we can evaluate the feasibility of using the DEMBIG gel and the CT readout as a 3D dose measurement tool for clinical usage.
II.MATERIALS AND METHODS
A. Preparation of the DEMBIG Gel
The proposed DEMBIG gel used 2-(Dimethylamino) ethyl acrylate as the monomer. The ratio of the gelatin, monomer, and crosslinker (N’N’-Methylendiacrylamid) was 7:5:4. The
Evaluating the Characteristics of a Novel
DEMBIG Gel Dosimeter Using Computed
Tomography
Tian Y. Shih, Cheng T. Shih, Yuan J. Chang, Chun Y. Yu, Bor T. Hsieh, Shu J. Chang, Ji A. Liang, and Jay Wu
gel was prepared under the anaerobic environment inside a glove box and injected into 12-ml vials (Pyrex, No. 9826, USA) which were then wrapped in foil to prevent exposure to light and left at 4 C environment for 48 hours to solidify.
B. Irradiation of the DEMBIG Gel
The vial containing the gel was placed at the center of a 151515 cm3 PMMA phantom. A medical linear accelerator
(Varian Clinic 21 IX, Varian, USA) was used to irradiate the gel with a field size of 1515 cm2 and bidirectionally from
90 and 270, as shown in Fig. 1.
C. Dose Response Stability
The gel undergoes polymerization reaction for a period of time after irradiation. Therefore, a delay in obtaining readings following irradiation can increase the stability of the gel response. Every three gel tubes were combined into a group which was administered radiation doses from 1Gy to 25 Gy with the 6 MV modality at 400 MU/min. The gels were measured after 1, 3, 6, 12, 24, 48, 72, and 96 hours, respectively, to determine the optimum post-irradiation time required to stabilize the DEMBIG gel.
D. Energy Dependence and Dose-Rate Dependence
The DEMBIG gel was irradiated with 6 MV, 10 MV, and
15 MV photons at the dose rate of 400 MU/min, and given absorbed doses of 1, 2, 5, 8, 10, 15, 20, and 25 Gy, respectively. The dose response curves under the three
energy levels were compared. Furthermore, to assess the dose-rate dependence, 1 to 25 Gy absorbed doses were administered with the 6 MV modality at the dose rates of 100, 200, 300, 400, 500, and 600 MU/min, respectively. The sensitivity of the gel dosimeter is defined as follows:
HU ( ) Gy CTN sensitivity dose (1)
where ΔCTN is the change of CT numbers (in Hounsfield Unit). The higher the sensitivity in identical doses, the more apparent the increase in CTN. The average sensitivity is
defined as the average slope over the dose range. The linearity of the dose response curve was determined by single factor linear data regression. The linear correlation coefficient (R2) was used as an indicator.
E. Spatial Resolution
The DEMBIG gel was filled in a cylindrical phantom with 9 cm in diameter and 10 cm in height. 5 Gy and 15 Gy doses were administered with the 6 MV modality at 400 MU/min to the center of 3×6 cm2 radiation fields at a depth of 5 cm and
the SAD of 100 cm, respectively. The 80%-20% penumbra was estimated to determine the spatial resolution of the DEMBIG gel. In addition, a set of 2D diode detectors, (PROFILER 1170, Sun Nuclear, USA) was also used for comparison.
F. CT Readout and Image Analysis
A CT scanner (Asteion 4, Toshiba, Japan) was used to acquire the sectional images of the irradiated gel. The scanning parameters were 120 kVp, 150 mAs, and a slice thickness of 6 mm. A radius of 3 mm from the center of the gel vial was selected as the region of interest (ROI). The CT image of the DEMBIG gel before irradiation was used for subtraction. The average CTN and the standard deviation were calculated.
III. RESULTS
Fig. 2 shows the dose response for the 6 MV modality and 400 MU/min at various times after irradiation with 1 to 25 Gy. During the first 10 hours, CTN increased rapidly, indicating continuous polymerization. After 20 hours, the polymerization reaction gradually ceased and the readings stabilized. Moreover, the gel can maintain stable even after a 96-hour delay. The maximum deviation of readouts after 24 hours for all doses is around 4%. Therefore, the DEMBIG gel should be readout at least 24 hours after irradiation. This post-irradiation time was adopted to subsequent exams during the study.
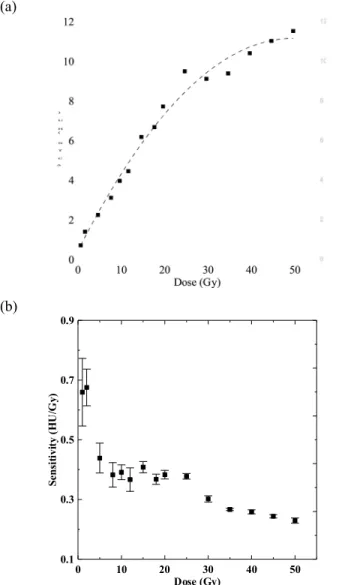
Fig. 3 displays the dose response curves and the sensitivity of the DEMBIG gel irradiated with 6 MV photons at 400 MU/min with a dose range from 1 to 50 Gy. Through the polynomial regression, the R2 was 0.985 for the whole dose
range. The R2
Fig. 1. The DEMBIG gel was placed at the center of a 151515 cm3
PMMA phantom and was irradiated by the linear accelerator from 90o and
Fig. 2. The dose response for the 6 MV modality and 400 MU/min at various post-irradiation times for (□) 1 Gy, (△) 5Gy, (▲) 10 Gy, (■) 15 Gy, (○) 20 Gy, and (●) 25 Gy . After 24 hours, the CTN for all absorbed doses tended toward stable and maintained even after a four-day delay. (a) (b) 0 10 20 30 40 50 Dose (Gy) 0.1 0.3 0.5 0.7 0.9 Se n si ti vi ty (H U /G y)
Fig. 3. (a) The dose response curves for the 6 MV modality at 400 MU/min ranging from (dashed line) 1 to 50 Gy (polynomial fitting,
R2=0.985) and (solid line) 1 to 25 Gy (linear fitting, R2= 0.995). (b) The
sensitivity decreased as the dose increased from 1 to 50 Gy. The DEMBIG gel irradiated with 1 to 25 Gy had better linearity and average sensitivity than irradiated with 1 to 50 Gy.
further reached 0.995 when we narrowed the dose range to 1 to 25 Gy and used linear regression, which indicates that the DEMBIG gel has good linearity below 25 Gy, and the gel tends toward saturation at the higher dose level. This could be due to the limited amount of the monomer and crosslinker in the gel matrix. The dose uncertainty for 1 standard deviation at 10 Gy is about 6.08%. Fig. 3b shows that the sensitivity decreased as the dose increased. The average sensitivity was 0.334 HU/Gy for the dose range of 1 to 50 Gy, while it was 0.459 HU/Gy for the dose range of 1 to 25 Gy.
Fig. 4 shows the percent residual graph away from the linear fitted dose response curve drawn in fig. 3a (solid line) for different megavoltage modalities at 400 MU/min. When the dose increased to 5 Gy and above, the residuals for 6, 10, and 15 MV modalities were all lower than 10%. The linear correlation coefficient R2 for the linear fits of the three
energy levels was 0.995, 0.994, and 0.997, respectively, and the average sensitivity was 0.459, 0.450, and 0.467 HU/Gy, (a) (b) 0 5 10 15 20 25 Dose (Gy) 0 0.2 0.4 0.6 0.8 1 S en si ti vi ty (H U /G y)
Fig. 4. (a) The percent residuals away from the linear fitted dose response curve in fig. 3a and (b) the sensitivity for (○) 6 MV, (□) 10 MV, and (◇) 15 MV modalities at 400 MU/min. The R2 values of dose response curves for
6, 10, and 15 MV are 0.995, 0.994 and 0.997, respectively. The DEMBIG gel had negligible energy dependence.
indicating that the energy dependence of the DEMBIG gel is minimal.
Fig. 5 shows the dose response curves and the average sensitivity of various dose rates at the energy level of 6 MV.
The R2 values for all dose rates exceeded 0.990. The
sensitivity increased with the increasing dose rate. The difference in average sensitivity between 100 MU/min and 600 MU/min was 28%, indicating that the degree of polymerization of the DEMBIG gel is related to the dose rate.
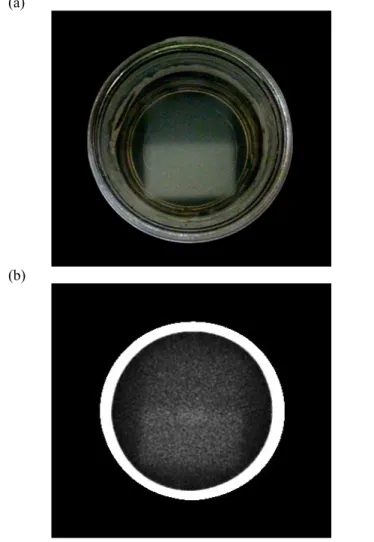
Fig. 6 shows the photograph and the CT image of the gel phantom irradiated with the 6 MV modality at 400 MU/min. Before image analysis, we employed a 33 median filter to reduce noise and enhance the signal to noise ratio (SNR) of the CT image. The field boundaries were clearly seen. Fig. 7 displays the profiles at the edge of the radiation fields after administered doses of 5 and 15 Gy. The 80%-20% penumbra at 0/5, 0/15, and 5/15 Gy profiles was 2.73 mm, 6.24 mm, and 2.34 mm, respectively, while the penumbra of 0/5 Gy estimated by PROFILER was 5.14 mm. The 0/5 and 0/15 Gy profiles measured by gels were boarder than the 5/15 Gy profile and had slightly left-shifting. This may be due to the ion diffusion effect from the irradiated region to the non-irradiated region. Table I compares the prescribed dose and the measured dose as well as their uncertainties at the center of the two irradiated fields using the DEMBIG gel dosimeter (a) 0 5 10 15 20 25 Dose (Gy) 0 2 4 6 8 10 12 C T N (H U ) (b) 0 5 10 15 20 25 Dose (Gy) 0 2 4 6 8 10 12 C T N (H U ) (c)
Fig. 5. The dose response curves of the DEMBIG gel for the 6 MV modality at (a) (○) 100, (□) 200, and (◇) 300 MU/min and (b) (●) 400, (■) 500, and (◆) 600 MU/min. The R2 values for all dose rates were larger than 0.990. (c) The average sensitivity levels at various dose rates. The sensitivity increased with the increasing dose rate, indicating dose rate dependence.
(a)
(b)
Fig. 6. (a) The photograph and (b) the CT image of the irradiated DEMBIG gel. Two 3×6 cm2 radiation fields were irradiated with the 6
MV modality at 400 MU/min. 5 Gy and 15 Gy were given at a depth of 5 cm, respectively. The interface between them was clearly seen.
with a dose response function of y = 0.349 x + 0.453, where y is the ΔCTN in HU and x is the dose in Gy. The dose differences between the treatment planning system and the
DEMBIG gel were all within 4%. IV. DISCUSSION
The gel dosimeter requires a time delay for it to be stabilized after exposure to radiation. Deene et al. [16] pointed out that the post-irradiation time and its effect on sensitivity are related to the type of monomers and the production of gels. The n-NIPAM gel requires an elapsed time of 48 hours before readings can be obtained [17], and the PAGAT gel remains unstable even 24 days after irradiation [18]. By contrast, the dose response of the DEMBIG gel becomes stable after 24 hours and can be maintained for at least 96 hours. These results mean that the DEMBIG gel offers a shorter post-irradiation time.
When the dose range reduced from 1~50 Gy to 1~25 Gy, the linearity of the DEMBIG gel increased markedly. This means that the DEMBIG gel is more suitable for low- to medium -dose measurements. This characteristic is similar to that of the PAG, BANG, and n-NIPAM gels [19]. To measure higher dose levels, the DEMBIG gel must be used in combination with other gels, such as the MAGIC gel [10].
At the megavoltage modalities studied, the linearity of the DEMBIG gel did not differ significantly. The slope variations of the linear fit were lower than 3%. This is because high-energy photons interact with materials mainly according to the Compton effect, which is related to the electron density. The effective atomic number of the
DEMBIG gel is 7.32 and the electron density is 3.3284×10²³,
which are similar to those of water (Zeff=7.42 and
ρe=3.3415×10²³). Additionally, the stopping power ratio and
energy absorption ratio of DEMBIG to water at 6 MV were 0.986 and 0.990, respectively. Therefore, the water equivalence of the DEMBIG gel can be achieved.
At the dose rate commonly used in radiotherapy, we found that the DEMBIG gel had significant dose-rate dependence. The possible reason is that free radicals from water molecules form at a rate proportional to the dose rate. The higher the concentration of free radicals, the more intense the polymerization is. Regarding common gel dosimeters [20], nMAG has 66% variation, PAG has 12% variation, and n-NIPAM has 33% variation [18]. Comparatively, the dose-rate dependence of the DEMBIG gel is not severe. However, this point on dose-rate dependence could be a real detriment of the current proposal.
The major advantage of gel dosimeters is their 3D dose measurement capability. However, noise and molecular diffusion problems [21] may reduce the spatial resolution. We used a 33 median filter in this study to eliminate the noise while maintaining the spatial resolution. If a 55 median filter is employed, although the SNR of the CT image can be increased, the penumbra also increases. Therefore, using appropriate filters and choosing suitable parameters for the applied filter are necessary. Special designed adaptive filters may also be used for noise reduction [22]. The slice thickness of CT scan can also affect the penumbra width. Thinner slice may provide less penumbra.
The sensitivity of gel dosimeters is related to the amount of the total monomer (%T) and gelatin. When the percent ratio of the gelatin is smaller than %T, the gel is difficult to solidify. However, an excessively high gelatin ratio reduces the sensitivity [16]. The DEMBIG gel used in this study has a ratio of 7:5:4 for the gelatin, monomer, and crosslinker. Through additional research into gel formula optimization, the DEMBIG gel may provide more superior spatial resolution, sensitivity, and dose-rate dependence in the future.
V.CONCLUSION
In this study, we proposed a new DEMBIG gel dosimeter and used CT Hounsfield Units readout for dose measurement. After 24-hour post-irradiation, the DEMBIG gel provides a stable readout with 4% maximum deviation. The high linearity of R2=0.995 and high sensitivity of 0.459 HU/Gy
can be achieved for 6 MV and 400 MU/min at the dose range of 1 to 25 Gy. The 80%-20% penumbra for 0/5, 0/15, and 5/15 Gy profiles can be around 2.73, 6.24, and 2.34 mm.
Additionally the observed DEMBIG energy dependence is negligible between 6 and 15 MV although sensitivity can vary up to 30% with dose rates. Therefore, the DEMBIG gel with CT readout is a promising technique for radiation therapy quality assurance.
ACKNOWLEDGMENT
The authors would like to thank the National Science Council of Taiwan for financially supporting this research Fig. 7. The profiles of the (□) 0/5 Gy, (○) 0/15 Gy, and (◇) 5/15 Gy
interfaces for the 6 MV modality at 400 MU/min. The profile measured by PROFILER was also provided (Δ) for comparison.
TABLE I
COMPARISONOFTHE PRESCRIBED DOSEANDTHE MEASURED DOSE Prescribed
dose Outputuncertainty Measured dose Difference (%) Measured uncertainty
5 Gy 0.43% 4.8 Gy 4.0% 6.6%
under Contract no. NSC 99-2632-B-166-001- MY3. REFERENCES
[1] D. A. Low, J. M. Moran, J. F. Dempsey, L. Dong, and M. Oldham, “Dosimetry tools and techniques for IMRT,” Med. Phys., vol. 38, no. 3, pp. 1313-1338, Mar. 2011.
[2] Y. De Deene, “Essential characteristics of polymer gel dosimeters,” J.
Phys. Conf. Ser., vol. 3, no. 34, pp. 34-57, Sep. 2004.
[3] S. J. Doran, K. K. Koerkamp, M. A. Bero, P. Jenneson, E. J. Morton, and W. B. Gilboy, “A CCD-based optical CT scanner for high-resolution 3D imaging of radiation dose distributions: equipment specifications, optical simulations and preliminary results,” Phys. Med. Biol., vol. 46, no. 12, pp. 3191-3213, Dec. 2001.
[4] J. C. Gore, M. Ranade, M. J. Maryañski, and R. J. Schulz, “Radiation dose distributions in three dimensions from tomographic optical density scanning of polymer gels: I. Development of an optical scanner,” Phys.
Med. Biol., vol. 41, no. 12, pp. 2695-2704, Dec. 1996.
[5] M. Oldham, J. H. Siewerdsen, A. Shetty, and D. A. Jaffray, “High resolution gel-dosimetry by optical-CT and MR scanning,” Med. Phys., vol. 28, no. 7, pp. 1436-1445, Jul. 2001.
[6] M. Lepage, A. K. Whittaker, L. Rintoul, S. A. Bäck, and C. Baldock, “The relationship between radiation-induced chemical processes and transverse relaxation times in polymer gel dosimeters,” Phys. Med. Biol., vol. 46, no. 4, pp. 1061-1074, Apr. 2001.
[7] C. Audet, M. Hilts, A. Jirasek, and C. Duzenli, “CT gel dosimetry technique: comparison of a planned and measured 3D stereotactic dose volume,” J. Appl. Clin. Med. Phys., vol. 3, no. 2, pp. 110-118, Spr. 2002. [8] P. Baxter, A. Jirasek, and M. Hilts, “X-ray CT dose in normoxic polyacrylamide gel dosimetry,” Med. Phys., vol. 34, no. 6, pp. 1934-1943, Jun. 2007.
[9] S. L. Dong, T. C. Chu, H. M. Yu, Y. S. Wu, Y. H. Yeh, G. Y. Lan, Y. C. Lin, H. E. Wang, and S. H. Yen, “Investigation of polymer BANG gel dosimetry using X-ray computed tomographic imaging,” J. Med. Bio.
Eng., vol. 25, no. 1, pp. 1-6, Feb. 2005.
[10] B. Hill, A. Venning, and C. Baldock, “The dose response of normoxic polymer gel dosimeters measured using X-ray CT,” Br. J. Radiol., vol. 78, no. 931, pp. 623-630, Jul. 2005.
[11] M. Hilts, C. Audet, C. Duzenli, and A. Jirasek, “Polymer gel dosimetry using x-ray computed tomography: a feasibility study,” Phys. Med.
Biol., vol. 45, no. 9, pp. 2559-2571, Sep. 2000.
[12] M. Hilts, A. Jirasek, and C. Duzenli, “Technical considerations for implementation of x-ray CT polymer gel dosimetry,” Phys. Med. Biol., vol. 50, no. 5, pp. 1727-1745, Apr. 2005.
[13] H. Johnston, M. Hilts, J Carrick, and A. Jirasek, “An x-ray CT polymer gel dosimetry prototype: II. Gel characterization and clinical
application,” Phys. Med. Biol., vol. 57, no. 10, pp. 3155-3175, May 2012.
[14] Material Safety Data Sheet (MSDS), version 1.11 updated 02/01/2006, Sigma Aldrich Co. http://www.sigmaaldrich.com/.
[15] B. T. Hsieh, C. T. Chiang, P. H. Hung, C. H. Kao, and J. A. Liang, “Preliminary investigation of a new type of propylene based gel dosimeter (DEMBIG),” J. Radioanal. Nucl. Chem., vol. 288, no. 3, pp. 799-803, Feb. 2011.
[16] Y. De Deene, P. Hanselaer, C. De Wagter, E. Achten, W. De Neve, “An investigation of the chemical stability of a monomer/polymer gel dosimeter,” Phys. Med. Biol., vol. 45, no. 4, pp. 859-878, Apr. 2000. [17] K. Y. Chang, T. Y. Shih, B. T. Hsieh, S. J. Chang, Y. L. Liu, T. H. Wu,
and J. Wu, “Investigation of the dose characteristics of an n-NIPAM gel dosimeter with computed tomography,” Nucl. Instrum. Meth. A, vol. 652, no. 1, pp. 775-778. Oct. 2011.
[18] A. J. Venning, B. Hill, S. Brindha, B. J. Healy, and C. Baldock, “Investigation of the PAGAT polymer gel dosimeter using magnetic resonance image,” Phys. Med. Biol., vol. 50, no. 16, pp. 3875-3888, Aug. 2005.
[19] M. Hilts, A. Jirasek, and C. Duzenli, “Effects of gel composition on the radiation induced density change in PAG polymer gel dosimeters: a model and experimental investigations,” Phys. Med. Biol., vol. 49, no. 12, pp. 2477-2490, Jun. 2004.
[20] Y. De Deene, K. Vergote, C. Claeys, C. De Wagter, “The fundamental radiation properties of normoxic polymer gel dosimeters: a comparison between a methacrylic acid based gel and acrylamide based gels,” Phys.
Med. Biol., vol. 51, no. 3, pp. 653-673, Feb. 2006.
[21] G. Massillon-JL, R. Minniti, C. G. Soares, M. J. Maryanski, and S. Robertson, “Characteristics of a new polymer gel for high-dose gradient dosimetry using a micro optical CT scanner,” Appl. Radiat. Isot., vol. 68, no. 1, pp. 144-154, Jan. 2010.
[22] M. Hilts and A. Jirasek, “Adaptive mean filtering for noise reduction in CT polymer gel dosimetry,” Med. Phys., vol. 35, no. 1, pp. 344-355, Jan. 2008.