DOI: 10.1542/peds.2006-2089D
2007;119;S12-S21
Pediatrics
Jihong Liu, Janice C. Probst, Amy B. Martin, Jong-Yi Wang and Carlos F. Salinas
The National Survey of Children's Health
Disparities in Dental Insurance Coverage and Dental Care Among US Children:
http://www.pediatrics.org/cgi/content/full/119/Supplement_1/S12
located on the World Wide Web at:
The online version of this article, along with updated information and services, is
rights reserved. Print ISSN: 0031-4005. Online ISSN: 1098-4275.
Grove Village, Illinois, 60007. Copyright © 2007 by the American Academy of Pediatrics. All and trademarked by the American Academy of Pediatrics, 141 Northwest Point Boulevard, Elk publication, it has been published continuously since 1948. PEDIATRICS is owned, published, PEDIATRICS is the official journal of the American Academy of Pediatrics. A monthly
SUPPLEMENT ARTICLE
Disparities in Dental Insurance Coverage and Dental
Care Among US Children: The National Survey of
Children’s Health
Jihong Liu, ScDa, Janice C. Probst, PhDa,b, Amy B. Martin, PhDa,b, Jong-Yi Wang, PhDb, Carlos F. Salinas, DMDc
aArnold School of Public Health, andbSouth Carolina Rural Health Research Center, University of South Carolina, Columbia, South Carolina;cCollege of Dental Medicine, Medical University of South Carolina, Charleston, South Carolina
The authors have indicated they have no financial relationships relevant to this article to disclose.
ABSTRACT
OBJECTIVES.We sought to understand disparities in dental insurance coverage and dental care among US children by race/ethnicity, urban/rural residence, and socioeconomic status.
METHODS.Linked data from the National Survey of Children’s Health and Area Resource File were analyzed (N ⫽ 89 071). Multiple logistic regression analysis was used to adjust for confounders.
RESULTS.A total of 22.1% of US children lacked parentally reported dental insurance coverage in the preceding year, 26.9% did not have a routine preventive dental visit, and 5.1% had parentally perceived unmet need for preventive dental care. US-born minority children were less likely to lack dental insurance than US-born white children; however, foreign-born Hispanic children were more likely to be uninsured. Rural children were more likely to be uninsured than urban children. Children with health insurance were more likely to have dental coverage. Chil-dren who lacked dental insurance were less likely to have received preventive care and more likely to have unmet need for care. Compared with US-born white children, all minority children were less likely to receive preventive care. These disparities were exacerbated among foreign-born children. Fewer race-based dis-parities were found for unmet need for dental care. Only black children, both US-and foreign-born, had higher odds of unmet need for preventive services than US-born white children. Poor dental health was strongly associated with unmet need. Disparities in dental insurance coverage and dental care are also evident by family socioeconomic status.
CONCLUSIONS.Poor and minority children were less likely to receive preventive dental care, even when insurance status was considered. Rural children were less likely to have dental insurance than urban children. Foreign birth affected insurance status for Hispanic children and use of preventive services for all minority children.
www.pediatrics.org/cgi/doi/10.1542/ peds.2006-2089D
doi:10.1542/peds.2006-2089D
Key Words
oral health, CSHCN, foreign-born, minorities, rural health
Abbreviations
NSCH—National Survey of Children’s Health
ARF—Area Resource File SES—socioeconomic status
CSHCN— children with special health care needs
OR— odds ratio aOR—adjusted odds ratio CL— confidence limit
Accepted for publication Sep 15, 2006
Address correspondence to Jihong Liu, ScD, 800 Sumter St, HESC 208C, University of South Carolina, Columbia, SC 29208. E-mail: jliu@gwm.sc.edu
PEDIATRICS (ISSN Numbers: Print, 0031-4005; Online, 1098-4275); published in the public domain by the American Academy of Pediatrics
C
HILDREN’S ORAL HEALTH in the United States has improved over recent decades, yet numerous stud-ies have documented profound disparitstud-ies.1Eightyper-cent of dental disease among children is found in 20% to 25% of children (⬃18 million), and these are primarily children from black, Hispanic, American Indian/Alaskan Native, and low-income families.2Poor children
experi-ence nearly 12 times as many restricted activity days from dental diseases as do children from higher income families.3
Disparities in access to dental care reflect family in-come, parental education, race/ethnicity, and urban/ rural residence.4–6In 2004, an estimated 6.6% of
Amer-ican children 2 to 17 years of age had an unmet dental need, and 13.1% had not seen a dentist in ⬎5 years.7
Dental care was identified as the most prevalent unmet health need in US children,8 and rural children have
greater unmet dental need than do their urban peers.4,6
Failure to obtain preventive dental care was more com-mon acom-mong the children who came from low-income families, who were uninsured and non-Hispanic white, and who had a parent with less than a college educa-tion.9,10Yet, Oral Health in America: A Report of the Surgeon
General1 specifically calls for more data on dental care
among diverse segments of the US population to elinate health disparities, including racial and ethnic mi-norities, rural population, individuals with disabilities, immigrants, migrant workers, and the very young.
Our research examined disparities in dental insurance coverage and dental care among US children by race/ ethnicity, socioeconomic status, and urban/rural resi-dence. Our secondary goal was to examine factors asso-ciated with dental care among US children. Dental care is a major component of child health care costs, repre-senting approximately one quarter of US dental spend-ing.11Better understanding of disparities in access to care
among children, and subsequent development of inter-vention programs, will ultimately help save health costs and improve overall health for the next generation.
DATA AND METHODS Data Sources and Population
We used cross-sectional data from the National Survey of Children’s Health (NSCH) (N⫽ 102 353), a telephone survey described briefly by Kogan and Newacheck in this issue,12with in-depth information available elsewhere.13
To obtain information on the supply of dentists at county level, we supplemented the NSCH with the data from the Area Resource File (ARF).
Children 1 through 17 years of age who had natural teeth at the interview time were the population of in-terest. We excluded 5873 children who were ⬍1 year old or had no natural teeth, 2769 with no parental responses to dental outcomes, and 3619 with missing information on any covariates except household
in-come. After linking the NSCH data to the ARF data, another 1021 children were excluded because of missing data on the urban/rural residence definition in the ARF. No significant changes in sample characteristics before and after this ARF linkage were observed. Thus, the final sample included 89 071 children. Human subjects re-view was not required for this study.
Outcome Measures
Dental Insurance Coverage
Parents or guardians of the child were asked whether the child has insurance that helps pay for routine dental care, including cleanings, radiographs, and examina-tions. Although health insurance was characterized in the NSCH as public, private, and none, information on type of coverage was not available for dental insurance.
Preventive Dental Care
The respondents were asked “during the past 12 months . . . did the child see a dentist for any routine preventive dental care, including checkups, screenings, and sealants? Include all types of dentists such as orth-odontists, oral surgeons and all other dental specialists.” A negative response was classified as failure to receive preventive dental care in the past 12 months.
Parentally Perceived Unmet Need for Dental Care
This measure combined responses to 2 questions. The first question is “during the past 12 months . . . , was there any time when the child needed routine preven-tive health care?” An affirmapreven-tive response was followed with another question “did he/she receive all the routine preventive dental care he/she needed?” A child was determined as having parentally perceived unmet need for preventive dental care if parents answered that the child needed the care but did not receive it.
Primary Independent Variables
Race/Ethnicity
Children were grouped into Hispanic, non-Hispanic white, non-Hispanic African American, and non-His-panic others (hereafter, Hisnon-His-panic, white, black, and oth-ers, respectively).13
Urban/Rural Residence
Residence information is not available in the public use data set to protect respondent confidentiality. We ac-cessed residence data through the Research Data Center at the National Center for Health Statistics. “Urban” was defined as living in a metropolitan statistical area; all other places were classified as “rural”.
Socioeconomic Status
Socioeconomic status (SES) was measured by household poverty status and the highest level of parental
educa-tion. Poverty status used 4 categories based on the fed-eral poverty guidelines: poor (⬍100% of the federal poverty level), near poor (100%–199%), middle income
TABLE 1 Factors Associated With Lack of Dental Insurance Coverage in Children 1 to 17 Years of Age: National Survey of Children’s Health (Nⴝ 89 071)
Lack of Dental Insurance Coverage
Bivariate Model Multivariate Modela
% P Crude OR 95% CLs aORa 95% CLs Total 22.07 — — — — Predisposing factors Age, y .0002 1–5 23.04 1.00 1.00, 1.00 1.00 1.00, 1.00 6–11 20.67 0.87 0.81, 0.93 0.81 0.75, 0.87 12–17 22.66 0.98 0.91, 1.05 0.91 0.84, 0.98 Gender .6718 Male 21.97 1.00 1.00, 1.00 1.00 1.00, 1.00 Female 22.18 1.01 0.96, 1.07 1.02 0.96, 1.09
Race/ethnicity and nativity ⬍.0001
White, US born 21.24 1.00 1.00, 1.00 1.00 1.00, 1.00
White, foreign born 17.92 0.81 0.60, 1.09 0.70 0.52, 0.95
Hispanic, US born 25.31 1.26 1.15, 1.37 0.76 0.67, 0.87
Hispanic, foreign born 66.78 7.45 6.22, 8.93 2.09 1.59, 2.76
Black, US born 15.32 0.67 0.60, 0.75 0.60 0.54, 0.68
Black, foreign born 22.25 1.06 0.59, 1.90 0.87 0.45, 1.68
Other, US born 17.76 0.80 0.69, 0.93 0.75 0.64, 0.88
Other, foreign born 23.08 1.11 0.72, 1.72 0.94 0.62, 1.44
Total No. of children in the household .5345
0–2 22.21 1.00 1.00, 1.00 1.00 1.00, 1.00 ⱖ3 21.86 0.98 0.92, 1.04 0.87 0.81, 0.94 Family structure ⬍.0001 2 parents, biological 22.94 1.00 1.00, 1.00 1.00 1.00, 1.00 2 parents, step 17.71 0.72 0.65, 0.81 0.70 0.62, 0.79 Single mother 21.08 0.90 0.84, 0.96 0.87 0.80, 0.95 Other 23.86 1.05 0.93, 1.19 1.01 0.88, 1.17
Highest education in the household ⬍.0001
Less than high school 35.92 2.28 2.02, 2.57 1.26 1.07, 1.48
High school 24.19 1.30 1.21, 1.38 1.00 0.93, 1.08
More than high school 19.76 1.00 1.00, 1.00 1.00 1.00, 1.00
Primary language spoken at home ⬍.0001
English 19.82 1.00 1.00, 1.00 1.00 1.00, 1.00
Not English 38.74 2.56 2.33, 2.82 1.33 1.12, 1.56
Need factors
Child’s dental health ⬍.0001
Fair, poor 31.66 1.73 1.57, 1.92 1.27 1.12, 1.44 Good, excellent 21.09 1.00 1.00, 1.00 1.00 1.00, 1.00 CSHCN ⬍.0001 Yes 18.11 0.74 0.69, 0.80 0.92 0.85, 0.99 No 22.97 1.00 1.00, 1.00 1.00 1.00, 1.00 Enabling factors
Household poverty status ⬍.0001
⬍100% 27.79 1.85 1.68, 2.04 1.61 1.39, 1.87 100%–200% 24.62 1.57 1.45, 1.70 1.31 1.18, 1.45 200%–400% 19.79 1.18 1.10, 1.27 1.11 1.02, 1.20 ⬎400% 17.25 1.00 1.00, 1.00 1.00 1.00, 1.00 Missing 28.57 1.92 1.72, 2.14 1.44 1.27, 1.63 Parent’s health ⬍.0001 Fair, poor 25.68 1.26 1.15, 1.37 1.01 0.91, 1.12 Good, excellent 21.54 1.00 1.00, 1.00 1.00 1.00, 1.00
Types of health insurance ⬍.0001
Private 17.52 1.31 1.21, 1.42 1.64 1.48, 1.81
Public 13.96 1.00 1.00, 1.00 1.00 1.00, 1.00
(200%–399%), and higher income (ⱖ400%). A fifth category, missing, was used to retain approximately 9% of children with missing information on household in-come. Parental education was examined in 3 categories: low (less than high school), medium (high school), and high (above high school).
Analytical Model
We adopted the health behavior model proposed by Aday and Andersen as the conceptual framework for the analysis.14 According to this model, the use of health
services depends on characteristics that predispose indi-viduals to use services, enable indiindi-viduals to secure ser-vices, or create a need for their use. In our analysis, the predisposing factors included were age, gender, race/ ethnicity, total number of children in the household, family structure, parental education, nativity, and pri-mary language spoken at home. For enabling factors, we included household poverty status, parent’s health sta-tus, dental health insurance, presence and type of health insurance, urban/rural residence, region of residence, and dentist shortage at county level. Two need factors were considered: child’s reported dental health and whether the child had special health care needs (CSHCN). CSHCN was selected because they have been found to have greater unmet dental need, particularly for rural residents.6
Statistical Analysis
Analyses were performed by using SAS-callable SUDAAN to account for the complex survey design.15All
descriptive analyses report weighted percentages, and all bivariate and multivariate statistics reflect survey weights. The2statistic was used to assess whether the
sample characteristics differed by race/ethnicity. Multi-ple logistic regression models were used to examine disparities in dental insurance coverage, receipt of pre-ventive dental care, and unmet need for dental care by
race/ethnicity, urban/rural residence, and SES after ad-justment for other covariates.
We anticipated that the effect of race/ethnicity would vary by the nativity of the child, because Medicaid eli-gibility depends on citizenship or legal residency status.16
Immigrant children who entered the United States after August 22, 1996, are not eligible for Medicaid.17
Prelim-inary analyses revealed a statistically significant interac-tion between race and nativity of the child (US- versus foreign-born). To present the results of this interaction clearly, race-nativity was combined into a single, 8-cat-egory variable.
We conducted collinearity diagnostic analyses be-tween independent variables according to standard ap-proaches before examining the logistic regression mod-els. We first estimated crude odds ratios (ORs) for each variable. Then, a forward modeling strategy was used, adding predisposing factors, need factors, and enabling factors into the models sequentially. Because estimates from the first 2 incremental models were not substan-tially different from those in the full model, we only present crude ORs, plus adjusted ORs (aORs) and 95% confidence limits (CLs) from the full model.
RESULTS
In 2003,⬃1 of 10 children in the United States reported having self-reported fair or poor dental health (9.4%). The prevalence of fair or poor dental health was the highest among Hispanic children (21.6%), followed by non-Hispanic black children (11.1%), and non-Hispanic white children (5.8%). Among children with reported dental problems, 78.3% had 1 problem, 17.5% had 2, and 4.1% hadⱖ3 problems (data not shown).
Dental Insurance
Approximately 1 in every 5 children were reported to lack dental insurance in the preceding year (22.1%;
TABLE 1 Continued
Lack of Dental Insurance Coverage
Bivariate Model Multivariate Modela
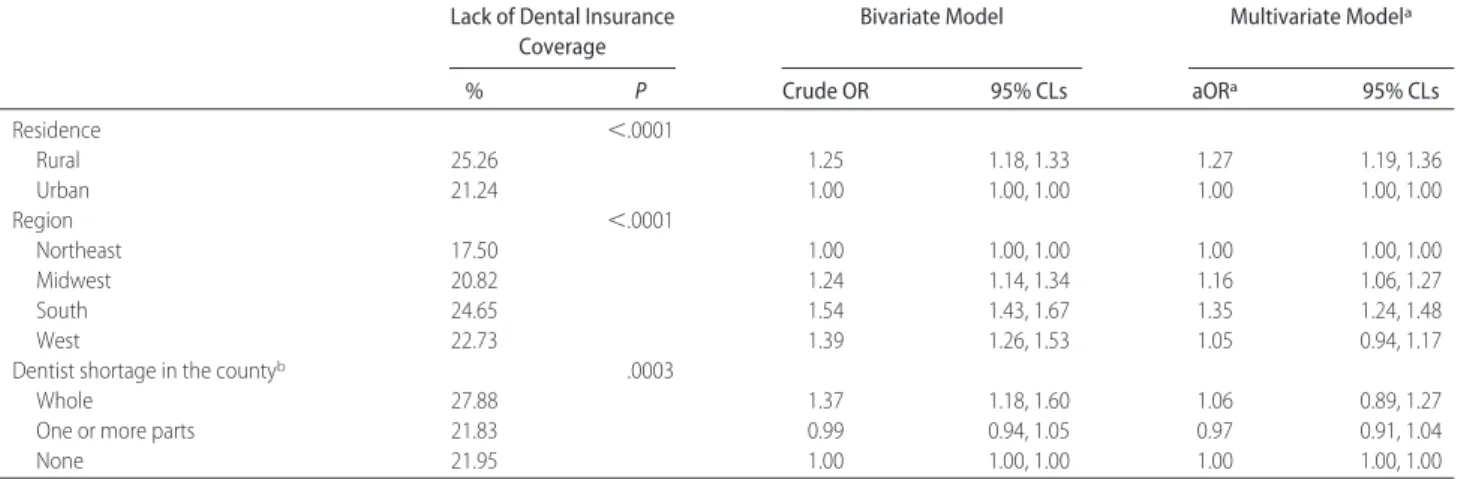
% P Crude OR 95% CLs aORa 95% CLs Residence ⬍.0001 Rural 25.26 1.25 1.18, 1.33 1.27 1.19, 1.36 Urban 21.24 1.00 1.00, 1.00 1.00 1.00, 1.00 Region ⬍.0001 Northeast 17.50 1.00 1.00, 1.00 1.00 1.00, 1.00 Midwest 20.82 1.24 1.14, 1.34 1.16 1.06, 1.27 South 24.65 1.54 1.43, 1.67 1.35 1.24, 1.48 West 22.73 1.39 1.26, 1.53 1.05 0.94, 1.17
Dentist shortage in the countyb .0003
Whole 27.88 1.37 1.18, 1.60 1.06 0.89, 1.27
One or more parts 21.83 0.99 0.94, 1.05 0.97 0.91, 1.04
None 21.95 1.00 1.00, 1.00 1.00 1.00, 1.00
aAll variables listed were adjusted in the model.
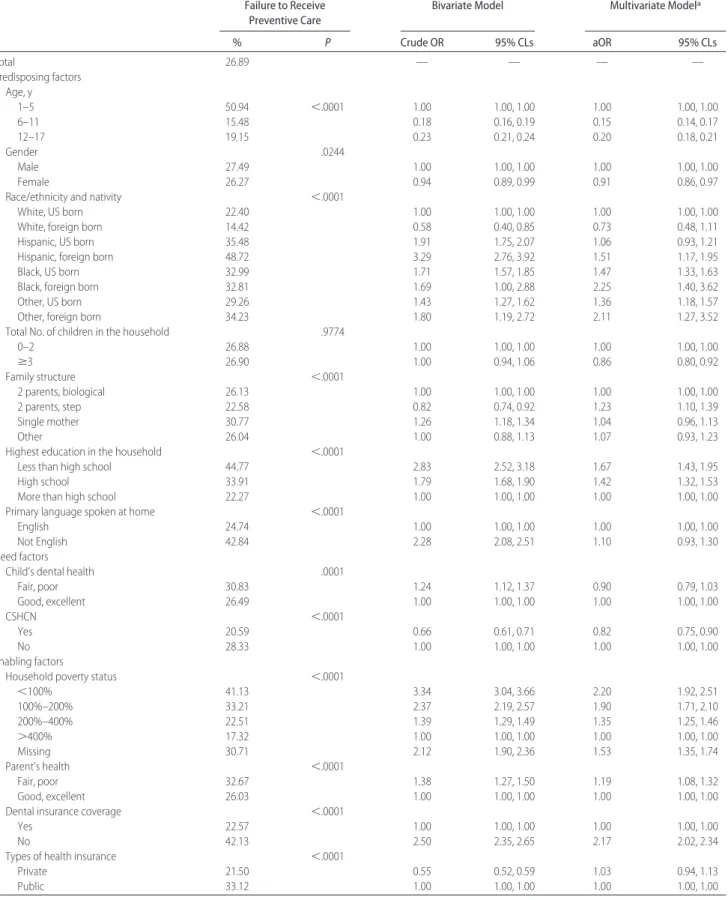
TABLE 2 Factors Associated With Failure to Receive Preventive Dental Care in the Past 12 Months in Children 1 to 17 Years of Age: National Survey of Children’s Health (Nⴝ 89 071)
Failure to Receive Preventive Care
Bivariate Model Multivariate Modela
% P Crude OR 95% CLs aOR 95% CLs Total 26.89 — — — — Predisposing factors Age, y 1–5 50.94 ⬍.0001 1.00 1.00, 1.00 1.00 1.00, 1.00 6–11 15.48 0.18 0.16, 0.19 0.15 0.14, 0.17 12–17 19.15 0.23 0.21, 0.24 0.20 0.18, 0.21 Gender .0244 Male 27.49 1.00 1.00, 1.00 1.00 1.00, 1.00 Female 26.27 0.94 0.89, 0.99 0.91 0.86, 0.97
Race/ethnicity and nativity ⬍.0001
White, US born 22.40 1.00 1.00, 1.00 1.00 1.00, 1.00
White, foreign born 14.42 0.58 0.40, 0.85 0.73 0.48, 1.11
Hispanic, US born 35.48 1.91 1.75, 2.07 1.06 0.93, 1.21
Hispanic, foreign born 48.72 3.29 2.76, 3.92 1.51 1.17, 1.95
Black, US born 32.99 1.71 1.57, 1.85 1.47 1.33, 1.63
Black, foreign born 32.81 1.69 1.00, 2.88 2.25 1.40, 3.62
Other, US born 29.26 1.43 1.27, 1.62 1.36 1.18, 1.57
Other, foreign born 34.23 1.80 1.19, 2.72 2.11 1.27, 3.52
Total No. of children in the household .9774
0–2 26.88 1.00 1.00, 1.00 1.00 1.00, 1.00 ⱖ3 26.90 1.00 0.94, 1.06 0.86 0.80, 0.92 Family structure ⬍.0001 2 parents, biological 26.13 1.00 1.00, 1.00 1.00 1.00, 1.00 2 parents, step 22.58 0.82 0.74, 0.92 1.23 1.10, 1.39 Single mother 30.77 1.26 1.18, 1.34 1.04 0.96, 1.13 Other 26.04 1.00 0.88, 1.13 1.07 0.93, 1.23
Highest education in the household ⬍.0001
Less than high school 44.77 2.83 2.52, 3.18 1.67 1.43, 1.95
High school 33.91 1.79 1.68, 1.90 1.42 1.32, 1.53
More than high school 22.27 1.00 1.00, 1.00 1.00 1.00, 1.00
Primary language spoken at home ⬍.0001
English 24.74 1.00 1.00, 1.00 1.00 1.00, 1.00
Not English 42.84 2.28 2.08, 2.51 1.10 0.93, 1.30
Need factors
Child’s dental health .0001
Fair, poor 30.83 1.24 1.12, 1.37 0.90 0.79, 1.03 Good, excellent 26.49 1.00 1.00, 1.00 1.00 1.00, 1.00 CSHCN ⬍.0001 Yes 20.59 0.66 0.61, 0.71 0.82 0.75, 0.90 No 28.33 1.00 1.00, 1.00 1.00 1.00, 1.00 Enabling factors
Household poverty status ⬍.0001
⬍100% 41.13 3.34 3.04, 3.66 2.20 1.92, 2.51 100%–200% 33.21 2.37 2.19, 2.57 1.90 1.71, 2.10 200%–400% 22.51 1.39 1.29, 1.49 1.35 1.25, 1.46 ⬎400% 17.32 1.00 1.00, 1.00 1.00 1.00, 1.00 Missing 30.71 2.12 1.90, 2.36 1.53 1.35, 1.74 Parent’s health ⬍.0001 Fair, poor 32.67 1.38 1.27, 1.50 1.19 1.08, 1.32 Good, excellent 26.03 1.00 1.00, 1.00 1.00 1.00, 1.00
Dental insurance coverage ⬍.0001
Yes 22.57 1.00 1.00, 1.00 1.00 1.00, 1.00
No 42.13 2.50 2.35, 2.65 2.17 2.02, 2.34
Types of health insurance ⬍.0001
Private 21.50 0.55 0.52, 0.59 1.03 0.94, 1.13
Table 1). In multivariable analysis, all US-born minority children were less likely to lack dental insurance than white children. However, foreign-born Hispanics were more likely to be uninsured (aOR: 2.1; 95% CLs: 1.6, 2.8). Children from poor or near poor households, chil-dren of less-educated parents, and rural chilchil-dren were less likely to have dental insurance. Lack of health in-surance coverage was strongly associated with lacking dental coverage (aOR: 22.6; 95% CLs: 19.8, 25.9). Chil-dren with private health insurance were more likely to lack dental insurance than those with public health in-surance (aOR: 1.6; 95% CLs: 1.5, 1.8). Dental health and primary language spoken at home were significantly associated with lack of dental insurance. CSHCN had slightly lower odds of lacking dental insurance than children without SHCN.
Preventive Dental Care
Slightly more than a quarter of children (26.9%) did not receive preventive dental care in the preceding year (Table 2). Adjusted analysis, holding constant income, insurance status, and other covariates, showed US-born Hispanic children to be as likely as their white peers to receive preventive care. All other minority children were more likely to lack a preventive visit. The disparities were exacerbated among foreign-born children such as Hispanic (aOR: 1.5; 95% CLs: 1.2, 1.9), black (aOR: 2.3; 95% CLs: 1.4, 3.6), and other children (aOR: 2.1; 95% CLs: 1.3, 3.5).
Even adjusting for insurance status, poverty was sig-nificantly associated with receipt of preventive dental care (Table 2). Low parental education was associated with higher odds of receiving no preventive dental care. Children’s insurance status (both dental and health cov-erage) was a significant predictor of receiving preventive dental care. Other characteristics of the child associated with failure to receive preventive care included young
age (1–5 years old), non-CSHCN status, fair or poor parental health, and living in the South.
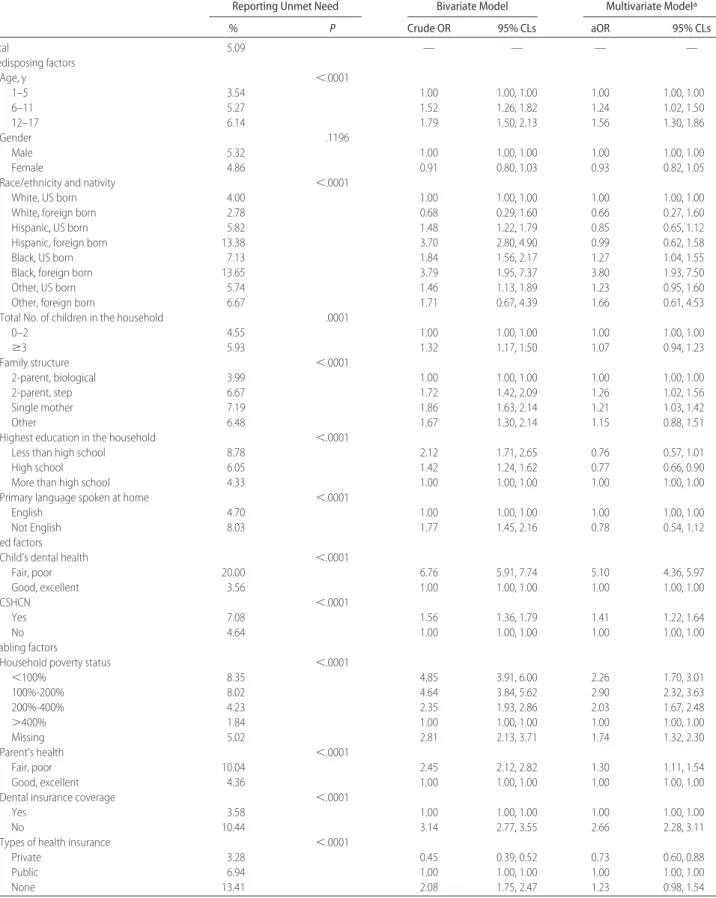
Overall, 5.1% of children had parentally perceived unmet need for preventive dental care (Table 3). In both crude and adjusted analysis, the strongest predictor of perceived unmet need was parentally reported poor dental health (aOR: 5.1; 95% CLs: 4.4, 5.9). Poverty was also associated with perceived unmet need; children in families at all income levels ⬍400% of poverty had greater adjusted odds for unmet need than wealthier children. In adjusted analysis, black children had signif-icantly higher odds of having unmet need than white children, with the highest adjusted odds among foreign-born black children (aOR: 3.8; 95% CLs: 1.9, 7.5). Chil-dren whose parents had high school education had mod-erately lower odds of having unmet need than the children whose parents had at least 12 years of educa-tion. Lack of dental insurance coverage was also a strong predictor of unmet need. CSHCN had higher odds of having unmet needs for preventive dental care than did children without SHCN.
DISCUSSION
We found disparities in dental insurance coverage and dental care among US children by race/ethnicity, resi-dence, family income, and parental education. Rural children were less likely to have dental insurance than their urban peers. Compared with US-born white chil-dren, foreign-born minorities were worse off in terms of dental insurance coverage (Hispanics only) and preven-tive dental care use. Health insurance coverage was the strongest predictor of dental coverage. Parentally re-ported dental insurance coverage was associated with higher odds for receipt of preventive dental care and lower odds of parentally perceived dental unmet need.
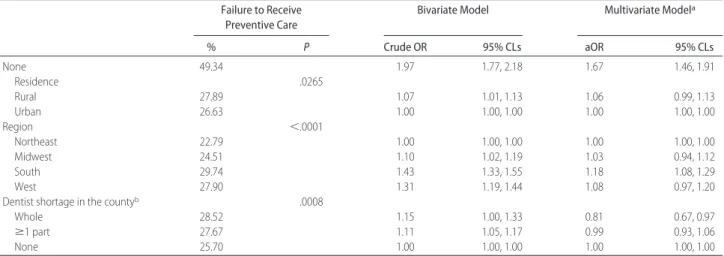
TABLE 2 Continued
Failure to Receive Preventive Care
Bivariate Model Multivariate Modela
% P Crude OR 95% CLs aOR 95% CLs None 49.34 1.97 1.77, 2.18 1.67 1.46, 1.91 Residence .0265 Rural 27.89 1.07 1.01, 1.13 1.06 0.99, 1.13 Urban 26.63 1.00 1.00, 1.00 1.00 1.00, 1.00 Region ⬍.0001 Northeast 22.79 1.00 1.00, 1.00 1.00 1.00, 1.00 Midwest 24.51 1.10 1.02, 1.19 1.03 0.94, 1.12 South 29.74 1.43 1.33, 1.55 1.18 1.08, 1.29 West 27.90 1.31 1.19, 1.44 1.08 0.97, 1.20
Dentist shortage in the countyb .0008
Whole 28.52 1.15 1.00, 1.33 0.81 0.67, 0.97
ⱖ1 part 27.67 1.11 1.05, 1.17 0.99 0.93, 1.06
None 25.70 1.00 1.00, 1.00 1.00 1.00, 1.00
aAll variables listed were adjusted in the model.
TABLE 3 Factors Associated With Parentally Perceived Unmet Dental Need in the Past 12 Months in Children 1 to 17 Years of Age: National Survey of Children’s Health (Nⴝ 89 071)
Reporting Unmet Need Bivariate Model Multivariate Modela
% P Crude OR 95% CLs aOR 95% CLs Total 5.09 — — — — Predisposing factors Age, y ⬍.0001 1–5 3.54 1.00 1.00, 1.00 1.00 1.00, 1.00 6–11 5.27 1.52 1.26, 1.82 1.24 1.02, 1.50 12–17 6.14 1.79 1.50, 2.13 1.56 1.30, 1.86 Gender .1196 Male 5.32 1.00 1.00, 1.00 1.00 1.00, 1.00 Female 4.86 0.91 0.80, 1.03 0.93 0.82, 1.05
Race/ethnicity and nativity ⬍.0001
White, US born 4.00 1.00 1.00, 1.00 1.00 1.00, 1.00
White, foreign born 2.78 0.68 0.29, 1.60 0.66 0.27, 1.60
Hispanic, US born 5.82 1.48 1.22, 1.79 0.85 0.65, 1.12
Hispanic, foreign born 13.38 3.70 2.80, 4.90 0.99 0.62, 1.58
Black, US born 7.13 1.84 1.56, 2.17 1.27 1.04, 1.55
Black, foreign born 13.65 3.79 1.95, 7.37 3.80 1.93, 7.50
Other, US born 5.74 1.46 1.13, 1.89 1.23 0.95, 1.60
Other, foreign born 6.67 1.71 0.67, 4.39 1.66 0.61, 4.53
Total No. of children in the household .0001
0–2 4.55 1.00 1.00, 1.00 1.00 1.00, 1.00 ⱖ3 5.93 1.32 1.17, 1.50 1.07 0.94, 1.23 Family structure ⬍.0001 2-parent, biological 3.99 1.00 1.00, 1.00 1.00 1.00, 1.00 2-parent, step 6.67 1.72 1.42, 2.09 1.26 1.02, 1.56 Single mother 7.19 1.86 1.63, 2.14 1.21 1.03, 1.42 Other 6.48 1.67 1.30, 2.14 1.15 0.88, 1.51
Highest education in the household ⬍.0001
Less than high school 8.78 2.12 1.71, 2.65 0.76 0.57, 1.01
High school 6.05 1.42 1.24, 1.62 0.77 0.66, 0.90
More than high school 4.33 1.00 1.00, 1.00 1.00 1.00, 1.00
Primary language spoken at home ⬍.0001
English 4.70 1.00 1.00, 1.00 1.00 1.00, 1.00
Not English 8.03 1.77 1.45, 2.16 0.78 0.54, 1.12
Need factors
Child’s dental health ⬍.0001
Fair, poor 20.00 6.76 5.91, 7.74 5.10 4.36, 5.97 Good, excellent 3.56 1.00 1.00, 1.00 1.00 1.00, 1.00 CSHCN ⬍.0001 Yes 7.08 1.56 1.36, 1.79 1.41 1.22, 1.64 No 4.64 1.00 1.00, 1.00 1.00 1.00, 1.00 Enabling factors
Household poverty status ⬍.0001
⬍100% 8.35 4.85 3.91, 6.00 2.26 1.70, 3.01 100%-200% 8.02 4.64 3.84, 5.62 2.90 2.32, 3.63 200%-400% 4.23 2.35 1.93, 2.86 2.03 1.67, 2.48 ⬎400% 1.84 1.00 1.00, 1.00 1.00 1.00, 1.00 Missing 5.02 2.81 2.13, 3.71 1.74 1.32, 2.30 Parent’s health ⬍.0001 Fair, poor 10.04 2.45 2.12, 2.82 1.30 1.11, 1.54 Good, excellent 4.36 1.00 1.00, 1.00 1.00 1.00, 1.00
Dental insurance coverage ⬍.0001
Yes 3.58 1.00 1.00, 1.00 1.00 1.00, 1.00
No 10.44 3.14 2.77, 3.55 2.66 2.28, 3.11
Types of health insurance ⬍.0001
Private 3.28 0.45 0.39, 0.52 0.73 0.60, 0.88
Public 6.94 1.00 1.00, 1.00 1.00 1.00, 1.00
Some of these findings parallel other research on pre-ventive dental care9,10,18–21and dental unmet need.8
The finding that all US-born minorities were more likely to have dental coverage than were white children suggests that public dental insurance such as Medicaid and the State Children’s Health Insurance Program may have helped reduce coverage disparities. Our finding parallels other research noting that children in poverty had the highest rate of no dental insurance coverage.5
However, public dental insurance does not necessarily increase preventive service receipt and decrease per-ceived unmet need22in all cases. Although we found that
privately insured children were slightly less likely than publicly insured to receive preventive care, privately insured children were, nonetheless, less likely to have unmet need for care. At least in dental markets where well-insured or private-pay patients are common, Med-icaid coverage alone will be insufficient to remove race-based disparities in dental utilization. For example, in many locales, dentists who accept Medicaid are rare.23
Both the American Academy of Pediatric Dentistry and Bright Futures recommend 2 visits per year to a dental professional beginning at age 1.24,25We found that
at least 1 of 4 children aged 1 through 17 years old and more than half of children aged 1 to 5 years old in the United States did not even see a dentist once in the preceding year. Foreign-born minority children were particularly vulnerable to failure to receive preventive care. Because this vulnerability persisted even when income and insurance status were held constant, there may be cultural issues pertaining to the importance of preventive care, or lack of understanding of how to access US dentists, that impede care.
In terms of SES, the associations of poverty with preventive dental care suggest that low-income parents may still have problems with access even holding insur-ance status constant. Difficulties may stem from the paucity of providers who take Medicaid,23 difficulty
meeting the deductibles associated with private insur-ance, or problems finding the time for preventive visits. Previous research documented that almost half of dental expenditures were paid out-of-pocket and only one third by dental insurance,26 supporting an independent
effect for income. Furthermore, parental education may suggest pathways related to health knowledge. Reducing unmet needs for dental care requires addressing both access issues and parents’ understanding of dental care need.
Our study adds new information regarding dental care needs among CSHCN, who account for 5% to 18% of the pediatric population in the United States.6,27,28We
found a protective effect for CSHCN status with regard to dental insurance coverage and preventive dental care. We speculate that parents’ more frequent contact with the health care system may improve their knowledge of dental needs, services covered by dental insurance, and how to access pediatric dentists. Nevertheless, CSHCN had a higher prevalence of unmet need, even after ad-justing for potential confounders.
Ecological variables, including rural residence and dentist availability, had limited effects. Rural residence was associated with slightly increased odds for lacking dental insurance. Regarding preventive care, rural resi-dence was not significant when other characteristics of the child were held constant. Dentist availability, mea-sured “whole county” or “partial county” dentist short-age area designation, had no effect on insurance or unmet need. Slightly increased unadjusted odds for lack of preventive care were absent in adjusted analysis. Sur-prisingly, children living in whole county dentist short-age areas had slightly reduced odds for lacking preven-tive dental care when all factors were held constant.
Several potential limitations should be noted. First, the NSCH is a telephone survey with a modest response rate (55%). It is possible that minorities or foreign-born children remain underrepresented, even after
weight-TABLE 3 Continued
Reporting Unmet Need Bivariate Model Multivariate Modela
% P Crude OR 95% CLs aOR 95% CLs Residence .1830 Rural 5.43 1.09 0.96, 1.23 0.96 0.84, 1.11 Urban 5.01 1.00 1.00, 1.00 1.00 1.00, 1.00 Region ⬍.0001 Northeast 3.47 1.00 1.00, 1.00 1.00 1.00, 1.00 Midwest 4.07 1.18 0.98, 1.42 1.04 0.86, 1.26 South 5.73 1.69 1.42, 2.01 1.30 1.08, 1.56 West 6.33 1.88 1.53, 2.31 1.51 1.22, 1.88
Dentist shortage in the countyb .0408
Whole 5.48 1.19 0.91, 1.54 0.81 0.61, 1.10
ⱖ1 part 5.40 1.17 1.03, 1.32 1.01 0.88, 1.16
None 4.66 1.00 1.00, 1.00 1.00 1.00, 1.00
aAll variables listed were adjusted in the model.
ing. Second, although 95.8% of respondents were par-ents, information may be underreported if parents are not fully informed about their children’s visits to non-traditional settings, such as school-based health centers or teen clinics. Third, dental insurance coverage was parentally reported; parents may be unclear or inaccu-rate in their understanding of dental coverage. However, our estimate of uninsured children (22%) is somewhat close to the levels found in the 2002 the National Survey of America’s Families (26%)9and in the 2001 California
Health Interview Survey (23.6%).18Finally, the unmet
need measure is subject to recognition and recall error, because it assumes that parents all recognize dental need and can recall this need at the interview time. Reporting bias would occur if parents think that the unmet need is a socially undesirable concept and are not willing to acknowledge this. Using standard questions that have been used elsewhere, our results on unmet need can be compared with previous findings.6,8,29The positive
asso-ciation between perceived poor dental health and unmet need indicates that the data has its own face validity despite potential limitations.
CONCLUSIONS
Eliminating race and economic and geographical dispar-ities in dental insurance and dental care requires addi-tional efforts in removing both financial and nonfinan-cial barriers to dental utilization improving dental insurance coverage for foreign-born minority children and improving parents’ understanding of dental care need. All of these will be critical to improving American children’s oral health.
ACKNOWLEDGMENT
We thank Dr Charity Moore at Cecil G. Sheps Center for Health Services Research, University of North Carolina, for the helpful advice on analyzing these survey data.
REFERENCES
1. US Department of Health and Human Services. Oral Health in America: A Report of the Surgeon General. Rockville, MD: US Department of Health and Human Services, National Institute of Dental and Craniofacial Research, National Institutes of Health; 2000
2. Kaste LM, Selwitz RH, Oldakowski RJ, Brunelle JA, Winn DM, Brown LJ. Coronal caries in the primary and permanent den-tition of children and adolescents 1–17 years of age: United States, 1988 –1991. J Dent Res. 1996;75:631– 641
3. General Accounting Office. Oral health: dental disease is a chronic problem among low-income populations. Available at: www.gao.gov/archive/2000/he00072.pdf. Accessed November 15, 2005
4. Al Agili DE, Bronstein JM, Greene-McIntyre M. Access and utilization of dental services by Alabama Medicaid-enrolled children: a parent perspective. Pediatr Dent 2005;27:414 – 421
5. Edelstein BL. Disparities in oral health and access to care: findings of national surveys. Ambul Pediatr. 2002;2(2 suppl): 141–147.
6. Skinner AC, Slifkin RT, Mayer ML. The effect of rural residence on dental unmet need for children with special health care needs. J Rural Health. 2006;22:36 – 42
7. Bloom B, Dey AN. Summary health statistics for US children: National Health Interview Survey, 2004. Vital Health Stat 10. 2006;(227):1– 85
8. Newacheck PW, Hughes DC, Hung YY, Wong S, Stoddard JJ. The unmet health needs of America’s children. Pediatrics. 2000; 105(4 pt 2):989 –997
9. Kenney GM, McFeeters JR, Yee JY. Preventive dental care and unmet dental needs among low-income children. Am J Public Health. 2005;95:1360 –1366
10. Yu SM, Bellamy HA, Kogan MD, Dunbar JL, Schwalberg RH, Schuster MA. Factors that influence receipt of recommended preventive pediatric health and dental care. Pediatrics. 2002; 110(6). Available at: www.pediatrics.org/cgi/content/full/110/ 6/e73
11. Edelstein BL, Manski RJ, Moeller JE. Child dental expenditures: 1996. Pediatr Dent. 2002;24:11–17
12. Kogan MD, Newacheck PW. Introduction to the volume on articles from the National Survey of Children’s Health. Pediat-rics. 2007;119(suppl 1):S1–S3
13. Blumberg SJ, Olson L, Frankel M, Osborn L, Srinath KP, Giambo P. Design and operation of the National Survey of Children’s Health, 2003. Vital Health Stat 1. 2005;(43):1–124 14. Aday LA, Andersen R. A framework for the study of access to
medical care. Health Serv Res. 1974;9:208 –220
15. Research Triangle Institute. SUDAAN Language Manual, Release 9.0. Research Triangle Park, NC: Research Triangle Institute; 2004
16. Administration for Children and Families. The Personal Re-sponsibility and Work Opportunity Reconciliation Act of 1996. Available at: www.acf.dhhs.gov/programs/ofa/prwora96.htm. Accessed May 15, 2006
17. Pub L No. 104 –193 (Personal Responsibility and Work Oppor-tunity Reconciliation Act, 1996)
18. Isong U, Weintraub JA. Determinants of dental service utiliza-tion among 2- to 11-year-old California children. J Public Health Dent. 2005;65:138 –145
19. Manski RJ, Edelstein BL, Moeller JF. The impact of insurance coverage on children’s dental visits and expenditures, 1996. J Am Dent Assoc. 2001;132:1137–1145
20. Manski RJ, Macek MD, Moeller JF. Private dental coverage: who has it and how does it influence dental visits and expen-ditures? J Am Dent Assoc. 2002;133:1551–1559
21. Milgrom P, Mancl L, King B, Weinstein P, Wells N, Jeffcott E. An explanatory model of the dental care utilization of low-income children. Med Care. 1998;36:554 –566
22. Lave JR, Keane CR, Lin CJ, Ricci EM. The impact of dental benefits on the utilization of dental services by low-income children in western Pennsylvania. Pediatr Dent. 2002;24: 234 –240
23. Smith RG, Lewis CW. Availability of dental appointments for young children in King County, Washington: implications for access to care. Pediatr Dent. 2005;27:207–211
24. American Academy of Pediatric Dentistry. Regular dental vis-its. Available at: www.aapd.org/publications/brochures/ regdent.asp. Accessed April 17, 2006
25. Green M, Palfrey JS. Bright Futures: Guidelines for Health Supervision of Infants, Children, and Adolescents. 2nd ed. Arlington, VA: National Center for Education in Maternal and Child Health; 2002
26. Vargas CM, Manski RJ. Dental expenditures and source of payment by race/ethnicity and other sociodemographic char-acteristics. J Public Health Dent. 1999;59:33–38
27. Casamassimo PS, Seale NS, Ruehs K. General dentists’ percep-tions of educational and treatment issues affecting access to care for children with special health care needs. J Dent Educ. 2004;68:23–28
28. Newacheck PW, Kim SE. A national profile of health care utilization and expenditures for children with special health care needs. Arch Pediatr Adolesc Med. 2005;159:10 –17 29. Lewis C, Robertson AS, Phelps S. Unmet dental care needs
among children with special health care needs: implications for the medical home. Pediatrics. 2005;116(3). Available at: www.pediatrics.org/cgi/content/full/116/3/e426
DOI: 10.1542/peds.2006-2089D
2007;119;S12-S21
Pediatrics
Jihong Liu, Janice C. Probst, Amy B. Martin, Jong-Yi Wang and Carlos F. Salinas
The National Survey of Children's Health
Disparities in Dental Insurance Coverage and Dental Care Among US Children:
& Services
Updated Information
2
http://www.pediatrics.org/cgi/content/full/119/Supplement_1/S1 including high-resolution figures, can be found at:
References
2#BIBL
http://www.pediatrics.org/cgi/content/full/119/Supplement_1/S1 at:
This article cites 16 articles, 5 of which you can access for free
Subspecialty Collections
http://www.pediatrics.org/cgi/collection/office_practice
Office Practice
following collection(s):
This article, along with others on similar topics, appears in the
Permissions & Licensing
http://www.pediatrics.org/misc/Permissions.shtml tables) or in its entirety can be found online at:
Information about reproducing this article in parts (figures,
Reprints
http://www.pediatrics.org/misc/reprints.shtml