MS No.: 07005; Received: March 19, 2007; 1st revision: June 26, 2007; 2nd revision: August 20, 2007; Accepted: January 8, 2008 Correspondence Author: Mau-Sun Hua, Department of Psychology, National Taiwan University, No. 1, Sec. 4, Roosevelt Road, Taipei, 106, Taiwan.(E-mail: huams@ntu.edu.tw)
Selection of Factor-Based WAIS-III Tetrads in the Taiwan Standardization Sample:
A Guide to Clinical Practice
1 Department of Special Education, National Taiwan Normal University 2 Department of Psychology, National Taiwan University
3 The Psychological Corporation, U.S.A 4 The Chinese Behavioral Science Corporation
Hsin-Yi Chen
1, Mau-Sun Hua
2, Jianjun Zhu
3and Yung-Hwa Chen
4Factor-based WAIS–III tetrads were investigated with the Taiwan WAIS–III standardization sample of 888 normal adults, ages 16 to 84 years old. Various psychometric characteristics, time constraints, as well as qualities of estimation among prorating and linear equating procedures, were compared among 54 tetrads. Our results supported the use of the linear equating procedure. The Similarities-Matrix Reasoning-Arithmetic-Digit Symbol form exceeded others with respect to validity, content representation, and time saving. Kaufman,s (1990) Similarities-Picture Completion-Arithmetic-Digit Symbol combination, and the Information-Picture Completion-Arithmetic-Digit Symbol short forms were both among the most efficient estimations. For clinicians who highly value the clinical information of Block Design, two other forms, Similarities-Block Design-Arithmetic-Digit Symbol and Information-Block Design-Arithmetic-Design-Arithmetic-Digit Symbol, were found providing better estimation quality. Nonetheless, current findings revealed that even preferred tetrads had substantial misclassification rates, and these factor-based tetrads tend to show under-estimation for people with top abilities. Users are cautioned to use these short forms for screening purposes only. Results of this study are consistent with literature and assist in choosing among WAIS-III factor-based tetrads by providing their relative psychometric quality.
Keywords: WAIS–III, short form, Taiwan norm
Introduction
The Chinese version of the Wechsler Adult
Intelligence Scale—Third Edition (WAIS–III)
was recently released (Chen & Chen, 2002). Administration of the 11 WAIS–III core subtests requires, on average, 86 minutes for normal adults
from Taiwan (Chen, 2002), and possibly longer in clinical populations. When administering a full battery is not possible under some practical constraints, though not preferred, utilization of short form could be one solution when only a quick intelligence screening is required, given that not much reliability and validity are sacrificed
while saving time (Donder, 2001). Owning to the lack of proven short form utilities for the Chinese population, corresponding validity studies are needed.
This study selected short forms based on reducing the number of subtests for the advantages of higher reliability (Kulas & Axelrod, 2002; Paolo & Ryan, 1993), and ease of completing a full battery at a later time if needed. Traditionally, four-subtest combinations are the popular option for brief intelligence estimation (Kaufman, Isihikuma, Kaufman-Packer, 1991; Wechsler, 1997). Several WAIS-R tetrads have been proposed. For example, Silverstein,s (1982) Vocabulary-Block Design-Arithmetic-Picture Arrangement form, and Reynolds, Willson, and Clark,s (1983) Information-Block Design-Arithmetic-Picture Completion form both have been reexamined frequently (Robiner, Dossa, & O,Dowd, 1997; Ryan, 1985; Ryan, Larsen, & Prifitera, 1983; Silverstein, 1985a). However, they both are criticized for being relatively more time-consuming than other possible options. Meanwhile, Kaufman and associates (Kaufman, 1990; Kaufman, Ishikuma, and Kaufman-Packer, 1991) proposed the Similarities-Picture Completion-Arithmetic-Digit Symbol combination as the “extremely brief tetrad”which they found both
time-saving (roughly 19 minutes) and good with respect to predictive accuracy. The merits of this combination (short administration time, ease of scoring, and good psychometric qualities in various clinical populations) have been evaluated extensively (Allen et al., 1997; Boone, 1992; Cravens, 1999; Grossman, Mednitsky, Dennis, Scharff, & Kaufman, l993; McCusker, 1994; Missar, Gold, & Goldberg, 1994; Nagle & Bell,1995; Ward & Ryan, 1996, 1997). Recently, several compelling features of the newly available WAIS-III Matrix Reasoning subtest are recognized (Tulsky, Saklofske, & Zhu, 2003; Tulsky, Zhu, & Prifitera, 2000), including reliable measure of fluid ability, high g loading, cultural-fairness, ease of administration and scoring, and no need for hand manipulation. Researchers soon recommended this new subtest for inclusion in short forms (Sattler, 2001). For example, Wechsler
(1997) developed the Vocabulary-Similarities-Block Design-Matrix Reasoning tetrad, mainly owing to the high correlations of these subtests with g. A number of investigators have also noted that, for short-form combinations, Matrix Reasoning is a better and an appropriate logical substitution for Block Design (Axelrod, Ryan, & Ward, 2001; Ryan & Ward, 1999; Sattler, 2001; Schopp, Herrman, Johnstone, Callahan, & Roudebush, 2001; Tam, 2004; Wechsler, 1997).
Simultaneously consideration of multiple factors is necessary when deriving short forms. The magnitude of the validity is the main concern (Silverstein, 1985b). Other factors, such as reliability, clinical utility, ease of administration and scoring, and efficiency are all important criteria (Cyr & Brooker, 1984; Kaufman, et al, 1991; Kaufman, Kaufman, Balgopol, & McLean, 1996; Ward & Ryan, 1996). Some researchers claimed that maintaining the factor structure of the parent instrument is crucial (Donders, 1997, 2001; Smith, McCarthy, & Anderson, 2000). Blyler, Gold, Iannone, and Buchanan (2000) selected a WAIS-III short form by including one subtest from each of the four WAIS-III factors. It is believed that if the short form samples from all domains assessed by the full battery, similar constructs from those tapped by the full battery of the WAIS-III are estimated, and therefore the possibility of over- or under-estimating Full Scaled IQ (FSIQ) for individuals with strengths or weaknesses in differential cognitive domains is minimized. Another issue concerns the subtest order in the full battery. The administration order affects the final estimate accuracy for two- and three-subtest short forms because it influences the level of examinees, motivation and attention. However, previous research proved that administration orders had no impacts on the estimation accuracy of short forms with four or more subtests (Thompson, 1987; Thompson, Howard, & Anderson, 1986; Thompson & Plumridge, 1999).
For the current study, all four-subtest short forms were predetermined to include one subtest from each of the four WAIS-III factors: verbal comprehension (VC), perceptual organization (PO),
working memory (WM), and processing speed (PS). Therefore, three subtests not used in the calculation of index scores (Comprehension, Picture Arrangement, and Object Assembly) were dropped from the consideration for reasons of both content coverage and psychometric qualities. Some of the traditionally popular tetrads, such as Silverstein,s (1982) and Reynolds, Willson, and Clark,s (1983) short forms, were thus not investigated in this current study, for not providing coverage of all four WAIS-III factor domains.
Besides, regardless of the lengthy administration time for Block Design and Vocabulary subtests (Chen, 2002; Ryan, Lopez, & Werth, 1998), we decided to retain both in this study for complete comparison purpose. Block Design has long been recognized for its rich diagnostic value, such as being a good index for visual-motor organization, and is amenable to qualitative analysis (Kaufman & Lichtenberger, 2002). Our previous study also found that Vocabulary was the verbal subtest selected for the most valid WAIS-III dyad (Chen, Hua, & Zhu, 2007). There might be some occasions where these subtests are needed.
W h e n s e l e c t i n g t h e m e t h o d o l o g y f o r computation of the FSIQ estimates, we first considered linear scaling for its well recognized psychometric qualities (Sattler, 2001; Silverstein, 1990; Tellegen & Briggs, 1967). Other methods, such as prorating procedures have a tendency to inflate the normative variation and to generate estimated FSIQ values that are too extreme (Tellegen & Briggs,1967), whereas regression procedure was found tending to do the opposite (Chen et al., 2007). Nonetheless, comparisons among computation procedures continue (Axelrod et al., 2001; Iverson, Myers, & Adams, 1997). Engelhart, Eisenstein, Johnson, and Losonczy (1999) proposed that as the number of subtests in the short form increases, the problem of inflated variances become less of a concern. In their study, inflated variance was a problem for two- and three-subtest combinations, but not the case for four-subtest short forms. Engelhart and his associates claimed that prorating is a viable procedure which could increase an examiner,s
flexibility in constructing short forms based on practical needs. In this study, their hypothesis was tested.
The present research was designed to compare the quality of all possible combinations of WAIS-III factor-based tetrads. Various validity criteria based on both linear equating and prorated procedures were compared. Reliabilities and administration time estimates (Chen, 2002) were included in order to make intact information available for evaluation.
Method
Participants
The Taiwan WAIS–III standardization sample (Chen & Chen, 2002) of 888 adults who reported no history of significant medical illness or psychiatric problem, aged 16-84 years, was used as the database. The sample was stratified on the variables of age, geographical region, and level of education. Equal numbers of men and women were included in each of the 11 age groups. Apart from the eldest age group that contained 88 individuals, each of the remaining 10 age groups were composed of 80 adults.
Procedure
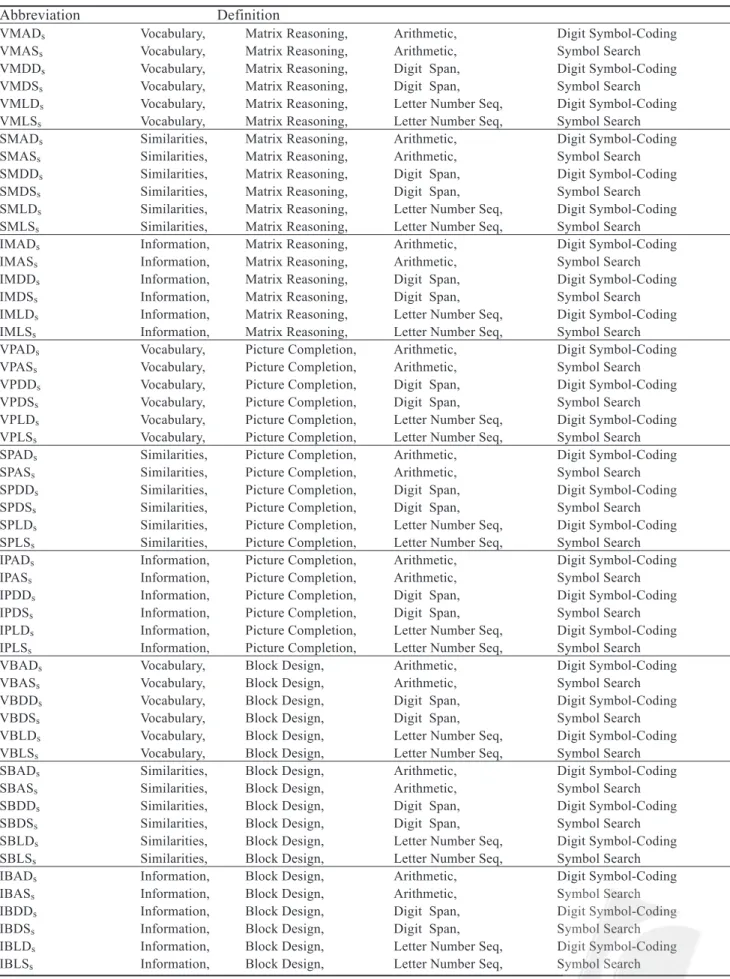
Fifty-four tetrads were established based on all possible combinations of 11 subtests (Vocabulary, Similarities, Information, Matrix Reasoning, Picture Completion, Block Design, Arithmetic, Digit Span, Letter-Number Sequencing, Digit Symbol, and Symbol Search); every short form includes one subtest from each of the four WAIS-III index domains. Table 1 presents the abbreviations for each short form.
Psychometric data were obtained for the estimated FSIQs of all short forms for each of the 11 age groups and the average of all age groups in the standardization sample. Reliabilities and corrected part-whole correlations of the composite scales for each age group were determined by using Tellegen and Briggs, (1967) formula. The overall
Table 1 Abbreviations and definitions for 54 WAIS–III four-subtest short forms
Abbreviation DefinitionVMADs Vocabulary, Matrix Reasoning, Arithmetic, Digit Symbol-Coding
VMASs Vocabulary, Matrix Reasoning, Arithmetic, Symbol Search
VMDDs Vocabulary, Matrix Reasoning, Digit Span, Digit Symbol-Coding
VMDSs Vocabulary, Matrix Reasoning, Digit Span, Symbol Search
VMLDs Vocabulary, Matrix Reasoning, Letter Number Seq, Digit Symbol-Coding
VMLSs Vocabulary, Matrix Reasoning, Letter Number Seq, Symbol Search
SMADs Similarities, Matrix Reasoning, Arithmetic, Digit Symbol-Coding
SMASs Similarities, Matrix Reasoning, Arithmetic, Symbol Search
SMDDs Similarities, Matrix Reasoning, Digit Span, Digit Symbol-Coding
SMDSs Similarities, Matrix Reasoning, Digit Span, Symbol Search
SMLDs Similarities, Matrix Reasoning, Letter Number Seq, Digit Symbol-Coding
SMLSs Similarities, Matrix Reasoning, Letter Number Seq, Symbol Search
IMADs Information, Matrix Reasoning, Arithmetic, Digit Symbol-Coding
IMASs Information, Matrix Reasoning, Arithmetic, Symbol Search
IMDDs Information, Matrix Reasoning, Digit Span, Digit Symbol-Coding
IMDSs Information, Matrix Reasoning, Digit Span, Symbol Search
IMLDs Information, Matrix Reasoning, Letter Number Seq, Digit Symbol-Coding
IMLSs Information, Matrix Reasoning, Letter Number Seq, Symbol Search
VPADs Vocabulary, Picture Completion, Arithmetic, Digit Symbol-Coding
VPASs Vocabulary, Picture Completion, Arithmetic, Symbol Search
VPDDs Vocabulary, Picture Completion, Digit Span, Digit Symbol-Coding
VPDSs Vocabulary, Picture Completion, Digit Span, Symbol Search
VPLDs Vocabulary, Picture Completion, Letter Number Seq, Digit Symbol-Coding
VPLSs Vocabulary, Picture Completion, Letter Number Seq, Symbol Search
SPADs Similarities, Picture Completion, Arithmetic, Digit Symbol-Coding
SPASs Similarities, Picture Completion, Arithmetic, Symbol Search
SPDDs Similarities, Picture Completion, Digit Span, Digit Symbol-Coding
SPDSs Similarities, Picture Completion, Digit Span, Symbol Search
SPLDs Similarities, Picture Completion, Letter Number Seq, Digit Symbol-Coding
SPLSs Similarities, Picture Completion, Letter Number Seq, Symbol Search
IPADs Information, Picture Completion, Arithmetic, Digit Symbol-Coding
IPASs Information, Picture Completion, Arithmetic, Symbol Search
IPDDs Information, Picture Completion, Digit Span, Digit Symbol-Coding
IPDSs Information, Picture Completion, Digit Span, Symbol Search
IPLDs Information, Picture Completion, Letter Number Seq, Digit Symbol-Coding
IPLSs Information, Picture Completion, Letter Number Seq, Symbol Search
VBADs Vocabulary, Block Design, Arithmetic, Digit Symbol-Coding
VBASs Vocabulary, Block Design, Arithmetic, Symbol Search
VBDDs Vocabulary, Block Design, Digit Span, Digit Symbol-Coding
VBDSs Vocabulary, Block Design, Digit Span, Symbol Search
VBLDs Vocabulary, Block Design, Letter Number Seq, Digit Symbol-Coding
VBLSs Vocabulary, Block Design, Letter Number Seq, Symbol Search
SBADs Similarities, Block Design, Arithmetic, Digit Symbol-Coding
SBASs Similarities, Block Design, Arithmetic, Symbol Search
SBDDs Similarities, Block Design, Digit Span, Digit Symbol-Coding
SBDSs Similarities, Block Design, Digit Span, Symbol Search
SBLDs Similarities, Block Design, Letter Number Seq, Digit Symbol-Coding
SBLSs Similarities, Block Design, Letter Number Seq, Symbol Search
IBADs Information, Block Design, Arithmetic, Digit Symbol-Coding
IBASs Information, Block Design, Arithmetic, Symbol Search
IBDDs Information, Block Design, Digit Span, Digit Symbol-Coding
IBDSs Information, Block Design, Digit Span, Symbol Search
IBLDs Information, Block Design, Letter Number Seq, Digit Symbol-Coding
averages were then transformed by Fisher,s r to z technique. Prorated short form FSIQs were obtained by multiplying the mean of two verbal subtest scaled scores by 6 and the mean of two performance subtest scaled scores by 5. The two prorated standard scores were then summed and the total was converted to the WAIS–III FSIQ, using Table 5 in the Taiwan WAIS– III manual (Chen & Chen, 2002, p.363). Tellegen and Briggs, (1967) formula was used for linear equating to compute a Deviation Quotient with a mean of 100 and standard deviation of 15.
For both linear-equating and prorated estimations, various types of validity indices were calculated (Resnick & Entin, 1971; Silverstein, 1985b; Thompson & Plumridge, 1999), such as paired sample student t- tests for mean and variance differences of the estimated and actual FSIQs, correlations between estimated and actual FSIQs, percentages of people with estimated scores falling within the 90% and 95% confidence intervals for
his/her estimated true FSIQ, and correspondence between estimated and actual FSIQ qualitative categorizations.
Results
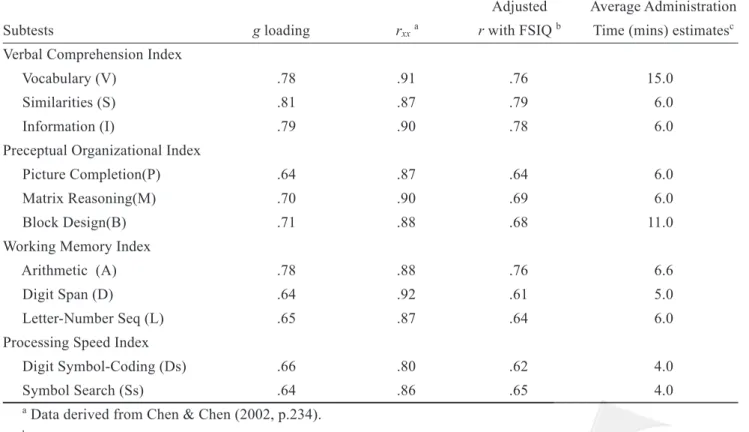
Table 2 summarizes the basic characteristics of investigated subtests. The loadings on the first unrotated factor in the principal-axis factor analysis were used to estimate the g loadings. The results indicated that majority of VCI and POI subtests (except Picture Completion) and Arithmetic subtest have g loadings above .70, which indicates a good measure of g (Kaufman & Lichtenberger, 2002, p 234). All other g loadings were fair (above .60). Reliabilities for these subtests were good, ranging from .80 to .91. Adjusted correlations with FSIQ were all significant (p < .001). Administration time estimates based on Chen (2002) revealed that Vocabulary and Block Design were lengthy for
Table 2 Basic characteristics for each considered subtes
Adjusted Average Administration Subtests g loading rxxa r with FSIQ b Time (mins) estimatesc Verbal Comprehension Index
Vocabulary (V) .78 .91 .76 15.0
Similarities (S) .81 .87 .79 6.0
Information (I) .79 .90 .78 6.0
Preceptual Organizational Index
Picture Completion(P) .64 .87 .64 6.0
Matrix Reasoning(M) .70 .90 .69 6.0
Block Design(B) .71 .88 .68 11.0
Working Memory Index
Arithmetic (A) .78 .88 .76 6.6
Digit Span (D) .64 .92 .61 5.0
Letter-Number Seq (L) .65 .87 .64 6.0
Processing Speed Index
Digit Symbol-Coding (Ds) .66 .80 .62 4.0
Symbol Search (Ss) .64 .86 .65 4.0
a Data derived from Chen & Chen (2002, p.234). b Data derived from Chen & Chen (2002, p. 267). c Data derived from Chen (2002, Table 2).
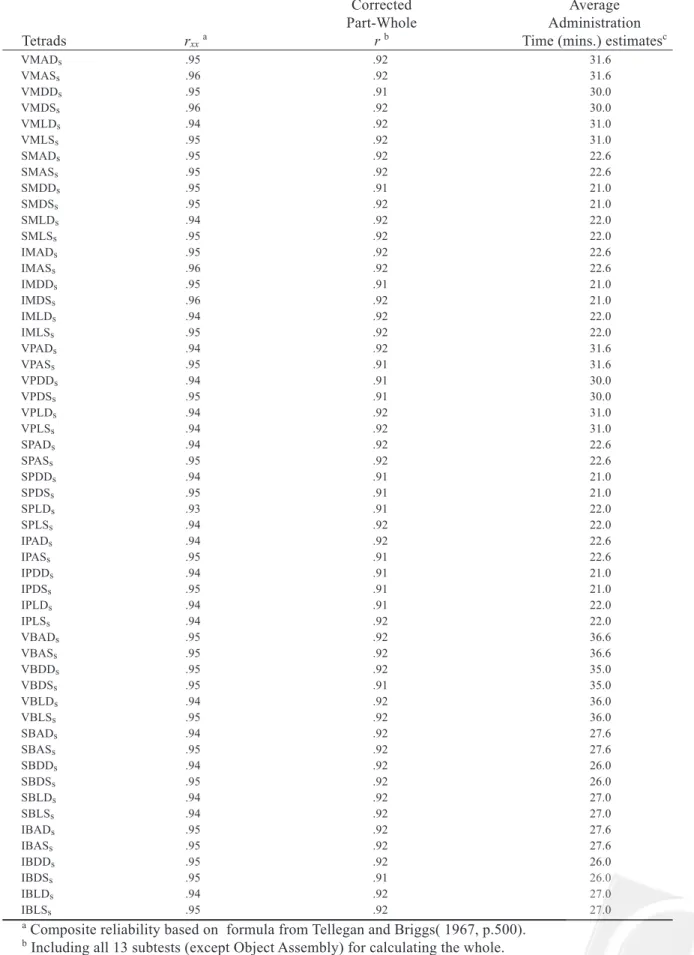
Table 3 Psychometric characteristics and estimated time for 54 tetrads
Corrected Average
Part-Whole Administration
Tetrads rxxa r b Time (mins.) estimatesc
VMADs .95 .92 31.6 VMASs .96 .92 31.6 VMDDs .95 .91 30.0 VMDSs .96 .92 30.0 VMLDs .94 .92 31.0 VMLSs .95 .92 31.0 SMADs .95 .92 22.6 SMASs .95 .92 22.6 SMDDs .95 .91 21.0 SMDSs .95 .92 21.0 SMLDs .94 .92 22.0 SMLSs .95 .92 22.0 IMADs .95 .92 22.6 IMASs .96 .92 22.6 IMDDs .95 .91 21.0 IMDSs .96 .92 21.0 IMLDs .94 .92 22.0 IMLSs .95 .92 22.0 VPADs .94 .92 31.6 VPASs .95 .91 31.6 VPDDs .94 .91 30.0 VPDSs .95 .91 30.0 VPLDs .94 .92 31.0 VPLSs .94 .92 31.0 SPADs .94 .92 22.6 SPASs .95 .92 22.6 SPDDs .94 .91 21.0 SPDSs .95 .91 21.0 SPLDs .93 .91 22.0 SPLSs .94 .92 22.0 IPADs .94 .92 22.6 IPASs .95 .91 22.6 IPDDs .94 .91 21.0 IPDSs .95 .91 21.0 IPLDs .94 .91 22.0 IPLSs .94 .92 22.0 VBADs .95 .92 36.6 VBASs .95 .92 36.6 VBDDs .95 .92 35.0 VBDSs .95 .91 35.0 VBLDs .94 .92 36.0 VBLSs .95 .92 36.0 SBADs .94 .92 27.6 SBASs .95 .92 27.6 SBDDs .94 .92 26.0 SBDSs .95 .92 26.0 SBLDs .94 .92 27.0 SBLSs .94 .92 27.0 IBADs .95 .92 27.6 IBASs .95 .92 27.6 IBDDs .95 .92 26.0 IBDSs .95 .91 26.0 IBLDs .94 .92 27.0 IBLSs .95 .92 27.0
a Composite reliability based on formula from Tellegan and Briggs( 1967, p.500). b Including all 13 subtests (except Object Assembly) for calculating the whole. c Estimated by summing corresponding subtest administration time from Chen (2002).
administration, whereas the other subtests were comparatively more time-efficient.
For each tetrad, reliabilities, corrected part-whole correlations with the full battery, and the administration time estimates appear in Table 3. All combinations demonstrate excellent reliabilities, ranging from .93 to .96. After correcting for possible inflation due to overlapping variation, the correlation of each tetrad with full battery were also promising, ranging from .91 to .92. It means that roughly 83% to 85% of the full battery variance can be explained by these short-form estimates. As expected, the short forms that included Vocabulary or Block Design required much more time to administer (range from 26 to 36 minutes); the other combinations reduced administration time up to one-third and could therefore be completed efficiently within 21 to 22.6 minutes. Unless short forms with Vocabulary or Block Design presented impressive estimation accuracies which far exceed performances by others, or any specific clinical consideration is required, these lengthier tetrads would not present an immediately obvious advantage. Short forms that excluded both Vocabulary and Block Design, and included Digit Span had the shortest administration time (roughly 20 minutes). Administration of these presented tetrads saves approximately 58% to 76% of the time it takes to administer the standard 11 WAIS–III subtests (an average of 86 minutes for normal adults).
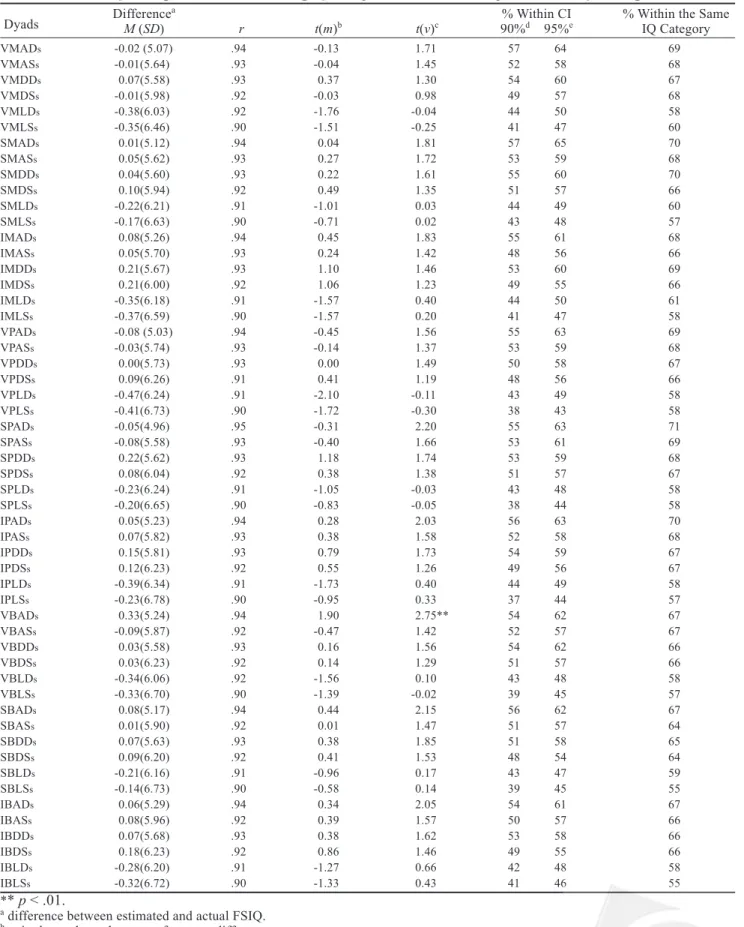
Table 4 contains the prime index of estimation accuracy based on linear equating procedures. Various types of validity evidence are presented, such as the mean and standard deviation of the difference between the estimated and actual FSIQ; correlations between estimated FSIQ and the actual FSIQ ; paired sample student t- test for significant mean (tm) and variance (tv) differences between
the actual and estimated FSIQ; percentages of individuals with estimated FSIQ within the 90% and 95% levels of confidence of the estimated true FSIQ (within approximately ± 3.43 and ± 4.07 IQ points of the estimated true FSIQ score); and accuracy relative to the correspondence between seven qualitative intelligence categorizations based on Wechsler,s
criteria (1997, Table 2.3): (1) extremely low (FSIQ 69 and below); (2) borderline (FSIQ 70–79); (3) low average (FSIQ 80–89); (4) average (FSIQ 90–109); (5) high average (FSIQ 110–119); (6) superior (FSIQ 120–129); (7) very superior (FSIQ 130 and above).
Results in Table 4 reveal that all tetrads yielded estimated FSIQs that correlate highly with actual FSIQ, ranging from .90 to .95 (all p < .01). Combinations that included Arithmetic and Digit Symbol seem to correlate stronger compared with their corresponding tetrads that did not. The central tendency and variation of all estimated and actual FSIQ distributions match closely (almost all p > .01). Although short forms containing Arithmetic and Digit Symbol tend to show larger score variations, the significance level of 1 % Type I error was not reached.
While comparing estimation quality among all tetrads, SMADs exceeded all others for almost all psychometric properties. It not only possessed a high reliability of .95, but also correlated highly with actual FSIQ which explains about 88% of the full variance. Furthermore, there were 65% of SMADs FSIQ estimates fell within the 95% confidence interval (approximately ± 4.07 points) of the known estimated true FSIQ, and the accurate FSIQ classification hit rate was also among the highest, at 70%. The SMADs combination took roughly 22.6 minutes to administer. Impressively, the estimation quality of the SMADs short form exceeded all tetrads that take more than 30 minutes to administer. Thus, though VMADs and VPADs both demonstrated good properties of validity, the better performance of SMADs and briefer testing time makes it more favorable.
Apart from the best solution of SMADs, other forms, such as SPADs (Kaufman, 1990) and IPADs also performed well in both psychometric and time-efficient domains. Both took 22.6 minutes to administer, and demonstrated strong reliability and validity. Roughly 63% of the estimated FSIQs from these tetrads fell within the known true 95% confidence interval, and the accurate FSIQ classification hit rate of both was around the highest (70%).
Table 4 Comparing FSIQ estimating quality of 54 tetrads by Linear Equating Procedure
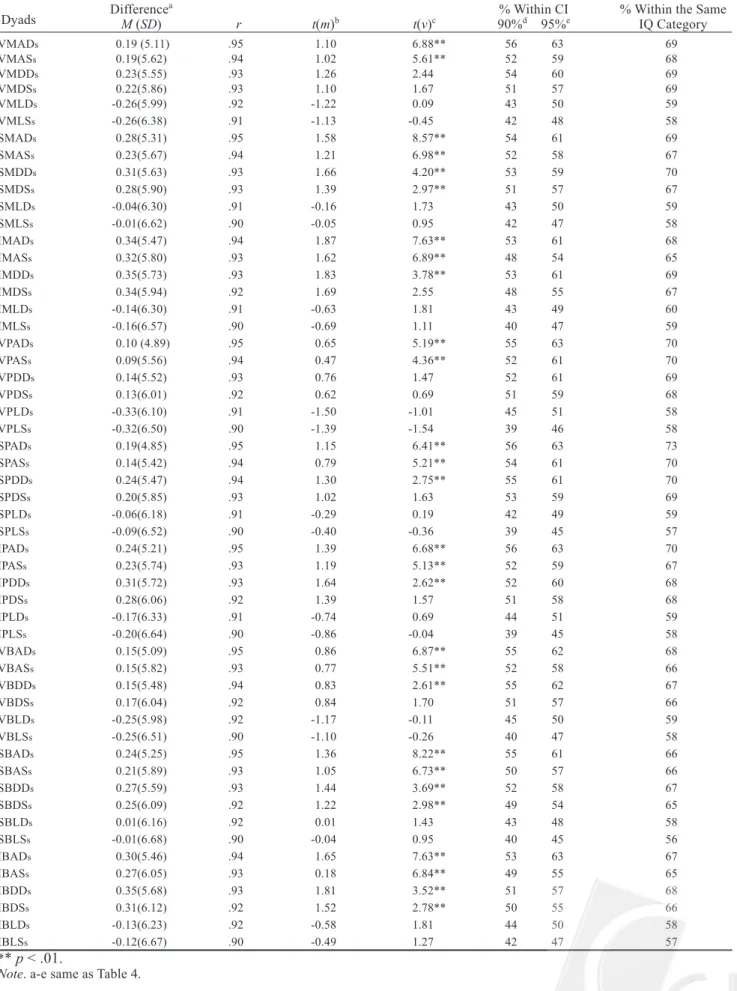
Dyads DifferenceM (SD) a r t(m)b t(v)c 90%% Within CI d 95%e % Within the SameIQ Category
VMADs -0.02 (5.07) .94 -0.13 1.71 57 64 69 VMASs -0.01(5.64) .93 -0.04 1.45 52 58 68 VMDDs 0.07(5.58) .93 0.37 1.30 54 60 67 VMDSs -0.01(5.98) .92 -0.03 0.98 49 57 68 VMLDs -0.38(6.03) .92 -1.76 -0.04 44 50 58 VMLSs -0.35(6.46) .90 -1.51 -0.25 41 47 60 SMADs 0.01(5.12) .94 0.04 1.81 57 65 70 SMASs 0.05(5.62) .93 0.27 1.72 53 59 68 SMDDs 0.04(5.60) .93 0.22 1.61 55 60 70 SMDSs 0.10(5.94) .92 0.49 1.35 51 57 66 SMLDs -0.22(6.21) .91 -1.01 0.03 44 49 60 SMLSs -0.17(6.63) .90 -0.71 0.02 43 48 57 IMADs 0.08(5.26) .94 0.45 1.83 55 61 68 IMASs 0.05(5.70) .93 0.24 1.42 48 56 66 IMDDs 0.21(5.67) .93 1.10 1.46 53 60 69 IMDSs 0.21(6.00) .92 1.06 1.23 49 55 66 IMLDs -0.35(6.18) .91 -1.57 0.40 44 50 61 IMLSs -0.37(6.59) .90 -1.57 0.20 41 47 58 VPADs -0.08 (5.03) .94 -0.45 1.56 55 63 69 VPASs -0.03(5.74) .93 -0.14 1.37 53 59 68 VPDDs 0.00(5.73) .93 0.00 1.49 50 58 67 VPDSs 0.09(6.26) .91 0.41 1.19 48 56 66 VPLDs -0.47(6.24) .91 -2.10 -0.11 43 49 58 VPLSs -0.41(6.73) .90 -1.72 -0.30 38 43 58 SPADs -0.05(4.96) .95 -0.31 2.20 55 63 71 SPASs -0.08(5.58) .93 -0.40 1.66 53 61 69 SPDDs 0.22(5.62) .93 1.18 1.74 53 59 68 SPDSs 0.08(6.04) .92 0.38 1.38 51 57 67 SPLDs -0.23(6.24) .91 -1.05 -0.03 43 48 58 SPLSs -0.20(6.65) .90 -0.83 -0.05 38 44 58 IPADs 0.05(5.23) .94 0.28 2.03 56 63 70 IPASs 0.07(5.82) .93 0.38 1.58 52 58 68 IPDDs 0.15(5.81) .93 0.79 1.73 54 59 67 IPDSs 0.12(6.23) .92 0.55 1.26 49 56 67 IPLDs -0.39(6.34) .91 -1.73 0.40 44 49 58 IPLSs -0.23(6.78) .90 -0.95 0.33 37 44 57 VBADs 0.33(5.24) .94 1.90 2.75** 54 62 67 VBASs -0.09(5.87) .92 -0.47 1.42 52 57 67 VBDDs 0.03(5.58) .93 0.16 1.56 54 62 66 VBDSs 0.03(6.23) .92 0.14 1.29 51 57 66 VBLDs -0.34(6.06) .92 -1.56 0.10 43 48 58 VBLSs -0.33(6.70) .90 -1.39 -0.02 39 45 57 SBADs 0.08(5.17) .94 0.44 2.15 56 62 67 SBASs 0.01(5.90) .92 0.01 1.47 51 57 64 SBDDs 0.07(5.63) .93 0.38 1.85 51 58 65 SBDSs 0.09(6.20) .92 0.41 1.53 48 54 64 SBLDs -0.21(6.16) .91 -0.96 0.17 43 47 59 SBLSs -0.14(6.73) .90 -0.58 0.14 39 45 55 IBADs 0.06(5.29) .94 0.34 2.05 54 61 67 IBASs 0.08(5.96) .92 0.39 1.57 50 57 66 IBDDs 0.07(5.68) .93 0.38 1.62 53 58 66 IBDSs 0.18(6.23) .92 0.86 1.46 49 55 66 IBLDs -0.28(6.20) .91 -1.27 0.66 42 48 58 IBLSs -0.32(6.72) .90 -1.33 0.43 41 46 55 ** p < .01.
a difference between estimated and actual FSIQ. b paired sample student t test for mean differences. c paired sample student t test for variance differences. d approximately ± 3.43 IQ points of the estimated true FSIQ.
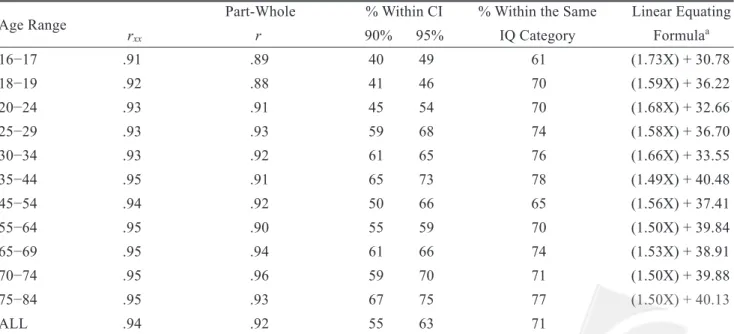
Table 5 Comparing FSIQ estimating quality of 54 tetrads by Prorated Procedure
Dyads DifferenceM (SD) a r t(m)b t(v)c 90%% Within CI d 95%e % Within the SameIQ Category
VMADs 0.19 (5.11) .95 1.10 6.88** 56 63 69 VMASs 0.19(5.62) .94 1.02 5.61** 52 59 68 VMDDs 0.23(5.55) .93 1.26 2.44 54 60 69 VMDSs 0.22(5.86) .93 1.10 1.67 51 57 69 VMLDs -0.26(5.99) .92 -1.22 0.09 43 50 59 VMLSs -0.26(6.38) .91 -1.13 -0.45 42 48 58 SMADs 0.28(5.31) .95 1.58 8.57** 54 61 69 SMASs 0.23(5.67) .94 1.21 6.98** 52 58 67 SMDDs 0.31(5.63) .93 1.66 4.20** 53 59 70 SMDSs 0.28(5.90) .93 1.39 2.97** 51 57 67 SMLDs -0.04(6.30) .91 -0.16 1.73 43 50 59 SMLSs -0.01(6.62) .90 -0.05 0.95 42 47 58 IMADs 0.34(5.47) .94 1.87 7.63** 53 61 68 IMASs 0.32(5.80) .93 1.62 6.89** 48 54 65 IMDDs 0.35(5.73) .93 1.83 3.78** 53 61 69 IMDSs 0.34(5.94) .92 1.69 2.55 48 55 67 IMLDs -0.14(6.30) .91 -0.63 1.81 43 49 60 IMLSs -0.16(6.57) .90 -0.69 1.11 40 47 59 VPADs 0.10 (4.89) .95 0.65 5.19** 55 63 70 VPASs 0.09(5.56) .94 0.47 4.36** 52 61 70 VPDDs 0.14(5.52) .93 0.76 1.47 52 61 69 VPDSs 0.13(6.01) .92 0.62 0.69 51 59 68 VPLDs -0.33(6.10) .91 -1.50 -1.01 45 51 58 VPLSs -0.32(6.50) .90 -1.39 -1.54 39 46 58 SPADs 0.19(4.85) .95 1.15 6.41** 56 63 73 SPASs 0.14(5.42) .94 0.79 5.21** 54 61 70 SPDDs 0.24(5.47) .94 1.30 2.75** 55 61 70 SPDSs 0.20(5.85) .93 1.02 1.63 53 59 69 SPLDs -0.06(6.18) .91 -0.29 0.19 42 49 59 SPLSs -0.09(6.52) .90 -0.40 -0.36 39 45 57 IPADs 0.24(5.21) .95 1.39 6.68** 56 63 70 IPASs 0.23(5.74) .93 1.19 5.13** 52 59 67 IPDDs 0.31(5.72) .93 1.64 2.62** 52 60 68 IPDSs 0.28(6.06) .92 1.39 1.57 51 58 68 IPLDs -0.17(6.33) .91 -0.74 0.69 44 51 59 IPLSs -0.20(6.64) .90 -0.86 -0.04 39 45 58 VBADs 0.15(5.09) .95 0.86 6.87** 55 62 68 VBASs 0.15(5.82) .93 0.77 5.51** 52 58 66 VBDDs 0.15(5.48) .94 0.83 2.61** 55 62 67 VBDSs 0.17(6.04) .92 0.84 1.70 51 57 66 VBLDs -0.25(5.98) .92 -1.17 -0.11 45 50 59 VBLSs -0.25(6.51) .90 -1.10 -0.26 40 47 58 SBADs 0.24(5.25) .95 1.36 8.22** 55 61 66 SBASs 0.21(5.89) .93 1.05 6.73** 50 57 66 SBDDs 0.27(5.59) .93 1.44 3.69** 52 58 67 SBDSs 0.25(6.09) .92 1.22 2.98** 49 54 65 SBLDs 0.01(6.16) .92 0.01 1.43 43 48 58 SBLSs -0.01(6.68) .90 -0.04 0.95 40 45 56 IBADs 0.30(5.46) .94 1.65 7.63** 53 63 67 IBASs 0.27(6.05) .93 0.18 6.84** 49 55 65 IBDDs 0.35(5.68) .93 1.81 3.52** 51 57 68 IBDSs 0.31(6.12) .92 1.52 2.78** 50 55 66 IBLDs -0.13(6.23) .92 -0.58 1.81 44 50 58 IBLSs -0.12(6.67) .90 -0.49 1.27 42 47 57 ** p < .01.
Among the aforementioned three suggested short forms (SMADS, SPADS, and IPADS), both Picture Completion and Matrix Reasoning were selected to represent performance subtests. Some considerations reminded us that that there might be verbal comprehension element embedded in the Picture Completion subtest; and verbal abstract reasoning ability might be involved in processing the Matrix Reasoning work. Besides, the length of Matrix Reasoning administration time could be long if some special clinical patients did unusually take the limit of 2 minutes to answer each item (notice that this subtest is un-timed in the US version). Clinicians who consider these above as crucial issues and prefer the pure visual-motor organization information which Block Design can provide, current data suggested that both SBADs and IBADs demonstrate better estimation accuracy, comparatively.
Table 5 presents the validity information for the same 54 tetrads based on prorating procedures. A majority of the values was quite similar to results from Table 4; however, half of these prorated estimates demonstrated significantly inflated
variances (p < .01). Though they remain the best estimates, the variances of the estimated FSIQs for the previously suggested SMADs, SPADs, IPADs, SBADs, and IBADs significantly deviate from the real distribution, and tend to generate more extreme estimated scores.
Generally, the distribution of the linear equating estimates fit the actual FSIQ distribution better. Results suggest the linear equating procedure may be the better solution for constituting four-subtest short forms estimates. As a result, we selected short forms based exclusively on the linear equating information.
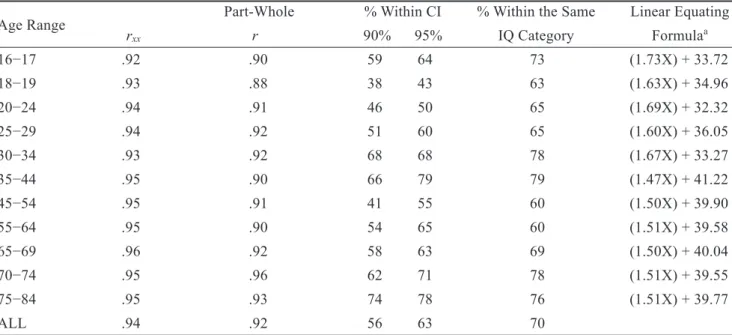
Collectively, evidence indicated that the SMADs combination is the best solution of all WAIS-III tetrads. It is the one with the best estimation accuracy, and only takes approximately 22.6 minutes to administer. Table 6 presents detailed reliability and validity information for this tetrad. Data are provided for each of the 11 age groups and the average of all age groups in the standardization sample. The linear equating formulas are also presented for practitioners, references.
The SPADs and IPADs tetrads are good also options. Estimation accuracy for these two tetrads
Table 6 Psychometric properties, estimation accuracies, and formula for calculation
of estimated FSIQ for SMADs tetrad
Age Range r Part-Whole % Within CI % Within the Same Linear Equating xx r 90% 95% IQ Category Formulaa 16−17 .91 .89 49 54 64 (1.70X) + 32.00 18−19 .93 .93 61 68 79 (1.57X) + 37.12 20−24 .94 .93 58 66 74 (1.57X) + 37.22 25−29 .95 .92 58 60 60 (1.52X) + 39.38 30−34 .95 .92 59 64 70 (1.57X) + 37.10 35−44 .95 .91 55 69 73 (1.48X) + 40.89 45−54 .95 .91 49 59 68 (1.51X) + 39.40 55−64 .95 .91 66 70 78 (1.52X) + 39.21 65−69 .95 .94 64 74 73 (1.51X) + 39.60 70−74 .95 .94 51 61 72 (1.54X) + 38.25 75−84 .96 .91 56 67 60 (1.49X) + 40.33 ALL .95 .92 57 65 70
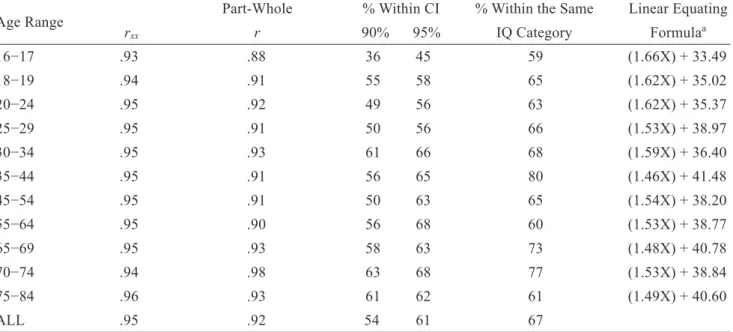
were among the best as discussed, and they save roughly 74% of the administration time. Tables 7 and 8 show detailed psychometric and estimation accuracy information for both tetrads, including data for each of the 11 age groups and the average of all age groups in the standardization sample, as well as the linear equating formulas for each age range.
Same psychometric information were also provided in Tables 9 and 10 for the other two tetrads, SBADs and IBADs, which may be better options when the clinical meaning of Block Design is highly valued. These two forms presented better estimation quality while compared to all the other forms with Block Design subtest. These two tetrads save roughly 68% of the administration time.
For each of the five suggested tetrads, the percentages of people fell into three score discrepancy categories were presented in Table 11. Discrepancy was defined as the difference between the actual and estimated FSIQs. Difference within ±5 IQ points ( roughly close to the 95% confidence interval) was considered as a match; under-estimation was considered when the estimated FSIQ is 6 or more IQ points lower than the actual FSIQ; on
the country, over-estimation was suggested when the estimated FSIQ is 6 or more IQ points higher than the actual FSIQ. These percentages reveal essential base rate information.
Data from Tables 11 demonstrates that, for ability group with FSIQ less than 120, roughly 70% to 80% of these estimated FSIQs were within ± 5 IQ points of the actual FSIQs, and the percentages of either over- or under-estimation were distributed relatively much even. However, for group with FSIQ above 120, the percentages of estimations within ± 5 FSIQ points went down to 50% to 70%, and an unbalanced trend was discerned where much more underestimation was shown, while the percentages of overestimation get unevenly lower. Moreover, besides the uneven distribution for the highest ability group, SMADs, IPADs, and IBADs seem to provide much balanced estimation for all the remaining ability groups.
For each tetrad, we further examined whether the mean discrepancies were statistically significant from zero within each ability group. Figure 1 plots the mean discrepancies by ability level. Results showed that, in the highest ability group (FSIQ
Table 7 Psychometric properties, estimation accuracies, and formula for calculation
of estimated FSIQ for SPADs tetrad
Age Range r Part-Whole % Within CI % Within the Same Linear Equating xx r 90% 95% IQ Category Formulaa 16−17 .91 .89 40 49 61 (1.73X) + 30.78 18−19 .92 .88 41 46 70 (1.59X) + 36.22 20−24 .93 .91 45 54 70 (1.68X) + 32.66 25−29 .93 .93 59 68 74 (1.58X) + 36.70 30−34 .93 .92 61 65 76 (1.66X) + 33.55 35−44 .95 .91 65 73 78 (1.49X) + 40.48 45−54 .94 .92 50 66 65 (1.56X) + 37.41 55−64 .95 .90 55 59 70 (1.50X) + 39.84 65−69 .95 .94 61 66 74 (1.53X) + 38.91 70−74 .95 .96 59 70 71 (1.50X) + 39.88 75−84 .95 .93 67 75 77 (1.50X) + 40.13 ALL .94 .92 55 63 71
Table 8 Psychometric properties, estimation accuracies, and formula for calculation
of estimated FSIQ for IPADs tetrad
Age Range r Part-Whole % Within CI % Within the Same Linear Equating xx r 90% 95% IQ Category Formulaa 16−17 .92 .90 59 64 73 (1.73X) + 33.72 18−19 .93 .88 38 43 63 (1.63X) + 34.96 20−24 .94 .91 46 50 65 (1.69X) + 32.32 25−29 .94 .92 51 60 65 (1.60X) + 36.05 30−34 .93 .92 68 68 78 (1.67X) + 33.27 35−44 .95 .90 66 79 79 (1.47X) + 41.22 45−54 .95 .91 41 55 60 (1.50X) + 39.90 55−64 .95 .90 54 65 60 (1.51X) + 39.58 65−69 .96 .92 58 63 69 (1.50X) + 40.04 70−74 .95 .96 62 71 78 (1.51X) + 39.55 75−84 .95 .93 74 78 76 (1.51X) + 39.77 ALL .94 .92 56 63 70
a X = The sum of the Similarities, Matrix Reasoning, Arithmetic, and Digit Symbol age-corrected scaled scores.
Table 9 Psychometric properties, estimation accuracies, and formula for calculation
of estimated FSIQ for SBADs tetrad
Age Range r Part-Whole % Within CI % Within the Same Linear Equating xx r 90% 95% IQ Category Formulaa 16−17 .92 .86 30 35 56 (1.65X) + 34.11 18−19 .93 .91 49 54 63 (1.59X) + 36.21 20−24 .94 .92 55 61 69 (1.61X) + 35.73 25−29 .95 .93 55 65 66 (1.53X) + 38.76 30−34 .95 .91 58 60 69 (1.55X) + 38.06 35−44 .94 .91 65 70 79 (1.48X) + 40.95 45−54 .94 .91 61 68 60 (1.59X) + 36.56 55−64 .95 .90 51 58 60 (1.51X) + 39.75 65−69 .95 .94 64 70 79 (1.50X) + 40.02 70−74 .95 .97 66 69 72 (1.52X) + 39.19 75−84 .96 .94 63 71 68 (1.49X) + 40.22 ALL .94 .92 56 62 67
Table 11 Percentage of people fell in each discrepancy category for five selected tetrads
Tetrad Discerpancya category OverallBy Full-scaled IQ ability level group
IQ ≤– 79 80-89 90-109 110-119 IQ ≥– 120
(N = 886) (n = 77) (n = 150) (n = 440) (n = 135) (n = 84)
SMADs Under-estimates ( ≤– -6 IQ points) 13.66 14.29 10.67 10.46 14.81 33.33 within ± 5 IQ points 72.01 76.62 73.33 73.86 69.63 59.52 Over-estimates ( ≥– +6 IQ points ) 14.34 9.09 16.00 15.68 15.55 7.71 SPADs Under-estimates ( ≤– -6 IQ points) 12.99 15.59 12.67 9.55 12.59 29.76
within ± 5 IQ points 73.25 75.32 76.00 72.05 77.78 65.48 Over-estimates ( ≥– +6 IQ points ) 13.77 9.09 11.33 18.41 9.63 4.76 IPADs Under-estimates ( ≤– -6 IQ points) 14.22 7.8 13.33 13.64 14.81 23.81
within ± 5 IQ points 72.23 81.82 76.67 68.41 72.59 75.00 Over-estimates ( ≥– +6 IQ points ) 13.54 10.39 10.00 17.95 12.59 1.19 SBADs Under-estimates ( ≤– -6 IQ points) 14.33 14.29 12.00 12.05 17.78 25.00
within ± 5 IQ points 71.33 80.52 70.67 70.23 71.85 69.05 Over-estimates ( ≥– +6 IQ points ) 14.33 5.19 17.34 17.73 10.37 5.95 IBADs Under-estimates ( ≤– -6 IQ points) 14.45 6.49 11.34 13.86 17.03 26.19
within ± 5 IQ points 71.33 84.42 73.33 69.77 69.63 66.67 Over-estimates ( ≥– +6 IQ points ) 14.22 9.09 15.34 16.37 13.33 7.14 a Discrepancy = (Estimated IQ – Full scaled IQ).
Table 10 Psychometric properties, estimation accuracies, and formula for
calculation of estimated FSIQ for IBADs tetrad
Age Range r Part-Whole % Within CI % Within the Same Linear Equating xx r 90% 95% IQ Category Formulaa 16−17 .93 .88 36 45 59 (1.66X) + 33.49 18−19 .94 .91 55 58 65 (1.62X) + 35.02 20−24 .95 .92 49 56 63 (1.62X) + 35.37 25−29 .95 .91 50 56 66 (1.53X) + 38.97 30−34 .95 .93 61 66 68 (1.59X) + 36.40 35−44 .95 .91 56 65 80 (1.46X) + 41.48 45−54 .95 .91 50 63 65 (1.54X) + 38.20 55−64 .95 .90 56 68 60 (1.53X) + 38.77 65−69 .95 .93 58 63 73 (1.48X) + 40.78 70−74 .94 .98 63 68 77 (1.53X) + 38.84 75−84 .96 .93 61 62 61 (1.49X) + 40.60 ALL .95 .92 54 61 67
≧ 120), all five tetrads generated statistically significant lower estimations (t = -2.95 to -6.49, p < .01). Based on these findings, it is important for practitioners to be aware that, while utilizing these factor-based tetrads, under-estimations tend to occur when estimating IQs for people with top abilities (the top 10% smartest people, roughly). Considering other short form combinations might be a better solution for this target population.
Discussion
The purpose of this investigation was to evaluate the potential utility of factor-based WAIS– III tetrads. The linear equating procedure was confirmed as the better choice, and the prorating method tended to generate more dispersed distribution for some short form combinations.
The points made by Tellegren and Briggs (1967), as well as Engelhart and colleagues (1999) that“inflated variance is less a concern for four-subtest short form”were not confirmed by the
current study. In our work, half of the 54 four-subtest prorated FSIQ estimates showed significantly inflated variances, indicating that the quality of prorating estimates is highly sensitive not only to number of subtests, but also to the specific subtests selected. Results revealed that combinations with Arithmetics or Digit Span subtests tended to generate more inflated variances while prorating FSIQ. It could be due to the fact that both subtests are known to have“ample specificity”(Kaufman & Lichtenberger, 1999), which could makes the mean value deviate more from the overall intellectual functions, and thus tended to generate more dispersed prorated FSIQ distributions.
The linear equating procedure generated reasonably stable distributions for almost all tetrads: For fifty-three of all the studied fifty-four tetrads, means and variances generated by this method were not significantly different from their corresponding actual values. The only exception was the VBADs short form where a significant dispersed variation was observed. Evidence supported using the linear
Figure 1.
Mean discrepancies between estimated and actual FSIQ for each selected tetrad by five ability leve.
SMADs SPADs IPADs SBADs IBADs 5 4 3 2 1 0 -1 -2 -3 -4 -5 M ea n D is cr ep an cy ≤ – 79 80-89 90-109 110-119 ≥– 120
equating procedure, but not the prorating method, to generate four-subtest short form estimates.
Regarding short form selection, five tetrads were recommended in this study: they are SMADs, SPADs, IPADs, SBADs, and IBADs. Among these tetrads, the Similarities-Matrix Reasoning- Arithmetic-Digit Symbol combination performed the best in terms of overall estimation qualities. Similarities-Picture Completion-Arithmetic-Digit Symbol form is a traditionally popular tetrad suggested by Kaufman (Kaufman, 1990; Kaufman, et al, 1991). It performed well in this study and further confirmed its well-recognized predictive utility when considering administration time and psychometric properties simultaneously (Allen et al., 1997; McCusker, 1994; Ward & Ryan, 1997). We also recommended Information-Picture Completion-Arithmetic-Digit Symbol Coding for its good predictive accuracy. On the average, administer these three tetrads would require merely 22.6 minutes, which is 26% of the regular administration time, and provide almost 70% of the accuracy rate when using the matching FSIQ categories as criteria.
Besides, whenever Block Design is considered more appropriate than other performance subtests, such as Picture Completion or Matrix Reasoning, results suggested Similarities-Block Design-Arithmetic-Digit Symbol and Information-Block Design-Arithmetic-Digit Symbol be the options. On the average, they take 27.6 minutes to administer, and provide roughly 67% of the accuracy rate when using the matching FSIQ categories as criteria. Actually, our suggestion of using IBADs was consistent with Blyler et al. (2000),s recommendation where they reported this factor-based short form accounts for the greatest amount of variance in FSIQ for both people with schizophrenia and control subjects (excluding Vocabulary and Matrix Reasoning subtests). Our work cross-validated their finding.
Donders and Axelrod (2002) outlined three criteria for short form selections: Reliability higher than .90, correlation higher than .82, and at least 81% of the estimated scores lie within the 90% confidence interval of the full-length predicted
score. In this study, all factor-based four-subtest short forms met the first two criteria, but not the third one. Even with the best tetrad, the proportion of misclassifications is substantial. Merely 65% of estimated FSIQs were within ± 4 points of their estimated true FSIQ, and only 70% of cases corresponded with actual FSIQ categorizations. Taking together with Chen and co-workers, (2007) findings for WAIS-III dyads, if the prediction accuracy was the main concern, considering the number of subtests in short forms beyond four seems a logical next step. For example, Ward,s (1990) popular seven-subtest short form has been found to provide a comparatively more accurate estimate of the actual FSIQ and misclassifies fewer individuals (Allen et al., 1997; Benedict, Schretlen, & Bobholz, 1992; Guilmette et al., 1999; Satterfield, Clinton, & Leiker, 1994), though it also may take twice the time compared to Kaufman,s tetrad. Obviously, the issue of how to balance the necessity between validity and time-efficiency awaits further investigation. Accordingly, these tetrads should be considered valid measures for a mere screening purpose, rather than a substitute for WAIS-III FSIQ (Ryan & Ward, 1999).
Some inevitable limitations of the present study deserve attention. First, the WAIS–III short forms do not have independent norms, and the way the examinees perform on a short form and a full battery is different (Thompson et al., 1986; Thompson & Plumridge, 1999). Over- or under-estimates of the FSIQ based on the short form thus could occur. Besides, the correlation between the estimated and actual FSIQ are inflated due to overlapping error variances (Kaufman & Lichtenberger, 2002). Users better view these short forms as preliminary, convenient screening tools. Second, research findings based on a normal population do not necessarily fully generalize to patient populations with various neurocognitive deficits. Further validity studies in these populations are necessary. Finally, our results show that these factor-based tetrads did generate significant under-estimations of the FSIQ for the top ability group (the top 10 % in the population). It might be due to the fact that we selected one subtest from each
factor for these tetrads, and thus the weight of each of the four cognitive domains (VCI, POI, WMI, PSI) for accounting for the variance of the FSIQ was equally treated as 25%. Subsequently, the overall weights of the third plus fourth factors contributing to the variance of the FSIQ are 50% for the tetrads. However, in the WAIS-III full battery, the real weights of the third and fourth factors together accounting for the variance of the FSIQ are only 27%. Accordingly, our tetrads apparently over-weighted the third and the fourth factors for interpreting the variance of the FSIQ, and thus these tetrads might not measure the same construct as the full battery does. In fact, Wechsler (1991, 2003) did find that gifted individuals obtained lower the third- and fourth-factor scores than the other twos. These findings have brought researchers, attention and subsequently an action to increase the loadings of the third and fourth factors accounting for the variance of the FSIQ has been made on the WISC-IV in US. As a result, the average FSIQ of gifted children was significantly lower than that of the WISC-III (Wechsler, 2003). Based on these findings plus the fact that an alteration of the cognitive factor weighting does diversify IQ score construct (Saklofske, Gorsuch, Weiss, Zhu, & Patterson, 2005), a caveat should be taken with care to use our tetrads in those individuals with remarkable strength or weakness on the third and fourth factors.
In conclusion, potential applications for these short forms remain numerous if the aforementioned limitations are recognized. When brief intellectual assessment for screening purposes is the main concern, or when group FSIQ averages, rather than individual FSIQ scores, in researches are desired, our evidence suggests the practical utility of SMADs, SPADs, IPADs, SBADs, and IBADs tetrads.
References
Allen, D. N., Huegel, S. G., Gurklis, Jr. J. A., Kelley, M. E., Barry, E. J., Van Kammen, D.P.(1997). Utility of WAIS-R short forms in schizophrenia. Schizophrenia Research, 26, 163-172.
Axelrod, B. N., Ryan, J. J., & Ward, L. C. (2001).
Evaluation of seven-subtest short forms of the WAIS-III in a referred sample. Archives of Clinical Neuropsychology, 16, 1-8.
Benedict, R. H. H., Schretlen, D., & Bobholz, J. H. (1992). Concurrent validity of three WAIS short forms in psychiatric inpatients. Psychological Assessment, 4, 322-328.
Blyler, C. R., Gold, J. M., Iannone, V, N., & Buchanan, R. W. (2000). Short form of the WAIS-III for use with patients with schizophrenia. Schizophrenia Research, 46, 209-215.
Boone, D. E. (1992). Evaluation of Kaufman,s short forms of the WAIS-R with psychiatric inpatients. Journal of Clinical Psychology, 48, 239-245. Chen, H. (2002). The estimated administration time and
related factors for the Wechsler Adult Intelligence Scale-Third Edition in Taiwan. Psychological Testing (Taiwan), 49, 39-50.
Chen, Y., & Chen, H. (2002). Wechsler Adult Intelligence Scale-Third Edition (WAIS-III) Manual for Taiwan. Taipei, Taiwan: The Chinese Behavioral Science Corporation.
Chen, Y., Hua, M., & Zhu, J.J. (2007). Development of the Taiwan WAIS-III Two-Subtest Short Forms. Psychological Testing (Taiwan), 54, 305-330. Cravens, T. B. (1999). Evaluation of Kaufman,
Ishikuma, and Kaufman-Packer,s short forms for use with psychiatric African American children. Journal of Psychoeducational Assessment, 17, 332-342.
Cyr, J. J., & Brooker, B. H. (1984). Use of appropriate formulas for selecting WAIS-R short forms. Journal of Consulting and Clinical Psychology, 52, 903-905.
Donders, J. (1997). A short form of the WISC-III for clinical use. Psychological Assessment, 9, 15-20. Donders, J. (2001). Using a short form of the
WISC-III: Sinful or smart? Child Neuropsychology, 7, 99-103.
Donders, J., & Axelrod, B. N. (2002). Two-subtest estimates of WAIS-III factor index scores. Psychological Assessment, 14, 360-364.
Engelhart, C. I., Eisenstein, N., Johnson, V., & Losonczy, M. (1999). Comparison of linear equating and prorated short forms for estimating WAIS–R FSIQ
in a neuropsychological population. The Clinical Neuropsychologist, 13, 95-99.
Grossman, I., Mednitsky, S., Dennis, B., Scharff, L., & Kaufman, A. S. (l993). Validation of an “amazingly”short form of the WAIS-R for a clinically depressed sample. Journal of Psychoeducational Assessment, 11, 173-181. Guilmette, T. J., Dabrowski, J., Kennedy, M. L., & Gnys,
J. (1999). A comparison of nine WAIS-R short forms in individuals with mild to severe traumatic brain injury. Assessment, 6, 33-41.
Iverson, G. I., Myers, B., & Adams, R. L. (1997). Comparison of two computational formulas for a WAIS-R seven-subtest short form. Journal of Clinical Psychology, 53, 465-470.
Kaufman, A. S. (1990). Assessing adolescent and adult intelligence. Boston: Allyn & Bacon.
Kaufman, A. S., Ishikuma, T., & Kaufman-Packer, J. L. (1991). Amazingly short forms of the WAIS-R. Journal of Psychoeducational Assessment, 9, 4-15. Kaufman, A. S., Kaufman, J. C., Balgopol, R., &
McLean, J. E. (1996). Comparison of three WISC-III short forms: weighting psychometric, clinical, and practical factors. Journal of Clinical Child Psychology, 25, 97-105.
Kaufman, A. S., & Lichtenberger, E. O. (1999). Essentials of WAIS-III Assessment. New York: Wiley.
Kaufman, A. S., & Lichtenberger, E. O. (2002). Assessing adolescent and adult intelligence (2nd ed.). Boston: Allyn & Bacon.
Kulas, J. F., & Axelrod, B. N. (2002). Comparison of seven-subtest and Satz-Mogel short forms of the WAIS-III. Journal of Clinical Psycology, 58, 773-782.
McCusker, P. J. (1994). Validation of Kaufman, Ishikuma, and Kaufman-Packer,s Wechsler Adult Intelligence Scale-Revised short forms on a clinical sample. Psychological Assessment, 6, 246-248.
Missar, C. D., Gold, J. M., & Goldberg, T. E. (1994). WAIS-R short forms in chronic schizophrenia. Schizophrenia Research, 26, 163-172.
Nagle, R. J., & Bell, N. L. (1995). Clinical utility of Kaufman,s“amazingly”short forms of
the WAIS-R with educable mentally retarded adolescents. Journal of Clinical Psychology, 51, 396-400.
Paolo, A. M., & Ryan, J. J. (1993). WAIS-R abbreviated forms in the elderly: A comparison of the Satz-Mogel with a seven-subtest short form. Psychological Assessment, 5, 425-429.
Resnick, R. J., & Entin, A.D. (1971). Is an abbreviated form of the WISC valid for Afro-Americans? Journal of Consulting and Clinical Psychology, 36, 97-99.
Reynolds, C. R., Willson, V. L., & Clark, P. L. (1983). A four-test short form of the WAIS-R for clinical screening. Clinical Neuropsychology, 5, 111-116. Robiner, W. N., Dossa, D. E., & O,Dowd, W. T. (1997).
Use of the Reynolds. Willson, and Clark WAIS-R short form in a brain-injured population: A cautionary note. The Clinical Neuropsychologist, 11, 91-95.
Ryan, J. J. (1985). Application of a WAIS-R short form with neurological patients: Validity and correlational findings. Journal of Psychoeducational Assessment, 3, 61-64.
Ryan, J. J., Larsen, J., & Prifitera, A. (1983). Validity of two- and four-subtest short forms of the WAIS-R in a psychiatric sample. Journal of Consulting and Clinical Psychology, 51, 460.
Ryan, J. J., Lopez, S. J., & Werth, T. R. (1998). A administration time estimates for WAIS-III subtests, scales, and short forms in a clinical sample. Journal of Psychoeducational Assessment, 16, 315-323.
Ryan J. J., & Ward, L. C. (1999). Validity, reliability, and standard errors of measurement for two seven-subtest short forms of the WAIS-III. Psychological Assessment, 11, 207-211.
Saklofske, D. H., Gorsuch, R. L., Weiss, L. G., Zhu, J., & Patterson, C. A. (2005). General ability index for the WAIS-III: Canadian norms. Canadian Journal of Behavioural Science, 37, 44-48. Satterfield, W. A., Clinton, W. M. Jr., & Leiker, M.
(1994). A comparison of four WAIS-R short forms in patients referred for psychological/ neuropsychological assessments. Journal of Psychoeducational Assessment, 12, 364-371.
Sattler, J. M. (2001). Assessment of children: Cognitive applications (4th ed.). San Diego, CA: Sattler. Schopp, L. H., Herrman, T. D., Johnstone, B., Callahan,
C. D., & Roudebush, I. S. (2001). Two abbreviated versions of the WAIS-III: Validation among persons with traumatic brain injury. Rehabilitation Psychology, 46, 279-287.
Silverstein, A. B. (1982). Two- and four-subtest short forms of the Wechsler Adult Intelligence Scale-Revised. Journal of Consulting and Clinical Psychology, 50, 415-418.
Silverstein, A. B. (1985a). Two- and four-subtest short forms of the WAIS-R: A closer look at validity and reliability. Journal of Clinical Psychology, 41, 95-97.
Silverstein, A. B. (1985b). An appraisal of three criteria for evaluating the usefulness of WAIS-R short forms. Journal of Clinical Psychology, 41, 676-680.
Silverstein, A. B. (1990). Short forms of individual intelligence tests. Psychological Assessment: A Journal of Consulting and Clinical Psychology, 2, 3-11.
Smith, G. T., McCarthy, D. M., & Anderson, K. G. (2000). On the sins of short-form development. Psychological Assessment, 12, 102-111.
Tam, W. C. (2004). The utility of seven-subtest short forms of the Wechsler adult intelligence scale-III in young adults. Journal of Psychoeducational Assessment, 22, 62-71.
Tellegen, A., & Briggs, P. F. (1967). Old wine in new skins: Grouping Wechsler subtests into new scales. Journal of Consulting Psychology, 31, 499-506.
Thompson, A. P. (1987). Methodological issues in the clinical evaluation of two- and four- subtest short forms of the WAIS-R. Journal of Clinical Psychology, 43, 142-143.
Thompson, A. P., Howard, D., & Anderson, J. (1986).
Two-and four-subtest short forms of the WAIS-R: Validity in a psychiatric sample. Canadian Journal of Behavioral Science, 18, 287-293. Thompson, A., & Plumridge, S. (1999). Two- and
four-subtest short forms of the WAIS-R: A comparative validity study with a normal sample. Psychological Reports, 84, 371-380.
Tulsky, D. S., Saklofske, D. H., & Zhu, J. (2003). Revising a standard: An evaluation of the origin and development of the WAIS-III. In D. S. Tulsky, D. H. Saklofske, G. J. Chelune, R. K. Heaton, R. J. Ivnik, & R. Bornstein, et al. (Eds.), Clinical interpretation of the WAIS-III and WMS-III. San Diego, CA: Academic Press.
Tulsky, D. S., Zhu, J., & Prifitera, A. (2000). Assessment of adult intelligence with the WAIS-III. In G. Goldstein & M. Hersen (Eds.), Handbook of psychological assessment (3rd ed.). Amsterdam: Pergamon.
Ward, L. C.( 1990). Prediction of Verbal, Performance and Full scal IQs from seven subtests of the WAIS-R. Journal of Clinical Psychology, 46, 436-440.
Ward, L. C., & Ryan, J. J. (1996). Validity and time savings in the selection of short forms of the WAIS-R. Psychological Assessment, 8, 69-72. Ward, L. C., & Ryan, J. J.( 1997). Validity of quick short
forms of the Wechsler Adult Intelligence Scale-Revised with brain-damaged patients. Archives of Clinical Neuropsychology, 12, 63-69.
Wechsler, D. (1991). Wechsler Intelligence Scale for Children-Third Edition (WISC-III). San Antonio, TX: The Psychological Corporation.
Wechsler, D. (1997). Wechsler Adult Intelligence Scale-Third Edition (WAIS-III). San Antonio, TX: The Psychological Corporation.
Wechsler, D. (2003). Wechsler Intelligence Scale for Children-Fourth Edition (WISC-IV) . San Antonio, TX: The Psychological Corporation.
本研究使用台灣版魏氏成人智力量表第三版之標準化樣本,共888位16至84歲之正常成年人,來檢視以魏 氏成人智力量表第三版四因素為基礎的簡短式測驗組型。以各種心理計量特質、時間限制、以及比例與線性方 程式的質性估計程序來比較54組測驗組型,結果支持使用線性方程式的程序。「類同-矩陣推理-算數-數字符 號」組型在效度、內容代表性、以及節省時間的考量上,都比其他組型為優。Kaufman(1990)的「類同-圖 畫補充-算數-數字符號」組型,以及「常識-圖畫補充-算數-數字符號」組型兩者也都是整體而言相對較佳的估 計組型。對於認為圖形設計分測驗可提供高度臨床資訊的臨床工作者,另外兩個組型,「類同 -圖形設計-算數-數字符號」與「常識-圖形設計-算數-數字符號」,亦可以提供很好的估計品質。然而,目前的發現顯示即使是 最好的組型還是有相當程度的錯誤分類比率,而且這些以四因素為基礎的測驗組型傾向會低估能力很高的正常 成年人。使用者必須注意到這些簡短版的測驗組型,主要目的僅作為篩檢的用途。本研究結果提供相對的心理 計量特質,來幫助我們選擇不同的魏氏成人智力量表第三版的簡短式測驗組型。 關鍵詞:魏氏成人智力量表第三版、簡短版、台灣常模