Modeling of Flow Resistance in Mangrove Swamp at Mouth
of Tidal Keelung River, Taiwan
Wen-Cheng Liu
1; Ming-Hsi Hsu
2; and Chi-Fang Wang
3Abstract: The effects of mangrove trees on the flow field in a tidal estuary during high freshwater discharge events are investigated using a depth-averaged two-dimensional hydrodynamic model. The model is refined to include the effects of mangrove trees on flow resistance. The resistance is described by a set of two empirical equations depending on water depth and vegetative parameters. The vegetative parameters are investigated and tested using on-site samples of Kandelia plants. The model is calibrated and verified with experimental data measured in a physical model. The agreement between the measured and computed water surface elevation is good. The model is then applied to the entire tidal Tanshui River system, which includes mangrove swamps near the mouth of the Keelung River. The flow patterns and resistance distributions are investigated for several scenarios of high flow events. The results show that the refined model provides an ideal management tool for the mangrove swamps.
DOI: 10.1061/共ASCE兲0733-950X共2003兲129:2共86兲
CE Database keywords: Mathematical models; Hydrodynamics; Flow resistance; Taiwan; Swamps.
Introduction
Vegetation in rivers produces high resistance to flow and, as a result, has a large impact on the water level and flow in rivers and estuaries. For this reason, the friction factor associated with veg-etation is an important aspect of the tasks dealing with conserva-tion of land and hydraulic structures, and with the calibraconserva-tion and validation of river hydraulic models.
The flow resistance problem can be classified into two categories—submerged vegetation and nonsubmerged vegetation. For the short vegetation, Kouwen and Unny共1973兲 used the loga-rithmic velocity profile of the turbulent boundary layer to develop an approach to estimate the roughness height for the flow over submerged and flexible grass. Kouwen 共1992兲 also showed that his method could reproduce the n⫺VR curves 共USDA handbook 1954兲 and was easy to apply in practice. A similar approach was used to model flow above and through forest canopies by Lemon
共1967兲; Thom 共1975兲; and De Bruin and Moore 共1985兲. In such an
approach, the characteristics of the flow above the roughness height were used to estimate the drag on the vegetation. For the flow of water through nonsubmerged vegetation, previous inves-tigations resulted in a series of relationships with only a very limited range of applicability, mainly for very low velocity when the deflection of vegetation is negligible and for canopies with
low vegetation density. Most practitioners used photographs and tables to estimate Manning’s n values共Chow 1959; Barnes 1967; Arcement and Schneider 1989兲.
Walton and Christensen共1980兲 presented an analytical method for estimating the friction loss induced by rigid, cylindrical, non-submerged roughness elements. Wu et al. 共1999兲 used a simpli-fied model for evaluating the nonsubmerged and submerged veg-etation resistance with hydraulic and vegetative parameters. Their experimental results revealed that the roughness coefficient de-creases with increasing depth under the nonsubmerged condition. When fully submerged, the vegetative roughness coefficient tends to increase with depth at lower depths but then decreases to an asymptotic constant as the water level continues to rise. Freeman et al. 共2000兲 conducted more than 220 experiments in a flume, using 20 different plant species. Experiments were conducted with both homogeneous and mixed plant groupings. The plant types included single-stem and multiple-stem plants, and plants with and without leaves. Plant density, spacing, and size were varied in the experiments. Resistance equations for submerged and partially submerged vegetation, respectively, were proposed from the experimental results.
The Kuan-Du wetland is situated at the mouth of the Keelung River, a tributary of the Tanshui River system in Taiwan. It is covered with mangrove trees and serves as the habitat for many plant species, a nursing area for juvenile fish, and a feeding ground for a variety of aquatic animals as well as water fowl and birds. It retards surface water runoff, helps groundwater recharge, and protects the shoreline from erosion. It also helps to purify the water quality by retaining or transforming waste and nutrients. However, during the flooding events, mangrove causes high re-sistance to the flow and impacts on the water levels in the Kee-lung River. Sound management decisions necessitate a knowledge of the water flow in the mangrove swamps and surrounding wa-ters. The purpose of this study is to modify a hydrodynamic model to include the influence of flow resistance by mangroves in the Kuan-Du wetland on water levels in the Keelung River. The results should provide a tool to help develop strategies for man-1Senior Research Engineer, Hydrotech Research Institute, National
Taiwan Univ., Taipei 10617, Taiwan. E-mail: wcliu@hy.ntu.edu.tw
2Professor, Dept. of Bioenvironmental Systems Engineering, National
Taiwan Univ., Taipei 10617, Taiwan 共corresponding author兲. E-mail: mshsu@ccms.ntu.edu.tw
3Doctoral Student, Dept. of Bioenvironmental Systems Engineering,
National Taiwan Univ., Taipei 10617, Taiwan.
Note. Discussion open until August 1, 2003. Separate discussions must be submitted for individual papers. To extend the closing date by one month, a written request must be filed with the ASCE Managing Editor. The manuscript for this paper was submitted for review and pos-sible publication on January 23, 2002; approved on July 29, 2002. This paper is part of the Journal of Waterway, Port, Coastal, and Ocean
Engineering, Vol. 129, No. 2, March 1, 2003. ©ASCE, ISSN
grove management in the Kuan-Du mangrove wetland from the flood control perspective.
Study Site
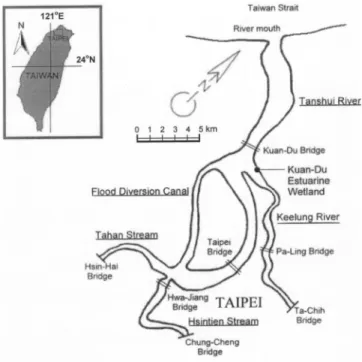
The Tanshui River共Fig. 1兲 is the largest tidal river in Taiwan. The entire river system has a drainage area of 2,726 km2, and a total channel length of 327.6 km. It consists of three major tributaries—the Tahan Stream, Hsintien Stream, and Keelung River. The downstream reaches of all three tributaries are affected by the tide共Hsu et al. 1999; Liu et al. 2001兲. The Kuan-Du wet-land 共Fig. 2兲 is situated at the confluence of the Keelung River and Tanshui River, lying on an alluvial fan that accumulates de-posits of suspended materials, nutrients, and biological debris flushed from all three tributaries. The mean tidal ranges at the Tanshui River mouth and near the Kuan-Du wetland are 2.22 and 2.26 m, respectively, in 1994. The mean discharges at the tidal limits of the three major tributaries are 41.0, 57.5, and 25.3 m3/s
for the Tahan Stream, Hsintien Stream, and Keelung River, re-spectively. In the Keelung River, seawater intrusion averages about 10 km.
Because of its vast area and topographic effects, the Kuan-Du wetland forms a complicated environment of estuarine wetland, coastal wetland, and inland wetland. It is the most popular land-scape among the 12 remaining estuarine wetlands in Taiwan. Be-fore 1968, the Kuan-Du wetland had an area of 160 ha. A dike of 3.5 m in height was constructed in 1968 to carve out 85% of the
Fig. 1.Map of Tanshui River estuarine system
Fig. 2.Kuan-Du estuarine wetland
Fig. 3. Computational flowchart
area for development. The dike was designed to protect against the five-year flood. Several gates were built for drainage of the carved-out area inside the dike. A part of the area remains as wetland and is slightly affected by the tide. It becomes dominated by low salinity vegetation, with approximately 175 species of plants. The major species are Scripus, Typha, Carex Phragmites, and Communis. The wetland outside of the dike is filled with mangroves Kandelia that can tolerate higher salinity and form the typical tidal salt marsh ecosystem. The Kuan-Du wetland is situ-ated in the waterway of the Keelung River. The large area of mangrove is bound to retard the water flow and reduce the pass-ing area of the water flow so as to increase the river stage durpass-ing flood events.
Model Description
The RMA2 model, a two-dimensional depth-averaged finite-element hydrodynamic numerical model, is modified and applied to the tidal portion of the Tanshui River system. The model was developed by King and Norton共1985兲. It has been used to calcu-late water levels and flow distribution around islands, around bridges having one or more relief openings, in contracting and expanding channel reaches, in channels leading into or out of a pumping plant, and in water bodies with wetlands. It has also been used to simulate general water levels and flow patterns in rivers, reservoirs, and estuaries. It computes water surface eleva-tion and horizontal velocity components for subcritical, free-surface flow in two-dimensional flow fields. Bed friction is cal-culated by the Manning’s equation with a fixed n value and eddy viscosity is used to define turbulence characteristics. Both steady and unsteady state共dynamic兲 flows can be simulated.
Governing Equations
The generalized computer program RMA2 solves the depth-integrated equations of water volume and momentum conserva-tion in two horizontal direcconserva-tions. The governing equaconserva-tions are
h t ⫹h
冉
u x ⫹ v y冊
⫹u h x ⫹v h y ⫽0 (1)Fig. 5.Model calibration results using flood of 20-year return period Table 1. Boundary Conditions for Model Simulations
Return period 共year兲 Upstream Boundary Downstream Boundary Keelung River 共m3/s兲 Hsintien Stream 共m3/s兲 Tahan Stream 共m3/s兲 Water surface elevation at river mouth 共m兲 20 2,400 7,500 6,100 1.29 10 2,120 6,300 4,980 1.27 5 1,780 4,800 3,820 1.23 2 1,200 2,800 2,200 1.21
hut ⫹huu x ⫹hv u y⫺ h
冉
xx 2u x2⫹xy 2u y2冊
⫹gh冉
z x ⫹ h x冊
⫹gun 2 h1/3 共u2⫹v2兲1/2⫽0 (2) ht ⫹v uhx ⫹v vhy⫺v h冉
y x 2v x2⫹y y 2v y2冊
⫹gh冉
z y ⫹ h y冊
⫹gvn 2 h1/3 共u2⫹v2兲1/2⫽0 (3)where t⫽time; x and y⫽horizontal coordinates; h⫽depth; u and
v⫽velocity components in the x- and y-directions, respectively;
⫽water density; ⫽eddy viscosity 共dynamic兲; subscript xx ⫽normal direction on x-axis surface; subscript yy⫽normal
direc-tion on y-axis surface; subscripts xy and y x⫽shear direction on each surface; g⫽gravitational acceleration; z⫽bottom elevation; and n⫽Manning’s friction coefficient.
Eqs.共1兲–共3兲 are solved by the finite-element method using the Galerkin method of weighted residuals. The elements may be one-dimensional lines, or two-dimensional quadrilaterals or tri-angles, and may have curved共parabolic兲 sides. The shape func-tions are quadratic for velocity and linear for depth. The solution is fully implicit and the set of simultaneous equations is solved by Newton-Raphson nonlinear iteration.
Model Modification
In the RMA2 model, the friction between flowing water and the bed is described by Manning’s formula under the assumption that Manning’s n does not depend on the water depth. In this study, a depth-related Manning’s friction coefficient is used to model veg-etation in the mangrove wetland. The resistance equations devel-oped by Freeman et al. 共2000兲 for submerged and partially sub-merged vegetation are adopted and used to modify the model. The Manning’s friction coefficient is related to hydraulic and vegeta-tion parameters as follows:
n⫽3.487⫻10⫺5
冉
EAs Ai*V* 2冊
0.15 共M Ai*兲0.166冉
V*Rh 冊
0.622冉
Rh2/3S1/2 V *冊
(4) for partially submerged vegetation, andn⫽0.183
冉
EAs Ai*V* 2冊
0.183冉
T h冊
0.243 共M Ai*兲0.273 ⫻冉
V *Rh冊
0.115冉
Rh 2/3 S1/2 V *冊
(5) for submerged vegetation, where Ai⫽frontal area of an individual plant blocking flow; Ai*⫽net submerged frontal area of a partially submerged plant; As⫽total cross-sectional area of all stems of anindividual plant; E⫽modulus of plant stiffness; M⫽relative plant density; Rh⫽hydraulic radius; S⫽energy slope; T⫽average un-deflected plant height; V
*⫽shear velocity; and⫽kinematic vis-cosity. Eq.共4兲 is for partially submerged flow with h⭐0.8T. Eq.
共5兲 is to be applied only for submerged flow defined by h ⬎0.8T.
Measurements of Vegetation Parameters
Kandelia samples from the Kuan-Du wetland were collected and
tested in the laboratory to determine the vegetation parameters. Their moduli of plant stiffness were measured by applying a con-centrated load at the middle point of the tree stem that was sup-ported by rollers at its two ends. The deflection at the point where the load was applied was measured. With known tree size, load, and the relative deflection, the modulus of plant stiffness was calculated by
E⫽ PT
3
48I⌬y (6)
where P⫽load; I⫽second area moment of inertia (I
⫽D4/64); D⫽stem diameter; and ⌬y⫽deflection.
According to previous research by Freeman共1997兲 and Free-man et al.共1998兲, the modulus of plant stiffness can be estimated from a relationship of E to the ratio of (T/D)1.5. The relationship between the data measured in our tests may be described by the equation
E⫽1.89⫻106
冉
TD
冊
1.5
(7) The blockage areas of partially submerged and submerged vegetation (Ai* and Ai) can be approximated using the following equations:
Ai*⫽
再
D•h when h⬍T⬘
D•T⬘⫹共h⫺T⬘兲•W when h⭓T⬘ (8) Ai⫽D•T⬘⫹共T⫺T⬘兲•W when h⭓T (9)
where T⬘⫽height of the trunk; and W⫽average plant width. Ac-cording to the measured data from Kandelia samples, the height of the trunk and average plant width can be estimated from the average undeflected plant height. The equations are given as fol-lows:
W⫽0.623•T (10)
T⬘⫽0.495•T (11)
The measurement of Kandelia samples in this study also pro-vided a relationship between height and stem diameter
D⫽1.04•eT/142.4 (12)
Shao共1999兲 conducted a field investigation of the Kuan-Du man-grove wetland and found that the relative plant density of
Kande-lia is 1.14 plants/m2.
Computational Procedure
The modified model is applied to simulate flow resistance of the mangrove wetland in the Keelung River mouth. First, the model is supplied with the geometric data, vegetation distributions in the mangrove wetland, initial trial values of the Manning’s friction coefficient, and boundary conditions at the downstream and up-stream reaches. Eqs.共1兲–共3兲 are used to calculate the flow fields.
Then, having obtained the flow field conditions, Eqs.共4兲 and 共5兲 are implemented to calculate the Manning’s friction coefficient in the mangrove Kandelia zone under those flow fields. The differ-ences between the calculated values of the Manning’s friction coefficient in the mangrove wetland and the initial trial value are compared with a predetermined tolerance. If the tolerance value is exceeded, the calculation of flow fields is repeated with the newly calculated values of the Manning’s friction coefficient. The itera-tion cycle is repeated until the differences of the values of the Manning’s friction coefficient between successive estimates are less than the tolerance value. Fig. 3 presents the computational flowchart.
Model Calibration and Verification
The hydrodynamic model is supplied with data describing the geometry of the Tanshui River system. The field surveys in 1996 and 1997 by the Taiwan Water Resources Agency measured the cross-sectional profiles at about 0.5 km intervals along the tidal portion of the river. These data are used to set up the model grid. Fig. 4 shows the grid elements in the computational domain that
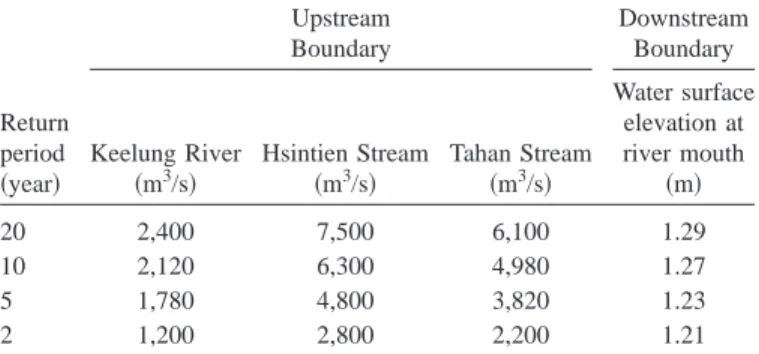
Fig. 7.Model prediction for flood of 10-year return period:共a兲 Man-ning’s friction coefficient;共b兲 water depth 共m兲; 共c兲 velocity 共m/s兲
includes 4,844 elements and 14,740 nodes. The upstream and downstream boundary conditions are specified with freshwater discharge and water surface elevation, respectively.
The friction coefficient is an important parameter affecting the calculation of the water surface elevation in the Tanshui River system during flood periods. A single value of the friction coeffi-cient is used in the main channel, and is validated with experi-mental data. The Taiwan Water Resources Agency 共1996兲 con-ducted several physical model experiments of the Tanshui River system simulating flood scenarios of different return periods. The water surface elevations at various locations were measured. No measurements of discharge or velocity were made in these experi-ments. The data from the physical model are used to calibrate and verify the numerical model. The flood of the 20-year return period is used for model calibration, and the 5-year flood is used for model verification. The formulations of the Manning’s friction coefficient for the partially submerged and submerged vegetation in the refined model are used for both the model calibration and verification procedures. The upstream boundaries are specified at the Hsin-Hai Bridge, Chung-Cheng Bridge, and Ta-Chih Bridge for the Tahan Stream, Hsintien Stream, and Keelung River, re-spectively. Table 1 presents the freshwater discharges at these upstream boundaries and water surface elevation at the Tanshui River mouth. Figs. 5 and 6 present the model calibration and
verification results. The computed water surface elevation is com-pared with the physical model measurements. The measured and computed water surface elevations along the river system were averaged over each transect. The calibration results of the mean absolute difference and the root-mean-square difference between the computed and measured data are 3.7 and 5.9 cm, respectively. The verification results of the mean absolute difference and the root-mean-square difference are 5.9 and 12.8 cm, respectively. The results show reasonable agreement between the model pre-dictions and measured data.
Model Application
The calibrated and verified model is then used to perform model simulations in the Tanshui River system to investigate the flow resistance in the Kuan-Du mangrove swamps near the Keelung River mouth. The values of the Manning’s friction coefficient in the channels of the river system have been determined by calibra-tion and verificacalibra-tion processes; no further adjustment to the val-ues is made. The valval-ues of the Manning’s friction coefficient in the Kuan-Du mangrove swamps are calculated using Eqs.共4兲 and
共5兲. Two model runs are conducted with the 10-year and two-year
floods, respectively. The freshwater discharges at the upstream boundaries and the water surface elevations at the Tanshui River mouth are also listed in Table 1.
Fig. 7 presents the computed values of the Manning’s friction coefficient, water depth, and velocity in and around the Kuan-Du mangrove swamp for the 10-year flood. The values of the Man-ning’s friction coefficient in the Kuan-Du mangrove swamps range from 0.088 to 0.281, with a standard deviation of 0.042. Similar trends exist between the Manning’s friction coefficient and the mangrove height distributions. Higher mangroves induce larger friction. Water depth ranges from 2.51 to 4.25 m, with a standard deviation of 0.23 m. The velocity field shows higher velocity in the channel and lower velocity in the mangrove swamp. The results predicted by the modified model are deemed reasonable.
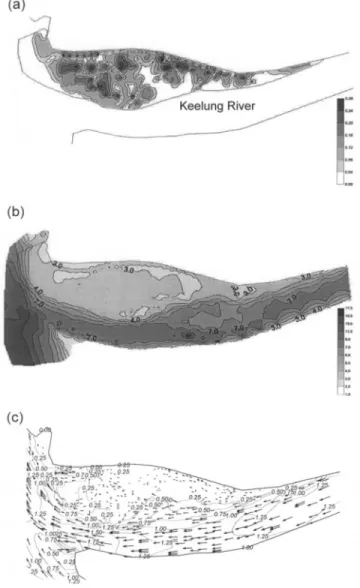
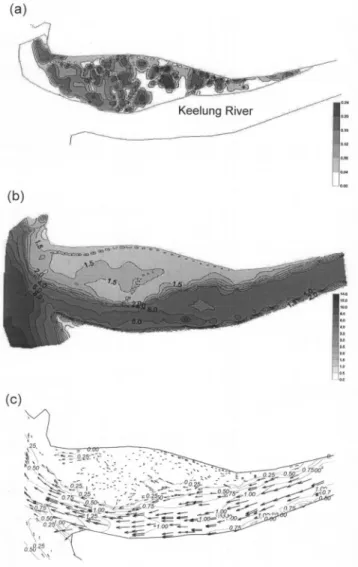
Fig. 8 presents the computed Manning’s friction coefficient, water depth, and velocity in and around the Kuan-Du mangrove swamps during the two-year flood. The values of the Manning’s friction coefficient in the mangrove swamp range from 0.045 to 0.241, with a standard deviation of 0.048. Water depth ranges from 0.88 to 2.54 m, with a standard deviation of 0.22 m. For the flood of the two-year return period, the Manning’s friction coef-ficients are lower than those of the 10-year flood event, and its standard deviation is higher. It is because more areas of partially submerged vegetation exist during the two-year flood event, and thus produce a higher standard deviation. The modeling results also reveal that the mangrove swamp has a lower velocity共below 0.25 m/s兲 during the two-year flood event.
Conclusions
A numerical hydrodynamic model is refined and applied to the Tanshui River estuarine system in Taiwan. The model is a depth-integrated two-dimensional model, with the formulations of the Manning’s friction coefficient for the submerged and partially submerged vegetations added to simulate flow resistance in the mangrove swamps. The model has been calibrated and verified with measured water surface elevation in the physical model ex-periments using the floods of 20-year and 5-year return periods,
Fig. 8. Model prediction for flood of two-year return period: 共a兲 Manning’s friction coefficient;共b兲 water depth 共m兲; 共c兲 velocity 共m/s兲
respectively. The results show reasonable agreement between the model predictions and measured data that are averaged over each transect along the river system.
The validated model is then used to investigate the flow resis-tance in the Kuan-Du mangrove swamps located at the Keelung River mouth under the flood events of 10-year and two-year re-turn periods. It is found that the mangrove trees have a significant impact on the flow structure in the mangrove swamps. The distri-bution of the Manning’s friction coefficient in the mangrove
Kan-delia has a similar tendency as the growth distribution of Kande-lia. Higher mangrove trees induce a larger Manning’s friction
coefficient. As the freshwater discharge increases, the hydraulic condition is less sensitive to the vegetative resistance. These re-sults suggest that the mangrove vegetation has a significant im-pact on the hydrodynamic processes in the estuary and, in turn, has a vital impact on the ecosystem of mangrove swamps. The refined model provides a tool to assist with management decisions through the understanding of the water flow and resistance in the mangrove swamps and surrounding waters.
Acknowledgments
This research was conducted as part of a grant supported by the National Science Council of Taiwan. The writers would like to express their appreciation to the Taiwan Water Resources Agency for providing the experimental data from the physical model. The writers are also thankful to Dr. Albert Y. Kuo for his helpful reviews and comments.
Notation
The following symbols are used in this paper: Ai ⫽ frontal area of individual plant blocking flow;
Ai* ⫽ net submerged frontal area of partially submerged plant;
As ⫽ total cross-sectional area of all stems of individual plant;
D ⫽ stem diameter;
E ⫽ modulus of plant stiffness; g ⫽ gravitational acceleration; h ⫽ water depth;
I ⫽ second area moment of inertia; M ⫽ plant density;
n ⫽ Manning’s friction coefficient; P ⫽ load;
Rh ⫽ hydraulic radius;
S ⫽ energy slope;
T ⫽ average undeflected plant height; T⬘ ⫽ height of trunk; t ⫽ time; u ⫽ velocity in x-direction; V * ⫽ shear velocity; v ⫽ velocity in y-direction;
W ⫽ average plant width; x ⫽ horizontal coordinate; y ⫽ horizontal coordinate; z ⫽ elevation of bottom; ⌬y ⫽ deflection;
⫽ eddy viscosity; ⫽ water density; and
⫽ kinematic viscosity. Subscripts
xx ⫽ normal direction on x-axis surface; xy ⫽ shear direction on each surface; yx ⫽ shear direction on each surface; and yy ⫽ normal direction on y-axis surface.
References
Arcement, G. J. Jr., and Schneider, V. R. 共1989兲. ‘‘Guide for selecting Manning’s roughness coefficients for natural channels and flood plains.’’ Water Resources Paper 2339, U.S. Geological Survey, Wash-ington, D.C.
Barnes, H. H. Jr.共1967兲. ‘‘Roughness characteristics of natural channels.’’
Water Resources Paper 1849, U.S. Geological Survey, Washington,
D.C.
Chow, V. T.共1959兲. Open channel hydraulics, McGraw-Hill, New York. De Bruin, H. A. R., and Moore, C. J.共1985兲. ‘‘Zero-plane displacement and roughness length for tall vegetation, derived from a simple mass conservation hypothesis.’’ Boundary-Layer Meteorol., 31, 39– 49. Freeman, G. E.共1997兲. ‘‘Analysis and prediction of plant stiffness
modu-lus for selected plants.’’ Federal Contract No. DACW-39-97-M-1413, U.S. Waterway Experiment Station, U.S. Army Corps of Engineers, Vicksburg, Miss.
Freeman, G. E., Copeland, R. R., and Rahmeyer, W. H.共1998兲. ‘‘Field determination of Manning’s n value for shrubs and woody vegeta-tion.’’ USCID Conf.
Freeman, G. E., Rahmeyer, W. H., and Copeland, R. R.共2000兲. ‘‘Deter-mination of resistance due to shorts and woody vegetation.’’ Rep.
ERDC/CHL TR-00-25, Engineer Research and Development Center,
U.S. Army Corps of Engineers.
Hsu, M.-H., Kuo, A. Y., Kuo, J.-T., and Liu, W.-C.共1999兲. ‘‘Procedure to calibrate and verify numerical models of estuarine hydrodynamics.’’ J.
Hydraul. Eng., 125共2兲, 166–182.
King, I. P., and Norton, W. R. 共1985兲. ‘‘Operating instructions for the computer program, RMA-2.’’ Rep., Resource Management Associ-ates, Lafayette, Calif.
Kouwen, N.共1992兲. ‘‘Modern approach to design of grassed channels.’’ J.
Irrig. Drain. Eng.,, 118共5兲, 733–743.
Kouwen, N., and Unny, T. E.共1973兲. ‘‘Flexible roughness in open chan-nels.’’ J. Hydraul. Div., Am. Soc. Civ. Eng., 99共5兲, 713–728. Lemon, E. R.共1967兲. ‘‘Aerodynamic study of CO2exchange between the
atmosphere and the plant.’’ Harvesting the sun: Photosynthesis in
plant life, Academic, San Diego, 263–290.
Liu, W.-C., Hsu, M.-H., and Kuo, A. Y.共2001兲. ‘‘Investigation of long-term transport in Tanshui River estuary, Taiwan.’’ J. Waterw., Port,
Coastal Ocean Eng., 127共2兲, 61–71.
Shao, K. T.共1999兲. ‘‘A study on biological resources change in Kuan-Du natural reservation and Kuan-Du natural park.’’ Rep. Prepared for
Bureau of Economic Development, Taipei City government, Taipei,
Taiwan共in Chinese兲.
Taiwan Water Resources Agency.共1996兲. ‘‘Reset up the physical model of Tanshui River system and verify flood protection project of Taipei.’’ Rep., Taipei, Taiwan共in Chinese兲.
Thom, A. S.共1975兲. ‘‘Momentum, mass and heat exchange of plant com-munities.’’ Vegetation and atmosphere, Vol. 1, J. L. Monteith, ed., Academic, San Diego, 57–109.
USDA handbook of channel design for soil and water conservation.
共1954兲. Soil Conservation Service, U.S. Department of Agriculture, Washington, D.C.
Walton, R., and Christensen, B. A. 共1980兲. ‘‘Friction factors in storm surges over inland areas.’’ J. Waterw., Port, Coastal Ocean Div., Am.
Soc. Civ. Eng., 106共2兲, 261–271.
Wu, F.-C., Shen, H. W., and Chou, Y.-J.共1999兲. ‘‘Variation of roughness coefficients for unsubmerged and submerged vegetation.’’ J. Hydraul.