AmericanJournal ofPathology, Vol. 152, No. 1,January 1998 Copyrngbt American SocietyforInvestigativePathology
Epstein-Barr
Virus LMP1 Modulates the Malignant
Potential of
Gastric Carcinoma Cells Involving
Apoptosis
Lai-Fa Sheu,* Ann
Chen,* Yu-Hui Wei,*
Kuo-Chieh Ho,t Jye-Young
Cheng,t
Ching-Liang
Meng,§
and Wei-Hwa Lee*
From theDepartmentsof Pathology,* Surgery,t and
Dentistry,s
Tn-Service GeneralHospital, National Defense Medical Center, and theDepartment of Botany,t National Taiwan University,Taipei,
Taiwan, Republic of ChinaAbout 10% of
gastric carcinomas
including
lympho-epithelioma-like
carcinoma and
adenocarcinoma
areassociated with
Epstein-Barr virus
(EBV) infection.
InEBV-associated gastric carcinomas, the
tumorcells
express
Epstein-Barr nuclear
antigen
1(EBNA-1) but
not
EBNA-2, -3A, -3B,
or-3C, leader
protein,
orlatent
membrane
proteins
(LMPs) because of
genemethyl-ation.
Only
afew
exceptional
caseshave
LMP1expres-sion in
tumorcells asdemonstrated
by
immunohis-tochemical
studies. To elucidate the
biological effects
of LMP1
and the
significance of its restricted
expres-sion in
EBV-associated gastric
carcinomas, the LMP1
genewas
transferred
into
EBV-negative gastric
carci-nomaceli
lines
(SCM1 and TMC1) and into
EBV-neg-ative
nasopharyngeal
carcinoma
(NPC)
cells
(HONE-1)
as acontroL The
biological effects of LMP1
in
gastric carcinoma cells
weremonitored in vitro
and
invivo.
These results showed that the
conse-quenceof
LMP1
expression is
agrowth enhancement
in
NPC
cells,but
it is
agrowth suppression in gastric
carcinoma
cells.The
LMPl-expressing gastric
carci-noma cellshad
areduced
growth
rate,colony-form-ing
efficiency,
meancolony size, and
tumorigenicity
and
alower
malignantcytological grade. The reduced
growth
rate,colony-forming efficiency, and
meancolony size
werepartially reversible in vitro with
treatmentwith LMP1
antisense
oligonucleotide.
Inad-dition, enhanced apoptosis
wasfound in the
LMP1-expressing gastric carcinoma
cells.This
suggeststhat
LMP1 maynegatively modulate the
malignant poten-tialof
gastric carcinoma
cellsviaanenhancement of
apoptosis.
Weconcluded that the restriction of
LMP1expression in EBV-associated
gastric carcinomas
maylead
toagrowth
advantage for
tumorcellsby
avoiding
LMP1apoptotic effects and immunologically
medi-ated
elimination.
(Am
J
Pathol
1998,
152:63-74)
Epstein-Barr virus (EBV),
ahuman herpesvirus,
cancause
infectious mononucleosis and is
closely
associ-ated with endemic Burkitt's
lymphoma, nasopharyngeal
carcinoma (NPC), lymphoproliferative diseases in
immu-nocompromised
patients,1 nasal T-cell lymphomas,2'3
and
someHodgkin's
diseases.4 EBV
wasfirst shown to
be associated with gastric carcinomas
by Burke et al in
1990.5 This association
wascharacterized
by the
pres-ence
of the EBV
genomein
gastric carcinoma with
marked stromal
lymphocytic infiltration,
atype
histologi-cally similar
to
nasopharyngeal lymphoepithelioma. EBV
involvement has also been demonstrated in
gastric
ade-nocarcinoma and adjacent
dysplastic epithelia.6 The
ev-idence of
carcinogenesis of EBV has been shown,
includ-ing
analmost
uniform involvement of EBV in
tumor
cells
with
monoclonal proliferation and
anelevation of
EBV-specific antibodies
in
patients.7'
Approximately
10%
of
gastric carcinomas
areassociated
with EBV infection.9
In
EBV-associated
gastric carcinomas, the
tumor
cells
ex-clusively
expressEpstein-Barr
nuclear
antigen
1
(EBNA-1) but
not
EBNA-2, -3A, -3B,
or-3C,
leader
pro-tein,
orlatent
membrane
proteins
(LMPs) because
of
gene
methylation.7'10
Only
afew
exceptional
cases ex-pressLMP1 in
tumor
cells
asdemonstrated
by
immuno-histochemical
studies.9'11
LMP1
is
anintegral membrane protein that consists of
a24-amino-acid
amino-terminal
cytoplasmic domain,
six
membrane-spanning hydrophobic domains separated
by short
reverseturns,
and
a200-amino-acid
carboxyl-terminal
cytoplasmic domain.12'13 LMP1 aggregates
in
patches
onthe
plasma membrane14 and
canengagethe
tumor
necrosis factor
receptor
(TNFR)
family-associated
proteins for the TNFR
family.15'16 The interaction of LMP1
with
these TNFR
family-associated proteins
may proveto
be
important
in
the
biological effects of LMP1. LMP1 has
properties of
aclassical
oncogene.LMP1
cantransform
rodent
fibroblast cell lines
asassayed by
tumorigenicity
in
nude mice
and foci formation.17,16
In
Burkitt's
lym-Supportedby grants from the National Science Council(NSC 85-2331-B-016-040), Tri-Service General Hospital (TSGH-C85-44 and TSGH-C86-46),and NationalDefense Medical Center(NDMC-85),Taipei,
Tai-wan, Republicof China.
Acceptedforpublication October 17, 1997.
Addressreprintrequests toDr.Lai-FaSheu, Department of Pathology, Tri-Service GeneralHospital, 8, Sec. 3,Ting-ChowRoad, Taipei,Taiwan,
Republic of China.
64
Sheu et al
AJPJanuary1998, Vol. 152, No. 1
phoma cells, LMP1 can induce villous
projections,
growth
in a
tight
clump, NF-KB activity, and
the
expression
of
activation markers
(CD23 and CD40), adhesion
mole-cules
(ICAM1, LFAl,
and
LFA3), and bcl-2
proto-onco-gene19'22
and can
inhibit p53-triggered apoptosis.23
EBV
recombinant genetic
analysis
indicates that
LMP1
is
essential
for primary B-lymphocyte transformation.24
In
squamous
epithelial
cells, the
consequences
of LMP1
expression
are
inhibition
of cellular
differentiation,25
mor-phological
transformation,26
and
induction of
epidermal
growth
factor
receptors.27 In
transgenic mice, LMP1 is
able
to
alter keratin
expression and induce hyperplasia of
the
skin.28 However,
LMP1 is
cytotoxic
in
a variety
of
cell
lines
and
induces
apoptosis
in
squamous epithelial cells
when
expressed
at a
high
level.2930 Collectively,
it
seems
that
the biological effects of LMP1
are
complicated.
Although
the relationship between EBV and gastric
carcinoma
has
been
demonstrated, the biological effects
of EBV infection and the
significance of restricted
LMP1
expression in
EBV-associated gastric carcinomas
are
still
unknown. To
our
knowledge, there has been
no
EBV-associated
gastric carcinoma cell line
or
EBV-immortal-ized
gastric
epithelial
cell
line
established.
Establishing
an
EBV-infected
gastric carcinoma
in
vitro
may
be
com-plicated
because of
the
absence of the EBV receptor
(CD21)
in
gastric epithelium
and
gastric carcinoma
cells.31
The evaluation
of
biological effects of
EBV
infec-tion
in
gastric carcinoma cells could
not
be
performed
in
our
study.
However, the expression of LMP1
gene in
EBV-negative gastric carcinoma cells by
gene
transfer is
one
of the
more
convenient methods
for the
initial
evalu-ation
of the
biological effects of EBV infection and the
significance
of restricted
LMP1
expression in
EBV-asso-ciated
gastric
carcinomas.
In
this
study,
the
LMP1 gene
was
introduced into
gastric carcinoma cells, and its
bio-logical
effects
were
monitored
in
vitro
and
in
vivo.
We
showed that LMP1 is able
to
negatively modulate
the
malignant potential of gastric carcinoma
cells
possibly
via
a
process
involving the enhancement of apoptosis.
Materials
and
Methods
Cells
and
Animals
Two
gastric
carcinoma
cell lines
(SCM1
and
TMC1)
were
used
for this
study. The SCM1
cell line
was
originally
derived
from
the
gastric
specimen
of
a
patient
with
poorly
differentiated tubular
adenocarcinoma
of
the stomach.
The
TMC1
cell line was derived
from
metastatic tumor
cells in the
lymph
node
of
a
patient
with
poorly
differen-tiated
adenocarcinoma of
the stomach. Both cell lines
were
EBV
negative, and
they
were
cultured
in
RPMI 1640
medium
containing
10%
fetal calf
serum
(FCS)
and
incu-bated
at
370C
in
an
incubator with 5%
CO2
and
water
saturation.
The
EBV-negative NPC cell
line
(HONE-1)32
was
used as a
comparative
study.
Pathogen-free
nude
(BALB/c
nu/nu)
mice
were
used for
tumorigenicity
as-says.
Construction of LMP1
Expression
Vector
The LMP1
gene was
excised from
the
EcoRI
D
fragment
of the B95.8 strain of EBV
by
Mlul
digestion.
This LMP1
gene
is a wild
type
without the
specific
mutations in exon
3
found
in
the NPC strain of EBV.3334 After
being
end-blunted
by
T4 DNA
polymerase,
the
LMP1
gene
was
cloned into the
pMAMneo expression
vector
(Clontech,
Palo
Alto, CA).
The
orientation of
the
LMP1 gene
relative
to
the MMTV
promoter
was
ascertained
by
restriction
mapping.
The
reconstructed plasmid
(pMAM-LMP1)
con-taining the LMP1
gene
and the
control
plasmid
(pMAM-neo)
were
used for cell transfection to establish the
LMP1-expressing cells
and
vector-transfected control
cells, respectively.
DNA
Transfection
DNA
transfection
was
performed
by the
lipofection
method according
to
the
manufacturer's
suggestion
(GIBCO
BRL,
Gaithersburg, MD).
In
brief, adherent cells
(2
x
105
cells)
in a 35-mm
tissue culture dish
were
transfected with
1
ml
of
a
DNA-liposome
complex.
The
DNA-liposome complex was prepared by mixing solution
A
(1
jig
of plasmid
DNA
diluted into
100
gl
of
Opti-MEM
I) and solution B (6 ,l of lipofectamine diluted
into 100
IlI
of
Opti-MEMI). After incubation of the DNA-liposome
complex
at
room temperature
for
15 to 45
minutes,
0.8 ml
of
Opti-MEM
medium
was
added and
mixed gently; then
the diluted
complex solution
was
overlaid
onto
rinsed
cells.
The cells
were
incubated
at
370C
in a
CO2
incuba-tor.
After
8
hours,
1
ml
of
growth medium containing
20%
FCS
was
added
without removing
the
transfection
mix-ture.
The
medium was
replaced with fresh
growth
me-dium 24
hours
after
the start
of
transfection. At
72
hours
after
transfection, cells
were
subcultured
at
a
1:10
dilu-tion
in
growth medium
containing G418
(400
,ug/ml).
G418-resistant
colonies were
selected.
Colonies
contain-ing
more
than
20
cells
were
counted
after
14
days.
Detection of LMP1
Expression by
Immunohistochemical
Stain
Detection
of
LMP1
expression in transfected cells and
their induced
tumors
in
nude mice
were
performed by
in
situ
immunostaining.
The cells were
grown
on
coverslips
to
approximately
70%
confluence,
washed twice with
ice-cold
phosphate-buffered saline
(PBS), and then fixed
in
methanol/acetone
(1/1,
v/v)
at
-200C for
30
minutes.
The
fixed cultured cells
were
rinsed
in
Tris-buffered
sa-line
(TBS;
145
mmol/L NaCI
and 20
mmol/L Tris, pH
7.6),
incubated
with 2%
H202
in
methanol for
10
minutes
to
destroy
endogenous peroxidase activity, blocked with
normal
serum
from
rabbits
(1:5
dilution)
for 5
minutes,
and then
incubated
with
mouse
monoclonal
antibody
S12
35against
LMP1
for
2
hours.
After
three washes with
TBS,
the cells
were
exposed
to
rabbit anti-mouse
IgG
antibody conjugated
with
horseradish
peroxidase
(Santa
Cruz
Biotechnology,
Santa
Cruz, CA)
for
60
minutes and
washed with
TBS,
and the
positive
staining
was
devel-LMP1
Effects in Gastric Carcinomas
65
AJPJanuary 1998, Vol. 152, No. 1oped
in
aminoethylcarbazole chromogen solution
(Dako,
Carpinteria, CA). The cells
were
lightly counterstained
with hematoxylin and
mounted for examination. The
for-malin-fixed and
paraffin-embedded
tissue sections of the
tumor masses
derived from the tumorigenicity assay in
nude mice were dewaxed,
pretreated by wet autoclaving
for
antigen
retrieval,36
rinsed in
TBS,
and stained by the
same procedures as the
culture cells except that the
secondary antibody was
replaced by
rabbit anti-mouse
IgG
antibody conjugated with alkaline phosphatase
(San-ta
Cruz
Biotechnology),
the
positive staining
was
devel-oped
in
naphthol phosphate-new fuchsin solution
(Dako),
and
the
light hematoxylin counterstain
was
omitted.
Western Immunoblotting
Proteins were extracted from
the
transfected
cells, and
tumor masses were derived
from the
tumorigenicity
as-say in nude mice
and the metastatic
NPC
in
neck
lymph
node. After washing with
PBS,
the cells and tumors were
lysed
in
RIPA
buffer
(150
mmol/L
NaCI,
50
mmol/L Tris,
pH
7.5, 5
mmol/L EDTA,
0.5% sodium
deoxycholate,
0.1%
sodium
dodecyl sulfate
(SDS), and
1
mmol/L
phe-nylmethylsulfonyl fluoride), homogenized by sonication,
and
centrifuged
at
15,000
x
g
for
10
minutes
at
40C.
The
extracted
proteins
in
the supernatant were
quantified
by
the
Lowry
assay
and then stored
in
aliquots
at
-70°C
before
use.
For
SDS-polyacrylamide gel electrophoresis,
extracted
protein
mixed with an
equal
volume
of
sample
buffer
(0.02% bromophenol blue,
4%
SDS,
4%
2-mercap-toethanol,
20%
glycerol,
and 50
mmol/L Tris)
was
boiled
for
8
minutes and
separated
on an
8.5%
polyacrylamide
gel. The separated proteins
were
electrotransferred
to
nitrocellulose membrane
(Amersham, Arlington Heights,
IL), probed
with mouse anti-LMP1
protein monoclonal
antibody
S12,
detected with
horseradish-peroxidase-conjugated rabbit
anti-mouse
IgG antibody (Serotech),
and
developed
in
enhanced
chemiluminescence
detec-tion reagents
(Amersham). For
the
LMP1-positive control
and
quantitative analysis, the B95.8 cells
were
included
in this assay. The
detection
of
bcl-2
expression in
LMP1-expressing gastric carcinoma cells and
vector-trans-fected cells
was
performed according
to
previously
de-scribed
methods.37
Growth Rate Assessment
Cells
were
plated
at a
density of
1
x
104
cells/ml
on
24-well
plates
in
RPMI 1640
medium containing
10%
FCS,
and this
growth medium was refreshed every other
day.
Each
day, triplicate
cultures were
trypsinized
indi-vidually, and the number of viable cells from each culture
was
determined
by
the
trypan blue exclusion method.
Colony-Forming Assay
The
vector-transfected
and
LMP1-expressing gastric
car-cinoma cells were
trypsinized,
and
viable cells
were
counted.
On
a
100-mm
culture
dish,
1000 cells were
seeded in RPMI 1640 medium
containing
10%
FCS,
and
this
growth
medium
was
refreshed
every 3
days.
After
2
weeks, the
culture cells were washed with
PBS, fixed
in a
10%
buffered
formalin,
and stained with a 1% solution
of
crystal violet to
determine
the
colony
number. This assay
was carried out in triplicate in three independent
exper-iments. For
the measurement of colony-forming
effi-ciency, the number
of colonies
per
dish, counted
under
low
magnification (x5),
was
divided
by the number of
viable cells
seeded and expressed as a percentage.
The
mean
colony
size
was
measured by counting
the
number
of cells
per
colony
at
x200
magnification in 60 randomly
selected colonies.
Tumorigenicity
Assay in Nude Mice
LMP1-expressing gastric
carcinoma cells
and
vector-transfected
cells
(2
x
106)
were
simultaneously
trans-planted
subcutaneously
at
different locations
on
the back
of each nude
mouse.
After
transplantation,
tumor
devel-opment was
monitored
daily. After
30
days, the
tumor
masses were
dissected,
weighed,
and cut into
three
pieces.
One piece
was
fixed
in
neutralized
10%
formalin
for
histopathological examination, and
the
others
were
frozen
in
liquid
nitrogen and preserved
at
-70°C for other
relevant studies.
Morphological
Study
The
morphological characteristics
of cultured
LMP1-ex-pressing
cells and vector-transfected cells
were
exam-ined in a
subconfluent
condition. The cellular
morphology
of each
tumor mass
derived
from the
tumorigenicity
as-say in
nude
mice was
evaluated
on
serial tissue sections
using hematoxylin and eosin
(H&E)
staining.
Detection of
Apoptotic
DNA
Fragmentation
The
DNA
fragmentation
assay was
performed
as
previ-ously described.38
In
brief,
the
LMP1-expressing gastric
carcinoma cells and
vector-transfected
cells were
cul-tured
to
approximately
70%
confluence
in
RPMI 1640
medium
containing
10%
FCS. The floating cells
were
collected
by
aspiration
of
the
medium,
and
the
adherent
cells were
collected
by trypsinization.
These
cells
were
washed twice
in
PBS containing
1
mmol/L
EDTA
and
0.1
mg/ml proteinase K, pelleted and
lysed
in 1
mmol/L
EDTA
containing
0.6%
SDS.
Sodium chloride
was
added
to 1
mol/L, and the solution
was
mixed by
gentle inversion
and
incubated
at
40C
overnight.
After
centrifugation
at
15,000
x
g for 60 minutes at
4°C,
low molecular weight
DNA was ethanol
precipitated from the supernatant. DNA
fragmentation
was
analyzed by subjecting
30
,ug
of
DNA
to
electrophoresis
on
a 1.5%
agarose
gel
using
Tris-acetate/EDTA
buffer, staining
with ethidium
bromide,
and
photography
under
ultraviolet illumination.
Antisense
Treatment
To
specify
the
biological effects of
LMP1,
the
cells
were
treated
with
LMP1 antisense
oligonucleotide for growth
66
Sheu
etal
AJPJanuary 1998, Vol. 152, No. 1
Table 1. Comparison of the LMP1 Transfection in Gastric and Nasopharyngeal Carcinoma Cells
SCMi
TMC1
HONE1
Number of
Size of
Number of
Size of
Number of
Size
of
colonies
colonies
colonies
colonies
colonies
colonies
pMAMneo
Experiment
163
176
51
132
70
187
Experiment
2 71 18253
124
75
199
Mean
67179
52128
73
193
pMAM-LMP1
Experiment
158
150
40
98
102
242
Experiment
250
14235
107
90
213
Mean
54146
38
103
96
228
The number of colonies and the size of colonies are expressed as the mean oftriplicate data of each experiment.
rate
assessment and
the
colony-forming assay.
LMP1
antisense
oligonucleotide (5' AG GTC GTG TTC CAT
CCT
CAG
GGC
3'), complementary
to a
23-bp
sequence
overlapping the
start
codon
of the
LMP1
mRMA,
was
synthesized using
an
Applied
Biosystem's 380B
DNA
synthesizer
(Applied Biosystems, Foster
City,
CA) with
a
phosphorothioate substitution
on
each
base.
Purity
was
assayed by
polyacrylamide gel electrophoresis after
two
cycles of ethanol precipitation. Sterile
aliquots of
1
mmol/L stock solution
were
stored at
-20°C and thawed
on
ice
immediately
before
use
in
each
experiment. The
LMP1-expressing
gastric
carcinoma
cells and
vector-transfected cells
were
cultured
in
growth medium
con-taining
3
,umol/L LMP1 antisense oligonucleotides. The
following
procedures
were
the
same
as
previously
de-scribed
for
growth
rate
assessment
and the
colony-form-ing assay.
Treatment of the control
oligonucleotide,
which
consisted of the
same
nucleotides
in
randomized
se-quence
(5' CT AGC AGT GCG AGG CGT TCT CTC 3'),
was
performed
in
the
control
study.
Results
Comparison
of LMP1
Transfection
Effects
in
Gastric Carcinoma
and
NPC Cells
Transfections,
under
the same
conditions,
were
per-formed
in
gastric carcinoma
cells
(SCM1
and
TMC1)
and
NPC cells
(HONE-1)
to
evaluate
the
differences of
LMP1
transfection effects in
gastric carcinoma and
NPC
cells.
Fourteen
days
after
transfection,
the
G418-resistant
col-onies
containing
more
than 20 cells
were
counted. The
mean
colony size
was
measured
by
counting
the number
of cells
per
colony
at
x200
magnification
in 60
randomly
selected
colonies. This
assay
was
carried
out
in
triplicate
in two
independent experiments.
These results are
sum-marized in
Table
1.
Using
this
approach
in
gastric
carci-noma
cells
(SCM1
and
TMC1),
we
found
consistently that
pMAM-LMP1 transfection of cells
that
express
LMP1
re-sulted in the
recovery
of
fewer
drug-resistant
cell colonies
and a smaller
mean
colony
size
than
when
the control
plasmid
(pMAMneo)
was
introduced
alone.
However,
the
NPC
cells
(HONE-1)
transfected
with
pMAM-LMP1
re-sulted
in
the
recovery of
more
drug-resistant
cell
colonies
and
a
larger
mean
colony
size than when the
pMAMneo
was
introduced
alone.
To determine
the
expression level
of
LMP1 in
transfected
gastric carcinoma
and
NPC
cells,
Western
analysis
was
performed
on
the
pooled
drug-resistant cells.
B95.8 cells and
a
specimen of
metastatic
NPC
with EBV association in neck
lymph node (the
re-sidual
lymphoid
tissue was removed under a
dissecting
microscope)
were
also
included
as
controls. As shown
in
Figure 1,
the LMP1
expression levels of
LMP1-trans-fected
gastric carcinoma and NPC cells
are
nearly
equal,
but
they
are
obviously
less than in
metastatic NPC
cells
and
B95.8 cells.
According
to
these
results,
the
conse-quence
of
the LMP1
expression
in
NPC cells is a
growth
enhancement,
but it is a
growth
suppression in
gastric
carcinoma
cells.
Establishment of LMP1
-Expressing
Gastric
Carcinoma Cells
To
further
characterize the biological
effects of
LMP1
in
gastric carcinoma cells,
two
monoclonal
drug-resistant
cell
lines (SCM-L14
and
-L22) with
persistent LMP1
ex-pression
were
randomly selected from
pMAM-LMP1-H
Pd P
U
>
I
XODA
I
V
s:X
V
U
~z;
z;
z
vzI
utI
Ez
:t
m
:
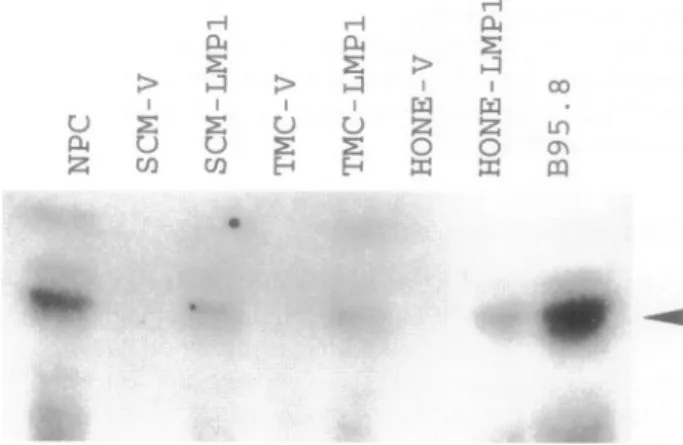
Figure 1.WesternblotassayforLMP1expressioninpMAM-LMP1-transfected gastriccarcinomaand NPCcells.Equalamountsofextracted protein (800
,tg)wereloadedineach lane except that50 .gofextracted protein of B95.8 cells and 150 ,ug of extracted protein ofmetastatic NPC wereloaded for quantitativeanalysis. NPC,metastaticNPC;SCM-V,vector-transfected SCM1 cells;SCM-LMP1,pMAM-LMP1-transfectedSCM1cells;TMC-V,
vector-trans-fected TMC1 cells; TMC-LMP1, pMAM-LMP1-transfected TMC1 cells; HONE-V, vector-transfected HONE-1cells;HONE-LMP1, pMAM-LMP1-trans-fectedHONE-1 cells. Thearrowindicates the positiveband of LMP1,
LMP1 Effects in Gastric Carcinomas
67
AJPJanuary1998, Vol. 152, No. 1
.S;
;.¢^:.:.jq,...,.:..
Afeitse
X$E''''X'.
.. .:....
*.:w;...:
...C;:,...
.
:r;,>..-.ir=w.N.gR.i-.,S1@U;<^,^---,.:iSg6;.;.:.w
,:t.:.;-t-:X}.:f.,.s...-....
'. -'
g REg@MiX i:n -zg2 R ^xxa
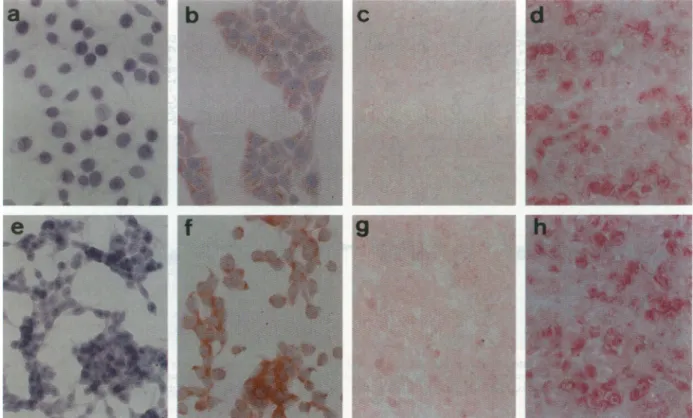
Figure 2.ImmunostainingforLMP1 expression inLMP1-expressinggastric carcinomacells. a:Vector-transfected SCM1cells. b:LMP1-expressingSCM1cells (SCM-L22). c: Induced tumor derivedfromvector-transfectedSCM1 cells.d:Induced tumor derived fromLMP1-expressingSCM1cells(SCM-L22).e:
Vector-transfected TMC1 cells.f:LMPl-expressing TMC1cells(TMC-L1). g:Induced tumor derived fromvector-transfectedTMC1cells. h: Inducedtumorderived from
LMP1-expressingTMC1cells(TMC-L1). Anti-LMP1; magnification, X200.
transfected
SCM1
cells and
two
(TMC-L1 and -L4) from
pMAM-LMP1-transfected TMC1 cells. LMP1 expression
in
these selected
LMP1-expressing gastric carcinoma
cell lines and in the
tumors
induced
in
nude mice
wasdemonstrated
by in situ immunostaining and Western blot
analysis. In culture, LMP1 expression
wasrestricted
to
the
cytoplasm.
In
the
tumors
induced
in
nude
mice,
LMP1
expression
wasdemonstrated
in
the
nuclei and
cyto-plasm (Figure 2). These selected LMP1-expressing
gas-tric
carcinoma cell lines all
expressed LMP1
at
approxi-mately 65 kd
asdemonstrated by Western blot analysis
(Figure 3). LMP1 expression
wasundetectable in
vector-transfected
SCM1
and TMC1 cells.
Thus, these selected
LMP1-expressing gastric carcinoma cell lines
werecon-firmed
to
constantly
expressLMP1 in
vitro and in vivo. In
addition, the LMP1 expression levels
in
these selected
LMPl-expressing gastric carcinoma cell lines
werelower
than in B95.8 cells.
Reduced Growth Rate
of LMP1-Expressing
Gastric Carcinoma
Cells
in Vitro
The
growth
rates
of
LMP1-expressing gastric carcinoma
cells and
vector-transfected cells
wereevaluated
by daily
counting of viable cells. As shown in Figures
4
and
5, the
LMPl-expressing
SCM1 (SCM-L14 and -22) and TMC1
(TMC-Ll and -L4) cells showed
anobviously slower
growth
rate
than
that of vector-transfected
SCM1
and
TMC1 cells. These
findings
suggest
that the
LMPl-ex-pressing gastric
carcinoma
cells have
a
reduced
growth
rate in
vitro.
Reduced
Colony-Forming Efficiency and
Colony
Size
of LMP1
-Expressing
Gastric
Carcinoma
Cells
in
Vitro
The results
of
the
colony-forming
assay are
summarized
in
Table
2.
The
colony-forming efficiency of
LMP1-ex-pressing
SCM1 cells
was
less
than that
of
vector-trans-fected
SCM1 cells. The
mean
colony
size
of
LMP1-ex-pressing
SCM1 cells
was
smaller than that of
vector-transfected
SCM1
cells.
These results indicate that
LMP1-expressing gastric carcinoma
cells
had
a
reduced
colony-forming efficiency and
mean
colony size
in
vitro.
Because
some
of
the
LMP1-expressing
and
vector-trans-fected
TMC1
cells grew in
suspension, the
colony-form-ing
assay could not be
tested
in
LMP1-expressing
TMC1
cells.
Reduced Tumorigenicity and Growth Rate of
LMP1-Expressing Gastric Carcinoma Cells
in
Vivo
A
subcutaneous
tumorigenicity
assay in nude mice
was
performed
to test
the
difference in
tumorigenicity of
LMP1-expressing
gastric
carcinoma cells and
vector-A
68
Sheu et al
AJPJanuary 1998, Vol. 152, No. 1
a
_ _ cn- cn*
04
ri
v-I%
(
P2
rI-
N - -a
Z
I I I I I I I I @e.
a
6
'd
d'
d'
eO
e
CO uz x m Co rq tn ux ux Ab
+pqri i-
'4'
'4'
>
IA
I A >a
co I I I I I I Iu
u
r.
XtoS
S «
Figure 3. LMP1 expression in selectedLMP1-expressingSCM1 celllines (a) and TMC1 cell lines (b). Equal amountsofextractedprotein(250,ug)wereloaded ineach laneexcept that only 50 ,ug of extracted proteinof B95.8 cells was loaded for quantitativeanalysis. nm, inducedtumor mass innudemouse;AS,with
antisensetreatment;SCM-V,vector-transfected SCM1 cells; TMC-V,vector-transfected TMC1 cells. The arrow indicates the positive band of LMP1,approximately 65kd.
transfected cells. As shown
in
Table
3,
the
tumorigenesis
frequency of
SCM-L14
was 71%
and
of
SCM-L22
cells
was
62%,
which
was
significantly lower than that
of
vec-tor-transfected
SCM1 cells
(100%;
P
<
0.05).
The
growth
rates
of
SCM-L14 and -L22 cells, assessed by the weight
of the induced
tumor
masses, were
significantly slower
than that of
vector-transfected
SCM1 cells
(P
<
0.05).
Similar results
were
obtained from
LMP1-expressing
TMC1 cells (Table
4). The tumorigenesis
frequency of
TMC-L1 cells
was
13% and
of
TMC-L4 cells
was
0%,
which
was
significantly lower than that of
vector-trans-fected
TMC1 cells
(100%;
P
<
0.05).
The
growth
rate
of
LMP1-expressing TMC1 cells
was
also
significantly
slower than that
of
vector
control
TMC1 cells
in
the
animal
a
2 4 6 8 10 12 14C
2 2 4 6 a 10 12 14 150 100 50 o0 0b
I 2 4 6 8 10 12 l 50 50 0 x 1-'4-0 0 z 200 150 100 2 50-0 2 4 6 a 10 12 14 40 30 20 10 0 60 40 31 2C I14a
I 2 4 6 8 10 12 50 40 30 20 10 o0 4 C 2 4 6 6 10 12 14 50 40 30 20 10 -b 2 4 6 a lo 12 1 4d
0 2 4 6 8 10 12 14 Time(days)Figure4.Growthcurves ofLMP1-expressing SCM1 cells and
vector-trans-fectedcells withorwithout LMP1 antisensetreatment. a:Growthcurvesof SCM-L14 (A), SCM-L22 (ED, and vector-transfected cells (0). b: Growth
curvesofvector-transfected cells(0)and with LMP1 antisensetreatment(0).
C:Growthcurvesof SCM-L14 cells(A)and with LMP1 antisensetreatment (A). d: Growth curves of SCM-L22 cells (0) and with LMP1 antisense
treatment(-).
Time(days)
Figure5. GrowthcurvesofLMPl-expressingTMC1cells and
vector-trans-fected cells withorwithoutLMP1antisense treatment. a: Growthcurvesof
TMC-Ll(AL),TMC-L4(E),and vector-transfectedcells(0).b: Growthcurves
of vector-transfected cells(0)and withLMP1antisense treatment(0). C:
Growthcurvesof TMC-Ll cells(A)and with LMP1 antisense treatment(A). d: Growthcurvesof TMC-L4 cells(E)and withLMP1antisense treatment (A). 150 100 0 x 4-0 z 50 200 150 100 50 o0 200 an so 0 An -L.
LMP1 Effects
inGastric Carcinomas
69AJPJanuary
1998, Vol. 152, No. 1Table
2. Colony-Formring Efficiency (CFE) ofLMP1-Expressing SCM1 Cells
Mean colony
size
CFE (%)
(cells/colony)
Cell lines
AS (-)
AS
(+)AS (-)
AS
(+)
SCM-V 34
32
235
224
SCM-L14
12
21
163
194
SCM-L22
8
17
138
186
CFE, colony-fqrming efficiency; AS (-), without LMP1 antisense treatment; AS (+), with LMP1 antisense treatment. CFE = (colonies formed/cells inoculated) x 100.
test
(P
<
0.05). These findings
suggest that
LMP1-ex-pressing gastric carcinoma cells
have a
reduced
tumor-igenicity and growth
rate in vivo.
Morphological Alterations of LMP1 -Expressing
Gastri6
Carcinoma Cells
Morphological alterations of the
LMP1-expressing gastric
carcinoma cells
were
examined
in
vitro
and
in
vivo. In
subconfluent culture conditions, the
vector-transfected
SCM1
cells
predominantly displayed
more
spindle
shapes and
grew
in
a
less
organized
pattern
(Figure
6a).
However, the
LMP1-expressing SCM1
cells
showed
po-lygonal
or
ovoid shapes
and grew
in
a
cohesive
and well
organized
pattern
(Figure 6b). The vector-transfected
SCM1 cell
tumors
induced in nude mice showed
a
higher
malignant cytological grade, characterized by increased
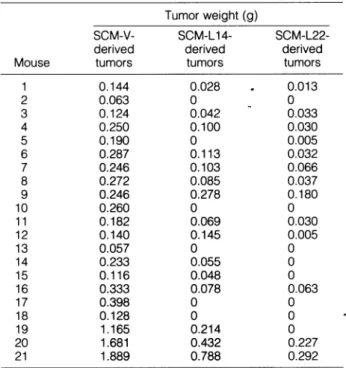
Table 3.
Tumorigenesisof
LMP1-Expressing SCM1 Cells(SCM-L14
and-L22)
andVector-Transfected
Cells(SCM-V)
Tumor weight
(g)
SCM-V-
SCM-Li
4-SCM-L22-derived
derived
derived
Mouse
tumors
tumors
tumors
1 0.144
0.028
.
0.013
20.063
0
0
3
0.1240.042
0.033
40.250
0.100
0.030
50.190
0
0.005
6
0.287
0.113
0.032
70.246
0.103
0.066
8
0.2720.085
0.037
9
0.246
0.278
0.180
10
0.260
0
0 110.182
0.069
0.030
120.140
0.145
0.005
13
0.057
0
0
140.233
0.055
0
15
0.116
0.048
0
16
0.333
0.078
0.063
170.398
0
0
18
0.128
0
0
19
1.165
0.214
0
20
1.681
0.432
0.227 211.889
0.788
0.292
Tumorigenesis was 100% for
SCM-V-derived
tumors, 71% forSCM-L14-derived tumors, and 62% for
SCM-L22-derived
tumors. Differenceswere considered significant at P < 0.05 by Fisher's exact test for
tumorigenicity and Mann-Whitney U test for growth rate (assessed by
weight).
Table
4. Tumorigenesis of LMPl-Expressing TMC1 Cells(TMC-Ll and
-L4)
andVector-Transfected Cells
(TMC-V)
Tumor weight
(g)
TMC-V-
TMC-L1-
TMC-L4-derived
derived
derived
Mouse
tumors
tumors
tumors
1
0.804
0
0
2
0.653
0
0
3
0.596
0
0
4
0.761
0
0
5
0.556
0
0
6
0.314
0
0
7
0.643
0.190
0
8
0.285
0.025
0
9
0.507
0
0
10
0.869
0
0
110.690
0
0
12
0.707
0
0
13
0.655
0
0
14
0.341
0
0
15
0.716
0
0
Tumorigenesis was 100% forTMC-V-derivedtumors, 13%for
TMC-Li-derived
tumors, and 0% for TMC-L4-derived tumors. Differences were considered significant at P < 0.05 by Fisher's exact test fortumorigenicityand Mann-Whitney U test for growth rate (assessed by weight).
cellular
polymorphism, conspicuous
eosinophilic
nucle-oli,
frequent mitosis, and relatively
scanty
cytoplasm
(Fig-ure
6c).
In contrast,
the
LMP1-expressing
SCMI1
cells
displayed
a
lower
malignant
cytological
grade,
charac-terized
by
monotonous tumor
cells with
polygonal
or
ovoid
nuclei,
inconspicuous
nucleoli,
occasional
mitosis,
and moderate
cytoplasm
(Figure 6d).
No
identifiable
dif-ferences between the mucin
production
of
vector-trans-fected
or
LMP1-expressing
SCM1 cells
were
found
by
serial tissue section
examination.
Similarly,
a
lower
grade
of
malignant
cytological
features
was
found
in
LMP1-expressing
TMC1 cells. The cultured vector-transfected
TMC1
cells had
a
tendency
to
grow
clumped together,
and
some
of them
formed clusters
(Figure
6e).
In
con-trast,
the
LMP1-expressing
TMC1 cells
mostly
grew
in
a
homogeneous monolayer attached
pattern
(Figure
6f).
The
vector-transfected
TMC1
cell
tumors
induced
in
nude mice showed
a
higher malignant
cytological
grade,
characterized
by cellular
polymorphism
with
giant
cell
formation, prominent eosinophilic nucleoli,
frequent
mito-sis, and
scanty
cytoplasm
(Figure
6g).
However, the
LMP1-expressing TMC1
cell
tumors
displayed
a
lower
malignant
cytological
grade, characterized by
monoto-nous
tumor
cells with
polygonal
or
ovoid
nuclei,
incon-spicuous
nucleoli,
occasional
mitosis,
and
increased
pro-duction of mucin
accumulated
in
the
intercellular
spaces
(Figure
6h).
Similar
morphological alterations
were
also
observed in the
pooled
LMP1-expressing SCMI1
and
TMC1
cells
(data
not
shown).
These
results
suggest
that
the
LMP1
-expressing
gastric
carcinoma cells
displayed
a
lower
malignant
cytological
grade
than that
of
70
Sheu
etal
AJPJanuary 1998, Vol. 152, [Vo.1
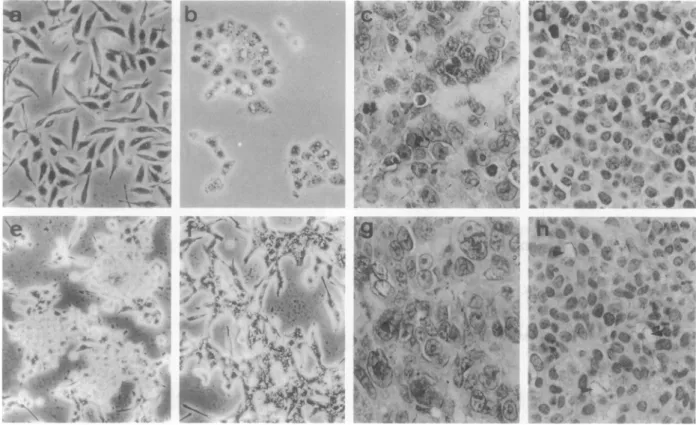
Figure 6. Morphologicalalterations ofLMP1-expressinggastric carcinomacells.a:Vector-transfectedSCM1cells.b:LMP1-expressingSCM1cells(SCM-L22).C:
Tumorinducedbyvector-transfected SCM1 cells.d:TumorinducedbyLMP1-expressingSCM1 cells (SCM-L22). e:Vector-transfectedTMC1 cells.f:
LMP1-expressing TMC1cells(TMC-L1).g: Tumor inducedbyvector-transfected TMC1 cells. h: Tumor induced byLMP1-expressingTMC1cells (TMC-L1).Thearrows
indicatemucinaccumulatedintheintercellularspace. H&E stain(C,d, g,andh); magnification,X 200(a,b, d,e,f,andh)and X300(Candg).
Enhanced
Apoptosis of LMP1
-Expressing
Gastric Carcinoma Cells
Under routine
conditions,
more
floating
cells
appeared
in
the culture
of
LMPl-expressing
gastric carcinoma cells
than
in
the culture
of vector-transfected
cells.
To
charac-terize
this
phenomenon,
the low molecular
weight
DNA
isolated
from
the
total cell
population, including attaching
and
floating
cells, of the
LMPl-expressing
gastric
carci-noma
cells and
vector-transfected
cells were
analyzed
by
agarose
gel
electrophoresis.
DNA
fragmentation
in
the
ladder pattern was noted in
LMP1-expressing
SCM1
cells
(SCM-L14
and
-L22)
and
TMC1 cells
(TMC-Ll
and
-L4),
but it was not
clearly identified
in
vector-transfected cells
(Figure 7).
In serum
starvation
conditions, DNA
fragmen-tation
in
the
ladder
pattern
was
also
found
in
vector-transfected
SCM1
and
TMC1
cells
(data
not
shown).
These results suggest that
apoptosis
was
enhanced in
LMP1-expressing
gastric
carcinoma cells.
Lack of
Induced
bc1-2
Expression
in
LMP1-Expressing Gastric Carcinoma Cells
The
expression
of
bcl-2
in
LMPl-expressing
gastric
car-cinoma cells and
vector-transfected
cells
was
assayed
by
Western blot. No
LMPl-inducible
bcl-2
expression
in
LMPl-expressing
gastric
cells or
constitutive
bcl-2
ex-pression
in
vector-transfected
cells
was
detectable. The
expression of bcl-2
was
detected
only
in
MCF-7
cells
as
a
positive
control
(data
not
shown).
These results
suggest
that LMP1
cannot
induce
bcl-2 expression
in
gastric
car-cinoma
cells,
which are
compatible
with
the similar
find-ings
in
primary
B
cells, rodent
fibroblasts, and
immortal-ized
squamous
epithelial
cells.30,39
Specificity
of the
Biological
Effects of LMPl
by
LMP1 Antisense Treatment
After antisense
treatment
for
3
days,
the LMP1
expres-sion level
of
LMP1-expressing SCM1
cells
(SCM-L14
and
Figure7.DNAfragmentationofLMP1-expressinggastric carcinomacells.Lane
1 vector-transfectedSCM1cells; lane2,SCM-L14cells; lane 3,SCM-L22cells; lane4,vector-transfected TMCcells; lane 5, TMC-L1 cells;lane6,TMC-L4cells.
The molecularmarker, pCEP4 plasmid (Invitrogen)wasdigested byHinfI.
LMP1
Effects in
Gastric Carcinomas
71
AJPJanuary1998, Vol. 152,No. 1-L22)
and
TMC1 cells (TMC-L1
and
-L4)
was
assayed by
Western blotting, which showed obvious inhibition of
LMP1
expression (Figure 3). After antisense treatment,
the
vector-transfected
SCM1
and TMC1 cells showed no
significant changes
in
growth rate,
but
the
LMP1-ex-pressing
SCM1
and TMC1
cells showed an obviously
increased
growth rate when compared with the relative
LMP1-expressing
gastric carcinoma cells without
anti-sense treatment
(Figures
4
and
5). In the colony-forming
assay
with
antisense
treatment,
the
vector-transfected
SCM1 cells showed
a
slightly
reduced
colony-forming
efficiency and
mean
colony
size, but the
LMP1
-express-ing
SCM1
cells
(SCM-L14
and
-L22)
showed an
in-creased
colony-forming efficiency and
mean
colony size
(Table 2).
The
cellular morphology
and
colony
shape of
LMP1-expressing
and vector-transfected
SCM1 cells
showed
no obvious
change after antisense
treatment.
The growth rate,
colony-forming efficiency,
and mean
colony
size
of
LMP1-expressing gastric carcinoma cells
was
partially
reversed by LMP1
antisense
treatment. For
treatment
with
the control
oligonucleotide, there
were no
significant
findings
except a
negligible toxic
effect
(data
not
shown).
Therefore, it is
conceivable that the
reduction
of
growth
rate,
colony-forming efficiency,
mean
colony
size,
and
tumorigenicity and the
morphological
alter-ations of
LMP1-expressing gastric cells
resulted
from
the
biological effects of
LMP1.
Discussion
In
this
study,
we
explored
the
biological
effects of the
LMP1 gene
(from the B95.8 strain of EBV without the
specific 30-bp deletion
in exon 3
found
in
the
NPC strain
of
EBV33,34)
in
gastric carcinoma
by
transfecting it
in
EBV-negative gastric carcinoma cells. The comparison of
LMP1
transfection effects between gastric carcinoma
and
NPC cells
were
performed,
and these results
sug-gest that
the
consequence
of
LMP1
expression
in
NPC
cells is
a
growth
enhancement,
but it
is
a
growth
sup-pression
in
gastric
carcinoma
cells. Multiple
monoclonal
LMP1-expressing
gastric
carcinoma cell lines
were
ran-domly
selected
for the additional characterization of
the
biological effects of
LMP1 in
gastric carcinoma cells. The
LMP1-expressing
gastric carcinoma cells had a reduced
growth
rate,
colony-forming efficiency,
mean
colony size,
and
tumorigenicity and
a
lower
malignant cytological
grade when compared with
vector-transfected
cells.
When
LMP1
expression
was
blocked with
LMP1
anti-sense
in
vitro, the reduced growth
rate,
colony-forming
efficiency,
and mean
colony size of
LMP1-expressing
gastric
carcinoma cells was
partially
reversed. In
addi-tion,
there was no
LMP1-inducible bcl-2
expression to
protect the
gastric carcinoma cells
from
apoptosis
in-duced
by
LMP1.
Our
findings
showed that LMP1 can
negatively
modulate the
malignant potential of
gastric
carcinoma cells
possibly
via the
enhancement of
apopto-sis. LMP1 is a
unique viral oncoprotein
on
account
of
its
oncogenic potential
in
rodent
fibroblast, B-lymphocytes,
and
epithelial
cells,40
but it
also exhibits
cytotoxicity
in a
variety of
cell
lines29
and induces apoptosis in squamous
epithelial cells
when
expressed
at
high levels.30
Collec-tively, these findings
suggest
that
LMP1
has paradoxical
biological effects:
an
oncogenic potential
associated
with
cytotoxicity. However,
our
findings
also suggest
that
gas-tric
carcinoma cells
are more
sensitive
to
the
toxic
effects
of LMP1 than NPC cells.
Oncogenes associated
with
toxicity
have also
been
demonstrated
in
v-abl,41
v-src,42
v-re/,43 and c-myc.44
For
example,
c-myc
is essential for cell
proliferation, but
it
also
can
induce cellular apoptosis. The activation of
ap-optosis
by
c-myc
is
dependent
on
regions that
are
also
essential for
transformation.44
Similarly,
mutant
analysis
has
shown that the
same
domains of
LMP1 are
respon-sible
for both the
transforming
function and the toxic
effects.29
The
co-expression
of
c-myc
and bcl-2 is
com-monly
present in human
follicular
lymphoma.45
In
addi-tion, the
apoptotic
effects of
c-myc can
be blocked
by
the
ectopic expression of bcl-2.46 Similarly, the coexistence
of activation of
oncogenes
and inactivation of the
p53
gene
has been
commonly observed
in
human
can-cers.47-49
It was
proposed
that
development
of
tumors
would involve the
deregulation of cellular proliferation
and
suppression of
apoptosis.46 In EBV-infected
normal
B
cells, the EBV
gene
products
that
initiate and maintain
B
cell growth and immortalization
in
vitro
include six
nu-clear
antigens, EBNAs 1, 2, 3a,
3b, 3c,
and
LP,
and two
latent membrane
proteins, LMPs
1
and 2.50
The
associ-ated
overexpression of bcl-2 also
was
found.51 The in vitro
studies have
suggested
that
LMP1 is
essential for
pri-mary B cell
transformation,24
which can
induce
bcl-2
expression
to
protect B
cells from
apoptosis20
and
coop-erate
with
EBNA2 for the induction
of
B
cell activation.52
On
the
other
hand, there
were no
similar
effects
demon-strated
in
the
EBV-infected normal
T
cells.
In
EBV-in-fected normal
human
thymocytes (CD21
'),
the EBV
ge-nome
is
in
linear
form, and its
gene
expression includes
EBNA1
from the
Fp promoter, EBNA2,
ZEBRA, RAZ,
and
gp350/220
but
no
LMPs
or
EBERs, which has
some
of the
same
specific
characteristics
of
lytic replication.53
How-ever,
outgrowth of immortalized T-cell clones from
EBV-infected thymocytes have
not
been
observed, which
sug-gests
that,
in contrast
with B
cells,
EBV
may
be
incapable
of
immortalizing T cells
in
vitro due
to
the lack
of
suppres-sion of
apoptosis.54
The EBV-encoded
LMP1 gene can
induce the
expres-sion
of
ICAM1,
LFA1 and
LFA3,19'25
which are the
essen-tial mediators for
conjugate formation between
T
lympho-cyte
and
target
cells.55
In
addition,
cytotoxic
T
lymphocyte
epitopes have also been identified
in the
LMP1
gene.56
Collectively,
it
was
predicted that the
ex-pression of LMP1 may itself be influenced
by biological
effects
in
host cells and the
patient's
immunosurveillance
function.
In
EBV-associated
neoplasms,
LMP1
expres-sion is
frequently
observed in
NPC,57
Hodgkin's
diseas-4,58 23 -eae ypo