INTERNATIONAL REAL ESTATE REVIEW
2008 Vol. 11 No. 1: pp 38 - 64
Is It a Heavy Log that Broke the Camel’s Back?
Evidence of the Credit Channel in Taiwan’s
Construction Industry
Chien-An Wang∗
Associate Professor, Department of Banking and Finance, National Chi-Nan University, 1 University Rd., Puli, Nantou 545,Taiwan, ROC, Tel: 886-49-2910960 Ext. 3129, Fax: 886-49-2914511, cawang@ncnu.edu.tw
Chin-Oh Chang
Professor, Department of Land Economics, National Cheng-Chi University, Taipei, Taiwan, ROC, Tel: +886-2-9393091 Ext.51650, jachang@nccu.edu.tw
Since the 1997 Asian financial crisis, the monetary authority of Taiwan decreased the interest rate nine times and had every intention to maintain a loose monetary policy. However, the lending amounts to the construction industry decreased much more sharply in spite of an increased monetary supply. Hence, the loose monetary policy has not reduced the financial constraints of the construction firms in Taiwan. In this paper, we investigate how the credit channel of monetary policy works in the Taiwan construction industry. We explain the reasons for financial constraints in the construction industry in Taiwan. Construction firms, whose information is considerably opaque, are likely to be viewed as “lemons,” which accounts for the credit crunch policy of banking lending to these construction firms. Two strands of evidence support this view. First, the borrowing terms for the construction industry have been more restrictive than those for other industrial firms during the same period of financial difficulty. Second, we determine that such
∗
financial constraints vary systematically within different industry groups. The results substantiate that construction firms retain more internal funds for future investment, and the sign of the liquidity coefficient is significant in their investment function. The evidence shows construction firms bear most of the reductions in bank loan supply, and that they are more bank-dependent.
Keywords
Credit Channel; Construction Industry; Constrained Investment; Borrowing Terms; Bank-dependent
1. Introduction
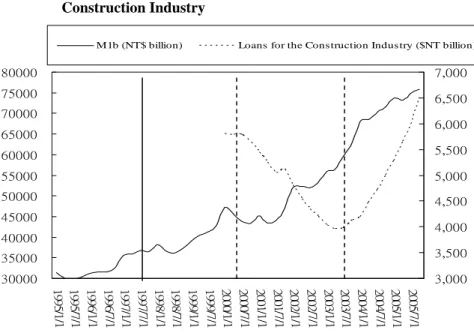
The term “heavy log” in the title of this paper is used to describe the credit crunch policy of banking lending,1 while the term “camel’s back” describes the investment policy of construction firms in Taiwan. To be more precise, “Is it a heavy log that broke the camel’s back” refers to the following situation: After the 1997 Asian financial crisis, the monetary authority of Taiwan decreased the interest rate nine times and had every intention of maintaining a loose monetary policy. To illustrate, the relationship between the monetary supply (which is proxied by M1b) and the interest rate (which is proxied by the weighted average loan rate of the five largest banks) is presented in Figure 1; in light of the monetary theory, it is very reasonable for this to be a negative relationship. Furthermore, the monetary authority of Taiwan decreased the interest rate nine times since 1997 Asian financial crisis (which is shown as the vertical black in Figure 1) with an interest rate decrease from 8.662% in February, 1998 to 6.228% in April, 2001. The above explains that the monetary authority made every effort to maintain a loose monetary policy. However, it is particularly important to note that the lending amounts to the construction industry decreased much more sharply in spite of an increased monetary supply, as indicated in Figure 2.2 Hence, the loose monetary policy has not reduced the financial constraints of the construction firms in Taiwan. This paper explores this highly interesting phenomenon referred to as the “credit crunch”, with regard to construction firms in Taiwan.
1
According to the definition proposed by Bernanke and Gertler (1995), “credit crunch” is a situation in which the supply of credit is restricted below the range usually identified with prevailing market interest rates and the profitability of investment projects. See Bernanke and Mihov (1998) for a survey of the literature.
2
The interval zone of the red line in Figure 2 presents this reverse trend. The growing annual amounts of new loans to the housing construction industry from 1998 to 2000 were 85, -30 and -51 (in billion NT dollars), respectively. In stark contrast, the growing amounts to the non-housing construction industry were 195, 289 and 244 (unit: billion NT dollars), respectively. These reference statistics can be checked in the Financial Statistics Monthly (published by the Economic Research Department of the Central Bank of ROC).
Figure 1 Relationship between Monetary Supply and Interest Rates
25000
30000
35000
40000
45000
50000
55000
60000
65000
70000
75000
80000
1995/
1
/1
1995/
7
/1
1996/
1
/1
1996/
7
/1
1997/
1
/1
1997/
7
/1
1998/
1
/1
1998/
7
/1
1999/
1
/1
1999/
7
/1
2000/
1
/1
2000/
7
/1
2001/
1
/1
2001/
7
/1
2002/
1
/1
2002/
7
/1
2003/
1
/1
2003/
7
/1
2004/
1
/1
2004/
7
/1
2005/
1
/1
2005/
7
/1
Year3.0
3.5
4.0
4.5
5.0
5.5
6.0
6.5
7.0
7.5
8.0
8.5
9.0
9.5
M1b ($NT billion) Loan Rate (%)
Data source: This figure shows the monetary supply (which is proxied by M1b and is shown as the bold
black line on the left-hand side) and the interest rate (which is proxied by the weighted average loan rate of the five largest five banks and is shown as the bold, black dashed line on the right- hand side). For details, readers should refer to the Financial Statistics Monthly published by the Economic Research Department of the Central Bank of ROC. The vertical black line indicates the time-point of the Asian financial crisis.
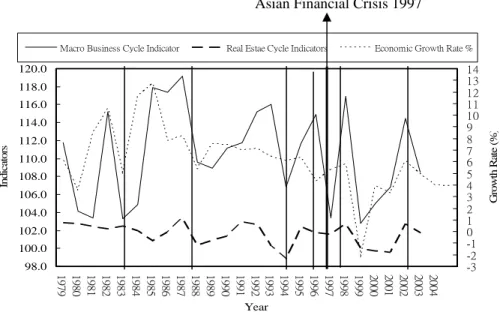
Certain special characteristics unique to construction firms in Taiwan provide interesting points of contrast when studied against non-construction firms. First, there are two significant investment markets in Taiwan; one is the housing markets, and another is the capital stock market. Real Estate has long been an expensive, yet durable consumption good, but it is also an excellent vehicle for investment. In fact, it goes without saying that construction activities have a close bond with the real, financial activities of macroeconomics, and have been viewed as the “the industry responsible for the lending business cycle” in Taiwan in that construction projects stimulate so many other economic activities from the cement and ceramics industries and the steel and iron industries to the electric appliance industries, among many others. Figure 3 presents time-plots of the macroeconomic conditions (which is proxied by the score of macro business cycle indicator and GDP growth rate) and the economic conditions of housing market activities (which is proxied by the score of real estate cycle indicator) on the Y axis. The X axis represents the time flow. Most
obvious here are the very similar patterns for the macro business cycle indicator and GDP growth rate-not surprising that these two indicators are based on the same concept. This figure also shows the construction industry is always referred to the leading business cycle. As the vertical line presents the peaks of macroeconomic activity, and the coincidence pattern with real estate indicator appears in 1987, 1999 and 2003. However, it is clear that the leading pattern for the real estate indicator appears in 1993 and 1996.
Figure 2 Relationships between Monetary Supply and LoanAmounts to the Construction Industry 30000 35000 40000 45000 50000 55000 60000 65000 70000 75000 80000 1 99 5/1 /1 1 99 5/7 /1 1 99 6/1 /1 1 99 6/7 /1 1 99 7/1 /1 1 99 7/7 /1 1 99 8/1 /1 1 99 8/7 /1 1 99 9/1 /1 1 99 9/7 /1 2 00 0/1 /1 2 00 0/7 /1 2 00 1/1 /1 2 00 1/7 /1 2 00 2/1 /1 2 00 2/7 /1 2 00 3/1 /1 2 00 3/7 /1 2 00 4/1 /1 2 00 4/7 /1 2 00 5/1 /1 2 00 5/7 /1 3,000 3,500 4,000 4,500 5,000 5,500 6,000 6,500 7,000
M1b (NT$ billion) Loans for the Construction Indus try ($NT billion)
Data source: This figure shows the monetary supply (which is proxied by M1b and is shown as the black
line on the left-hand side) and loans to the construction industry (which is depicted as the black dashed line on the right-hand side). The above data are from the Statistics of the Central Bank, Taiwan. The vertical black line indicates the time-point of the Asian financial crisis. The vertical black dashed line indicates the reverse trend that will be discussed in this paper.
In this regard, there has been a tremendous body of studies devoted to housing and business cycle. It is well worth noting that Leung (2004) provides a very good survey of this topic.3 Also, since DiPasquale (1999), there has been a great deal of discussion on housing supply, including that of Glaeser et al (2005), Jin and Zeng (2004), Lai and Wang (1999), Wang and Zhou (2000), Wang et al (2000), to cite a few; those studies are, of course, closely related to the construction industry. From
3
Leung (2004) reviews the literature on the interaction of the macro-economy and the housing market. He especially focuses on the following topics: (1) housing and taxation; (2) housing and business cycles; (3) housing ‘‘long cycles’’; (4) urban micro-structure.
these, one question arises and deserves special focus in future research: how do financing channels affect the corporate finance policy of construction firms. In this paper, we extend this question and study how the macro monetary policy via the banking lending affect the borrowing terms and the investment level of the construction firms in the case of Taiwan. Particularly, we also observe whether the effect is different significantly in the period of financial difficulty, where the 1997 Asian financial crisis is taken as the cut-off points.
Figure 3 Leading, Coincidence, and Lagging Relationships among the Macro Business Cycle Indicator, the GDP Growth Rate, and the Real Estate Cycle Indicator
Asian Financial Crisis 1997
98.0 100.0 102.0 104.0 106.0 108.0 110.0 112.0 114.0 116.0 118.0 120.0 1979 1980 1981 1982 1983 1984 1985 1986 1987 1988 1989 1990 1991 1992 1993 1994 1995 1996 1997 1998 1999 2000 2001 2002 2003 2004 Year Ind icator s -3 -2 -1 0 1 2 3 4 5 6 7 8 9 10 11 12 13 14 G ro w th R ate (% )
Macro Business Cycle Indicator Real Estae Cycle Indicators Economic Growth Rate %
Date source: The lighter and black line shows the score of macro business cycle indicator, while the bold,
black dashed line shows the GDP growth rate (%). The above data is taken from the Statistics of Council
for Economic Planning and Development (CEPD) published by the Executive Yuan of ROC. The light
dashed line shows the score of the real estate indicator, which is taken from the Real Estate Research
Center reported quarterly by the National Cheng-chi University , Taiwan
(http://www.housing.nccu.edu.tw/).
Two main findings emerge from our empirical results. First, the borrowing terms for the construction industry are more restrictive than those for other firms. Banks require a higher loan rate as well as more collateral. Second, the construction firms tend to retain more internal funds for future investment, and the sign of the liquidity coefficient has remained significant in the period of the loose monetary policy since the Asian financial crisis. In other words, financial constraints have become more severe for the construction firms in times of restrictive or even during periods of loosening monetary policy.
literature and develops two empirical hypotheses. Section 3 presents the institutional background, and in particular, compares and contrasts to the construction industry of two economies of Hong Kong and Taiwan. Section 4 briefly describes our database and reports the results of our first hypothesis. Section 5 defines the econometric model and the results of the second hypothesis; and the final section reviews our concluding remarks.
2. Related Literature Review and Empirical Hypotheses
We give a fundamental theory of the relationship between the real investment and financial constraints within the context of asymmetric information to the story of this paper. Asymmetric information and moral hazard typically play prominent roles in the theory of the traditional banking finance (Allen and Gale, 2000). If asymmetric information makes it possible for banks to more easily discriminate between healthy and not so healthy borrowers, then the so-called “lemon” borrowers will be charged an extra risk premium, or will be required to provide more collateral. Moral hazard has similar implications. There are three explanations that construction firms in Taiwan have a higher probability of being viewed as “lemons” on the grounds that their information is opaque, and this partially explains the credit crunch policy with regard to bank lending to these firms. First, the term “lemons” is a result ofthe fact that the format of their financial statements is very different from that of other industries. Their revenue identification, for example, is based on “the principle of proportion to the construction schedule”, not on the principle of “realized” or “accrual” that is applied to other general industries. This discretionary makes the financial statements of the construction firms less transparent and, as a consequence, more susceptible to “earning management”.
On the other hand, the financial structure of the construction industry in Taiwan is heavily dependent on private bank financing. Shen and Wang (2005b) points out that the average debt to asset ratio is 40%~50% among general industries in Taiwan. That is contrast with the highly elevated 65%~70% ratio in the construction industry. Because of the large financing needs for the activities of real estate development, the construction industry in Taiwan, like that in many other countries, has more leveraged capital structure. When risk greatly increased during the period of the Asian financial crisis, banks became more reluctant to lend to companies with poor information availability or to those with high financial leveraged risk which led to the weak balance sheets on the part of the construction firms.
Finally, the construction firms in Taiwan are relatively small size as this contributes to more serious information asymmetry. These firms are characterized by the predominance of relatively small and medium-size businesses, with only 2.5% of construction firms having more than 100 employees. Very few businesses have access to the international capital markets. These features are significant consequences from certain monetary policy measures, and this leads to the conclusion that the credit channel is of great importance to the construction firms in
Taiwan.
In other word, the first hypothesis posits that the borrowing terms imposed on the construction industry are more restrictive, thereby reflecting the lemons effect on the cost of bank financing. Furthermore, in imperfect capital markets, the asymmetric information and moral hazard may be enough reason for firms to be financially constrained (Hubbard, 1995). The credit channel of monetary transmission mechanism states that the monetary contractions reduce bank loan supplies to the real sector, causing credit-constrained investment to decrease (Mishkin, 1995). The view of credit channel stresses the limited access to capital markets for certain companies and this allows for implication that there are cross-sectional differences in the financing and investment behavior of certain firms.
Gertler and Gilchrist (1994) found small firms, which are most likely to be bank-dependent, bear most of the shocks during a monetary contraction. Along similar lines, Kashyap, Stein and Wilcox (1993) found that tight money intensifies the correlation between liquidity and investment for bank-dependent firms. To mitigate the possibility of financial constraints, “lemons” like construction firms tend to retain more “cash flow (or retained earnings)” on hand for future investments than do other firms. Simply put, for construction firms, investment decisions are often seriously affected by the financing methods available to them. And this is certainly the case in Taiwan. At the same time, the asset size of Taiwan’s construction firms is relatively small, and very few businesses have access to international capital markets, as mentioned before; thus, the financing channel of the construction firms in Taiwan must mainly be through banks.
In this study, we build on previous studies which hypothesize that the credit channel effects are likely to be most important to those firms that can be classified as bank-dependent borrowers. Firms that are highly bank-dependent or less healthy should, therefore, suffer greatly from a contraction of credit. More specifically, Hypothesis 2 postulates whether financial constraints vary systematically within the construction firms and non-construction firms. We expect that the construction firms tend to retain more internal funds for future investment in the period of the loose monetary policy since the Asian financial crisis. In other words, financial constraints have become more severe for the construction firms in times of restrictive or even in the loosening monetary policy.
3. Institutional Background: A Comparison of the Construction
Industry in Hong Kong and Taiwan
To be sure, Hong Kong and Taiwan, two of the fastest-growing economies in the Pacific Rim, share many similarities in their housing market. For example, both have a highly dense population on their small islands and as a rule a thumb, their people like to invest in real estate, in particular. Moreover, the literature on the structure of the Hong Kong and Taiwan housing markets is closely related since they both have
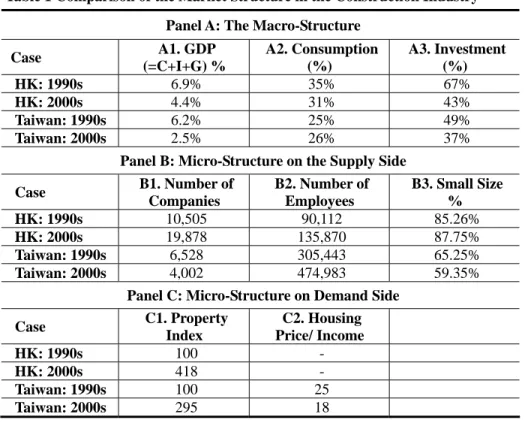
the pre-sale system4, which is viewed as driving real estate cycle with high volatility (Chang and Ward, 1993; Wang and Zhou, 2000). We specifically look at the empirical work of Leung and Wong (2004) and Lai and Wang (1999). Leung and Wong (2004) have carried out an economic analysis of the construction industry in Hong Kong since 1990 in the context of a socio-economic environment which is subject to changing governmental policies. Their paper studies the construction industry in Hong Kong, which also experienced the 1997 Asian financial crisis. Here, as shown in Table 1, we compare and contrast to the construction firms of two island-economies, given the similarities and dissimilarities in the industry structure.
3.1 Macro-Structure of the Construction Industry
Panel A of Table 1 presents the macro-structure of the GDP components for Hong Kong and Taiwan. In terms of the GDP share, the importance of the construction sector is comparable in both economies. There has however been toward a decline in building and construction share of GDP relative to other industries in both Hong Kong and Taiwan. From the 1990s to the early 2000s, the GDP share ratio dropped considerably from 6.2% to 2.5% in the case of Taiwan but fell less drastically from 6.9% to 4.4% in the case of Hong Kong. Leung and Wong (2004) point out that the contribution of construction activities to the economy of Hong Kong is more or less the same as that in the United States. Compared to other Asian countries, Hong Kong and Taiwan are within the middle band (South Korea is at the top, while Thailand is at the bottom). Pertinent here is that the declining trend is more significant in the case of Taiwan. Leung and Wong (2004) explain what drove the rapid expansion in HK in the early 90s, and they go on to explain that the subsequent decline seems to have been related to the government’s slow-down in the building of infrastructure projects and some new housing policies. However, the same reasons do not apply to the Taiwan, where the most promising industries shifted from asset-oriented firms in the 1990s to the new high-tech firms since the early 2000s. This trend has been less important for construction firms in Taiwan. Another particularly noteworthy difference is that government policy gave construction firms in HK more support than in Taiwan after the Asian financial crisis.5
4 Because of the lack of well-function of financing system in the early age of Taiwan’s capital
market, developers in the housing industry tend to finance their need in a way that was very similar to the “internal financing of turning over“. Most developers made use of private banking debt, and had an obligation to pay interests at certain times. They received a partial amount--10% of total price--before the pre-sale in the second housing case, and these some amounts supplied the interests of the financing of the first-sequential case. This is why we refer as “turn over”. If one case in the commercial housing pre-sale advertisement did not go smoothly, the financing of the pre-going-case will be disturbed. Hence, the custom of pre-sale has a significant implication for the heavy financial risk in the housing industry firms.
5 Since capital stock is one important element of GDP and is roughly the accumulation of
Table 1 Comparison of the Market Structure in the Construction Industry Panel A: The Macro-Structure
Case A1. GDP (=C+I+G) % A2. Consumption (%) A3. Investment (%) HK: 1990s 6.9% 35% 67% HK: 2000s 4.4% 31% 43% Taiwan: 1990s 6.2% 25% 49% Taiwan: 2000s 2.5% 26% 37%
Panel B: Micro-Structure on the Supply Side
Case B1. Number of Companies B2. Number of Employees B3. Small Size % HK: 1990s 10,505 90,112 85.26% HK: 2000s 19,878 135,870 87.75% Taiwan: 1990s 6,528 305,443 65.25% Taiwan: 2000s 4,002 474,983 59.35%
Panel C: Micro-Structure on Demand Side
Case C1. Property Index C2. Housing Price/ Income HK: 1990s 100 - HK: 2000s 418 - Taiwan: 1990s 100 25 Taiwan: 2000s 295 18
The data of HK is from Leung and Wong (2004) for Panels A and B and from Lai and Wang (1999) for Panel C.The data of Taiwan is from the Statistics of Council for Economic Planning and Development (CEPD) for Panels A and B and from Real Estate Research Center of National Cheng-chi University for Panel C. The definition of “Small Size” in the case HK case is an asset size of less than 2,500,000 (HK), and in the case of Taiwan, is the number of employees, i.e., fewer than five people. “-“denotes the data are not available.
Since construction represents a dual kind of consumption goods and capital investment goods, another way to assess the significance of the construction industry is to look at expenditures and investments in construction. Column A2 in Panel A shows that, from the 1990s to 2000s, the share of private expenditure on building and construction was 35% to 31% in the case of Hong Kong but only 25% to 26% in the case of Taiwan. It is true that the trend could be considered more stable in Taiwan, but even so, both Hong Kong and Taiwan, both clusters of small islands, had a higher percentage when compared to that in other developed countries. Column A3 in Panel A shows the expenditures on building and construction as well as its percentage share of Gross Domestic Fixed Capital Formation (hereafter,
property and other infrastructure has decreased in importance in Taiwan over time. There was some preliminary evidence that the decline was initialized by fewer government projects and other infrastructure, followed by the reduction in non-residential investment and finally by the reduction in residential investment.
GDFCF) over time6. In percentage terms, building and construction accounted for about half of the total investment expenditure, with a steady decline from 67% to 43% over the 1990~2003 period in the case of HK and a steady drop from 49% to 37% in the case of Taiwan. In other words, the common trend in both cases was a declining contribution of fluctuating expenditure on building and construction. However, we can’t gain further insights by breaking down investment expenditure on building and construction into three components: residential buildings, non-residential buildings and other construction (e.g. infrastructure) for Taiwan.7
3.2 The Micro-Structure of the Construction Industry-- Supply Side
Contractors are the main producers of construction works. Leung and Wong (2004) show the industry in HK is characterized by a large number of small firms but only a small number of large firms. In terms of the number of establishments, almost 90% of all contractors are very small, with value-added less than HK$2.5 million per company. These contractors each employ fewer than 5 persons on average. A very similar pattern prevails in Taiwan, and it is clearly dominated by a small number of disproportionately large firms. However, the number of construction firms in Taiwan is relatively smaller than that as column B1 (Number of Companies) and column B3 (the percentage of Small Size Number to Total Construction Firms) in Panel B indicate. This suggests that the construction industry in both cases is more concentrated than in other developed countries.8
3.3 Micro-Structure of the Construction Industry -- Demand Side
Panel C shows the micro-structure on the demand side, which is proxied by the Property Price Index. Lai and Wang (1999) notes the Hong Kong housing market experienced a few major booms. Real estate prices in 1996, for example, was found
6 To control for the effect of inflation, GDFCF is expressed in constant (2000 year) market
prices.
7 In the HK study of Leung and Wong (2004), in the early 1990s, the residential and
non-residential components remained relatively stable. On the other hand, from 1997 to 1999, residential investment grew much more quickly than non-residential investment and despite the negative impacts of the Asian financial turmoil. This possibly reflects the change in government policy towards a higher homeownership rate. But after 1999, the residential component declined along with the nonresidential component.
8 As Leung and Wong (2004) and Chiang et al. (2001) also point out the entry barrier to the
construction industry in both cases of HK and Taiwan, especially for building works, is relatively low largely on account of their low technological requirements. Chiang et al. (2002) also suggested that contractors generally have low capital requirements as they can obtain project financing from developers through interim payments. The only barrier is a resulted of the selective tendering system adopted by the government and some private clients in large projects, which require that contractors to have a proven track record, sufficient experience, and strong financial capabilities. This had deterred small contractors from directly being award the main contracts of large projects.
to be even higher than those of Tokyo (see Fung, 1996). The property price index rose by over 50% (see the February 25, 1998 Executive Summary of the Hong Kong Monetary Authority). In 1995, the ratio between the monthly mortgage payment for a medium-sized flat and the median monthly household income was as high as 73% (see the Hong Kong Consumer Council, 1996). Analyzing the impact of overconfidence in overbuilding and cycles in the real estate market of HK, Wang, et al. (2000) indicate that pre-sale activity has increased volatility in the real estate market. This phenomenon also occurs in Taiwan, but the trend is not as intense. For example, Chang (1995) studied the pre-sale system of Taiwan and determined it is also one source of market price instability. Hence, the affordability of housing which is proxied by the multiples of the average housing price in Taipei to the average year-income was sharply reduced from 25 multiples in the 1990s to 18 multiples in the 2000s, reflecting the recession in the real estate market after the Asian financial crisis, when housing prices decreased substantially.
4. Data and Sample Basic Summary Statistics of Taiwan
4.1 Data Source and Sample Selection
Much of the existing literature on the distribution effect of the credit crunch focuses on the bank characteristics or firm size, and this may reflect the degree of information asymmetry. Very little is known about the specific industries. Studying bank loans and real estate cycles in Taiwan using aggregate, firm-level and loan-level data, Chen and Wang (2005a, b) examine, for example, whether or not the slowdown in credit growth following the Asian crisis could be attributes to a shift in the demand or a shift in supply. The major empirical result shows that the large decline in supply was mainly responsible for the slowdown, and they identify a deposit drain and an increase in past due loans as the main contributing factors. More particularly, in their attempt to determine which types of firms were most affected by the credit slowdown, they conclude that smaller firms were disproportionately affected by the credit cutback. In our paper, we also use micro data of bank loans, and our unique data set allows us to investigate whether the credit decline showed a general credit contraction, or whether the cutback was borne disproportionately by certain types of firms. This paper intends to help fill this gap in the literature and thereby further enhance this line of research.
To explore our two hypotheses, we are interested in a more detailed picture which comes from studies on firm level data, by way of comparison, while most previous studies have used aggregate data of bank loans to analyze the credit channel. To the best of our knowledge, this study is the first to use individual bank loan data at the firm level. Such data allow us to test for cross-sectional differences in bank borrowing among different types of firms. Furthermore, our unique individual transaction loan data allow us to free our results from possible aggregation bias,
which was characteristic of past studies, and our results are expected to provide more convincing evidences, as suggested by Shen (2002).
Our individual loan transaction data set is collected from Taiwan Security Exchange Council (TSEC hereafter) laboriously. In Taiwan and as in many countries, listed companies are required to send their balance sheet and income statement to SEC. However, when sending these two publicly available financial statements, the companies in Taiwan are further required to attach a “long format” financial statement, which describes how each item in the two publicly available financial statements is compiled in details9. This long format financial statement though is not directly available to the public can be obtained by application of Xerox. This long format financial statement has recorded each loan transaction data, including the loan rate, bank name, loan amount and duration of lending etc. Since borrowers’ and lenders’ name are obtained, we also collect their financial statements if they are listed companies. Hence, not only loan contract information is collected, but also financial statements of both lender and borrowers are taken. Equipped with individual transaction data set, our two hypotheses can be explored.
It should be noted that different countries or individuals may have different definitions of the term “construction”. Some may argue that “construction” should not be so narrowly defined such that it only includes on-site activities. Based on the recording method of Rowlinson and Walker (1995), construction-related activities include architectural, surveying and project engineering services, real estate development, leasing, maintenance management, brokerage and agency, property holding and re-sale and the ownership of premises. Leung and Wong (2004) adopt the above broader view for Hong Kong and find the construction industry accounted for 22% of GDP there, making it the second largest industry in Hong Kong. However, simply out of concern for pure and simple empirical results, we only take into account the more narrowly-defined construction activities. Following the definition adopted by the Census and Statistics Department of Taiwan, “construction” here refers to those activities undertaken by contractors for the construction of buildings and other structures and facilities.
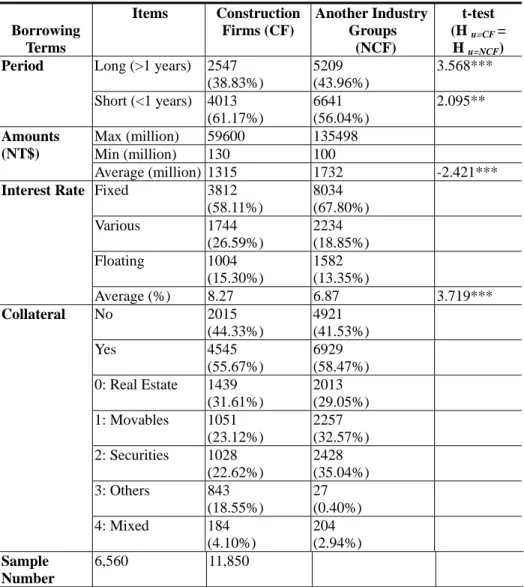
4.2 Comparisons of Borrowing Terms for Construction Firms and Other Firms in Taiwan Table 2 illustrates the basic properties of the borrowing terms for the construction firms and other firms in Taiwan and presents their descriptive analysis of basic summary of statistics. The data cover the 1991~2005 period.
4.2.1 Borrowing terms for construction firms
(1) Borrowing periods: As shown in Table 2, the number of long-period loans (over one year) was 2,547 (38.83% of the full sample) during the 1991~2005 period,
9 The “long” format financial statement in Chinese means “detailed” financial statement, see
whereas the number of short-period loans (less one year) was 4,013 (61.17% of the full sample). It seems that the borrowing period for construction firms tend to be short, a fact that may reflect the higher credit risk of housing construction firms that banks evaluate.
(2) Borrowing amounts: The average amounts were $1,315 (unit: million / New Taiwan Dollars, with NT$33 to US$1 in 2005/12). The maximum amount of single borrowing was $59,600 (million), while the minimum was $13 (million).
(3) Interest rate level: A total of 3,812 units belonged to a fixed interest rate of borrowing terms (58.11% of the full sample). There were 1,744 units (26.59% of the full sample) at various interest rates10. Loans with a floating interest rate amounted to 1,004 units (15.30% of the full sample). The average borrowing interest rate of all samples was 8.27%.
(4) Collateral: There were 4,545 units that had collaterals (55.67% of the entire sample) and 2,015 units that did not require any collateral (44.33% of the entire sample). Looking at the different species of collateral in detail, we note that the group in real estate, e.g. land, had the largest proportion, 31.61%, of the number that had collateral and that those in movables had the second largest (23.12%). Those in securities shared 22.62%. The evidence clearly and reasonably explains that the causes of a financial or banking crisis can partially be blamed on the sharp decrease of this type of collateral value.
4.2.2 Borrowing terms for non-construction firms
(1) Borrowing periods: The number of long-period loan terms (over one year) was 5,209 units (43.96% of the full sample) during the 1991~2005 period, whereas the number of short-period loans (less one year) was 6,641 units (56.04% of the full samples). Comparing these figures with those of housing construction firms, we are left with no doubt that the loan periods for non-construction firms (43.96%) tended to be significantly longer than those for construction firms (38.83%).
(2) Borrowing amounts: The average amount was 1,732 (million). The largest amount of single borrowing was 135,498 (million), while the smallest amount was 10 (million). The most significant difference here lies in the fact that the loan amounts of construction firms were definitively smaller, in all likelihood indicating that bank lending policy is considerably tighter for construction firms in Taiwan. (3) Interest rate level: A total of 8,034 units belong to a fixed interest rate of borrowing (67.80% of the full sample), while 2,234 units (18.85% of the full sample) had various interest rates, and another 1,582 units (13.35% of the full sample) had
10
The term “variable” also means “changeable”. For example, if something happened, the interest rate can be changed to another level. The term “variable” interest rate is used to control for the agency problem.
floating interest rates. It is worth noting that the average loan interest rate was 6.87% for non-construction firms, a rate that was 1.40% lower than that of construction firms. Equally important is that this probably reflects the default risk premium that “lemons” are forced to pay because many construction firms have closed their business operations since the financial crisis because of the high financial leverage of capital structure.
(4) Collateral: There were 6,929 units that required some type of collateral (58.47% of the sample) in the non-construction industry and 4,921 units that did not have any (41.53% of the sample). It should be noted that among non-construction firms, the species of collateral can be broken down as follows: securities had the largest proportion share with 35.04% of the total number that had collaterals, and movables had the second largest share (32.57% of the total number that had collaterals). Real estate, that shared the largest proportion among construction firms, only had a share of 29.05% for non-construction firms.
We performed a t-test on our comparison of borrowing terms across industry groups, i.e., construction firms and non-construction firms. The evidence generally supports the first hypothesis. That is, the construction sector likely faces more credit constraints and, as a consequence, may react strongly to monetary policy measures. The loan terms for construction firms are more restrictive-- for example, they are for a shorter period (61.17% vs. 56.04%), for smaller amounts ($1315 vs. $1732 million) and have higher interest rates (8.27% vs. 6.87%). The extra cost of capital for construction firms (1.40%=8.27%-6.87%) reflects the default risk premium that “lemons” must pay. It could be viewed as the accelerated factor to impetus leading to declining operations in what was once a bearish real estate market.
5. Econometric Specifications and Empirical Results
Based on the theory of information asymmetry, construction firms in Taiwan have a higher probability of being considered as “lemons”, and this may account for explaining the credit crunch policy that banks adopted when it came to lending to these firms. For the most part, banks may respond to monetary restrictions, not only by generally restraining credit, but also by applying more stringent lending policies on those customers that are perceived as being less credit-worthy. From this perspective, we look at two conditions from the credit channel in the construction industry. Firstly, we compare the borrowing terms of construction firms with those of non-construction firms. If our argument is correct, the borrowing terms of construction industry are more restrictive. This hypothesis had indeed been supported in Section 4.2.
Secondly, we observe the physical investment behavior during the period of Asian the financial crisis. At the end of 1997, the local Taiwan crisis, echoing that caused by the Thai and Indonesian crises caused Taiwan to experience a sharp and unanticipated economic depression. This, in turn, triggered a series of unprecedented
business crisis, most notably in the construction industry and in some local commercial banks.
Table 2 Comparison of Borrowing Terms across Industry Groups
Borrowing Terms Items Construction Firms (CF) Another Industry Groups (NCF) t-test (H u=CF = H u=NCF) Long (>1 years) 2547 (38.83%) 5209 (43.96%) 3.568*** Period Short (<1 years) 4013 (61.17%) 6641 (56.04%) 2.095** Max (million) 59600 135498 Min (million) 130 100 Amounts (NT$) Average (million) 1315 1732 -2.421*** Fixed 3812 (58.11%) 8034 (67.80%) Various 1744 (26.59%) 2234 (18.85%) Floating 1004 (15.30%) 1582 (13.35%) Interest Rate Average (%) 8.27 6.87 3.719*** No 2015 (44.33%) 4921 (41.53%) Yes 4545 (55.67%) 6929 (58.47%) 0: Real Estate 1439 (31.61%) 2013 (29.05%) 1: Movables 1051 (23.12%) 2257 (32.57%) 2: Securities 1028 (22.62%) 2428 (35.04%) 3: Others 843 (18.55%) 27 (0.40%) Collateral 4: Mixed 184 (4.10%) 204 (2.94%) Sample Number 6,560 11,850
For detailed definitions of borrowing terms, see Shen and Wang (2005a). The time period for all loan transactions is from 1991~2005. ( ) represent the particular group percent of the entire sample. ***, **, and * denote the significant level at 1%, 5% and 10%, respectively.
For the first hypothesis, the banking crisis unfolded with heavy losses, and just as the domestic interest rates rapidly increased in response to swift monetary restrictions to restore market confidence, asset markets (of stocks and real estate)
began to collapse. However, with the monetary authority of Taiwan’s Central Bank taking reverse actions in an attempt to quickly help the economy recover, within one year after the Asian financial crisis, the same authority had decreased the interest rate nine times and implemented plans to maintain a loose monetary policy. Here, we put forth the position that bank-dependency is one of the sources of potential financial constraints for physical investment and that such changes in monetary policy as changing bank loan supplies could have greatly affected the severity of the constraints. Thus, we argue that the construction firms had to bear most of the reductions in bank loans when money was tight. In other words, we investigate whether there were asymmetric effects in cross-sectional in and out of periods. The following section checks the second hypothesis which posits construction firms should retain more cash-holding for future investment. There are three sub-sections, the first of which discusses models of the specifications while the second defines the variables including all regressions and the final section presents the empirical results.
5.1 Econometric Models
In this sub-section, we investigate the effect of monetary policy on the financial restrictions. In line with Kashyap and Stein (1997)’s two stages, we use non-linear procedures. In the first stage, we run separate cross-section regressions for each time period and each industry class (This is also called panel data type). From each regression, we obtain a coefficient for each financial restriction. In the second stage, we repeat a time series of these coefficients on a monetary policy measure for each industry class. This second regression provides a notion as to how monetary policy affected the financial constraints for different industries. In the first stage, we parameterize the model more parsimoniously than the error correction model, as only the coefficients on the financial constraint are of interest. Consistent with Kashyap and Stein (1997), we include a lagged dependent variable and the cash flow variable in the first stage of the model. We discuss this in more detail in the following.
Studies of the sensitivity of investment to credit channel typically employ the following regression (Fazzari, Hubbard and Peterson, hereafter, FHP, 1988):
( )
I Kit =μ
i+β
1( )
Qi,t+1+β
2(
LiqK)
i,t−1+β
3(
p K)
i,t+β
4(
p K)
i,t−1+ε
i,t (1)T t
N
i=1,2 ,...., , =1,2,....,
where subscript i denotes the i-th firm; t denotes the t-th period;
I
is the gross investment; Q is Tobin’s Q;Liq
is the value of liquidity;p
is sales plus the changes in inventories, standing proxy for the income effect of investment;K
denotes capital, equal to long-term debt plus equity which serves as a scale variable; and sub-T and N index over T periods, and N firms, respectively.
The liquidity coefficient,
β
2, which is the focus of FHP, indicates the sensitivity of investment to liquidity. A significantβ
2 implies that investment is sensitive to the liquidity, whereas an insignificantβ
2 implies that it is not. Because a firm may invest more and retain more cash flow or retained earnings (the proxy to liquidity) due to potential future investment opportunities and not due to financial constraints, we include which we use to remove these opportunities. The financial leverage, however, plays no role in the above FHP model. In this paper, we re-write the equation (1) as follows: Q(
)
= + + +(
)
− + (1)(
)
,−1+ 3 1 , ) 1 ( 2 1 , ) 1 ( 1 ) 1 ( 0 ,t it it it i Q Liq K P K K I β β β β(
*)
(1) ) 1 ( 5 ) 1 (4 YEARit β Liq Yearit εi
β + + (1a)
(
)
= + + +(
)
− +(
)
,−1+ ) 2 ( 3 1 , ) 2 ( 2 1 , ) 2 ( 1 ) 2 ( 0 ,t it it it i Q Liq K P K K I β β β β(
)
(2) ) 2 ( 5 ) 2 (4 YEARit β Liq*Yearit εi
β + + (1b)
( )
1 2 ) 1 ( 1 0 t ) ( t R =α +α β (2a)( )
22 ) 2 ( 1 0 t ) ( t R =α +α β (2b)where Year is the dummy variable. If a certain year is in the period of 1997~2000 (after the Asian financial crisis), the Year dummy is 1; otherwise, it is zero. R is the interest rate and represents the effect of monetary policy. Kashyap and Stein (1997) argued that most central banks use the re-discount rate or short term interest rate (which is proxied by the weighted average loan rate for the five largest banks in Taiwan) as the operating target of monetary policy. We use these two proxies. For details, please refer to Table 6. We account for the economic intuition behind these equations in the following:
1. According to the above finance theory:
(1) If the firms belong to the construction industry, they may face more serious information asymmetry and have a relatively weak banking relationship; thus, construction firms need to maintain more liquidity because they may not be able to obtain funds from bank loans, which suggests a positive
β
2(1).(2) Alternatively, non-construction firms can obtain funds from bank loans relatively easily, and hence, they tend to keep less cash on hand, which suggests an insignificant (2)
2
β .
2. According to the literature of banking finance, monetary policy has a greater influence on “lemons” (e.g., lower-net-worth firms or high-leverage business), and thus, . This effect was more obvious, after the financial crisis. To sum up, our financial constraint hypothesis is simply a question of jointly testing
| ) 2 ( 1 | | ) 1 ( 1 |α f α 0 0 : H0 β(21)f ,β(22)= ; H : | 12 1 1 ' 0 | | | ) ( ) ( α α f
5.2 The Definition of Variables and Basic Statistics
The liquidity variable is typically proxied by the holding of corporate cash and its equivalents11 (Houston and James, 2001), or the operating cash flow (OCF) (Hoshi, Kashyap, and Scharfstein, 1991; Gibson, 1995). We also take into account two proxies for the robustness test. The reasons for including other explanatory variables will be discussed in the following. We refer readers to FHP for detailed arguments.12
( )
I
es
Expenditur
Investment
The definition of
I
is the flow amount of gross investment, which is measured as the change of fixed assets gross investment (such as plant property and equipment) for the non-construction firms and the inventory of land for the construction firms. Tobin’sQ
As is traditional standard in studies on investment spending, we first run the regression based on the
Q
theory. In a perfect capital markets, the level of investment should only be related to the profitability of a firm’s investment opportunities, and should be unrelated to a firm’s internally generated cash flow.13 This theory predicts that should be the only determinant of investment if external financing does not matter. Here, refers to average , and is measured by the ratio of the market value of outstanding stock divided by the book value of total assets taken to the replacement costs in the next period to reflect the future expectation of investment profit.Q
Q
Q
14( )
P
Production
We include lagged production in the regressions, where production is defined as sales plus the change in the inventory of final good. This accelerator effect is important in the literature on empirical investment despite the lack of a compelling theory behind it.
( )
K INDUSTRY(
INDU)
Capital riables Control Va : , Dummy(
YEAR)
YEAR Dummy and11 This is equal to the cash holdings plus short-term securities. This is a concept of stock. But, the operation cash flow is a concept of flow. 12 In the literature, the interpretation of financial variables like cash flow being indicative financial constraints, has been discussedin Hubbard (1997) and Kaplan and Zingales (1997).
13 This is typically referred to as Modigliani and Miller Proposition I (M&M I). The proposition states that it is completely irrelevant how a firm chooses to arrange its finances. High liquidity signals that the firm has done well and is likely to continue doing well. Thus, more liquid firms have better investment opportunities; hence, when determining the investment effects of liquidity, we include Q to control for the expected profitability of investment when determining.
14 As for the arguments concerning marginal Q and average Q, see Hayashi (1982). In reviewing such studies, we are struck by the variety and complexity of the procedures used to estimate Q. Perfect and Kenneth (1994) provided a good summary of the different methods and their deficiencies. In this paper, we use the common method defined by Lang and Litzenberger (1989).
Following the existing literature, we deflate the variables Investment (I),, Liquidity (LIQ), and Production (P) by the level of the beginning of period capital stock to eliminate the effects of scale. To the extent that the firm-specific effects on investment, we include originally industry dummy variables in the regression to capture some of these effects. Our sample industries can be further classified into construction (INDU = 1) and non-construction industries (INDU = 0). This excludes the bias that liquidity is likely to proxy well for the value of investment opportunities in a certain industry. To weed out macro shocks, we also include a yearly dummy.
( )
ε
Residuals
ε
is a mean-zero residual reflecting any mis-measurement of , optimization errors, and other omitted factors that could affect firms’ investments.Q
Table 2 reports the descriptive statistics for the four explanatory variables. The means of Iit Kit , Qi,t−1, Liqi,t−1 Ki,t−1 (liquidity has two proxies: OCF and CASH;
see Section 4.2.2 for more details) and Pit Kit are 0.756, 9.442, 5.395(OCF), 8.437(CASH), and 2.571, respectively. Also reported are the standard deviations along with the maximum and minimum values of these variables. Most variables,
(
I K)
i,t,Qi,t+1, and(
P K)
i,t−1, display an obviously higher volatility, and theirstandard deviations are much larger than their means. It is worth noting again that the minimum liquidity is negative for the two proxies, indicative of worsening balance sheets.
Table 3 Descriptive Statistics of the Variables for Construction Firms in Taiwan
Variables Mean Std dev. Max Min Skew. Kurt.
(
I K)
i,t 0.756 0.435 3.452 0.127 2.445 5.704 1 ,t+ i Q 9.442 17.549 41.558 0.775 9.447 17.425 OCF:(
Liq K)
i,t−1 5.395 8.870 12.918 -3.568 -2.449 1.563 CASH :(
)
1 ,t− i K Liq 8.437 5.902 15.402 9.442 1.079 4.553(
P K)
i,t−1 2.751 2.445 8.995 0.904 1.215 1.395Variable Definitions: 1. I (Investment, Capital Expenditures): The increased amounts of gross investment, which is measured as the change of expenditures on fixed assets gross investment (such as plant property and equipment) for the non-construction firms and the inventory of land for the construction firms.2.Q: Market Value/Book Value, which is measured as the ratio of the market value of outstanding stock divided by the book value of the firm’s total assets. 3. Liquidity: There are two proxies. (1)OCF: Operation cash flow which is measured as net income before extraordinary items and depreciation, and this cash is from the normal activities of business. (2) CASH: cash plus cash equivalents and short-term securities. 4. Sales: Revenue in sales. 5. K: capital which is measured as long-term debt plus equity. The period for all variables are 1991~2005.
5.3 Empirical Results
This section shows the results of the relationship between the liquidity and investment relationship. The evidence fully confirms the notion that firms belonging in construction industry increase their reliance on their own internal funds when they have a need for financing need to partake in investment opportunities.
Table 4 presents the results with different model specifications, in accordance with the industry group (the construction and non-construction industries). To conserve space, we briefly summarize our results and do not report the coefficients of the dummy variables. Eq. (1a) and eq. (1b) focus on the hypothesis:
. As mentioned earlier, the construction firms may face more serious information asymmetry and have a relatively weak banking relationship. Thus, construction firms need to maintain more liquidity because they may not be able to obtain funds from bank loans, which suggests a positive . Alternatively, non-construction firms can obtain funds from bank loans relatively easily, and hence, they tend to keep less cash on hand, which suggests an insignificant ).
0 , 0 : H0 β2(1) > β2(2) = ) 1 ( 2 β β(2 2
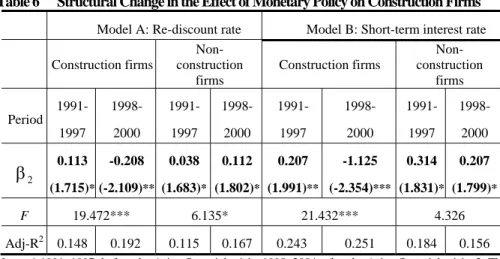
First of all, we present the results of the liquidity coefficients estimated using the OLS. If the proxy for liquidity is OCF (Operation Cash Flow), the estimated coefficients are 1.438 and -0.965 for the sample of construction and non-construction firms, respectively. But only the coefficient for construction industry is significant at 5% level. Apart from this, when we change the proxy for liquidity to CASH (cash plus the cash equivalents and short-term securities), the estimated coefficients are 1.892 and 1.247 for the sample of construction and non-construction firms, respectively. Both coefficients are significant at the 10% level at least. The results may indicate the liquidity reserved by Taiwan’s firms is the broad definition of cash in general, measured as cash plus the cash equivalents and short-term securities. The above results seem to definitively support our second hypothesis that bank lending attitude truly has a disadvantageous effect on construction firms’ investment as shown by the fact that the liquidity coefficient is larger and more significant for the construction industry.
For still more evidence from testing the structural change in liquidity, we include the interaction term of liquidity and the year dummy. If the liquidity proxy is OCF, the coefficients of the interaction term (Liq/K*YEAR) are 1.775 and -1.346 for the sample of construction and non-construction firms, respectively, but the sign is only significant in the construction sample. This evidence means that construction firms have been more financially constrained since the Asian financial crisis than other groups. If we use the CASH to proxy liquidity, the sign is again only significant for the construction sample, and the coefficient is 1.918, which is larger than 1.892 in the whole period.
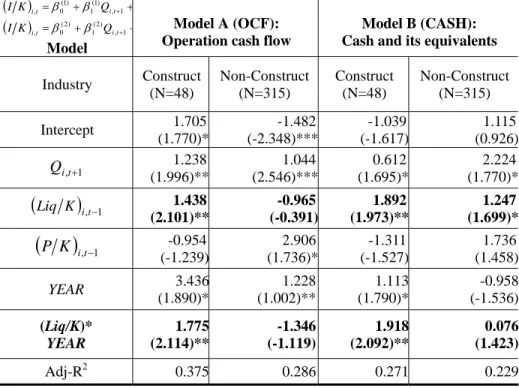
results are fully consistent with our hypothesis at the sign of the liquidity sensitivity of investment to monetary policy. If the proxy for monetary policy is the re-discount interest rate, the estimated coefficients are –1.642 and 1.136 for the sample of construction and non-construction firms, respectively. Both coefficients are significant at the 10% level. If the proxy is the short-term loan interest rate, the estimated coefficients are –1.778 and 0.948, respectively. In this case, the sign is negative for construction firms but positive for non-construction firms. And, the former value is almost twice large as the latter.
Table 4 Regression Results of Investment and Financial Constraints ( ) ( ) , 1 ) 2 ( 1 ) 2 ( 0 , 1 , ) 1 ( 1 ) 1 ( 0 , t i t i t i t i Q K I Q K I β β β β + + = + + = + + Model Model A (OCF): Operation cash flow
Model B (CASH): Cash and its equivalents Industry Construct (N=48) Non-Construct (N=315) Construct (N=48) Non-Construct (N=315) Intercept 1.705 (1.770)* -1.482 (-2.348)*** -1.039 (-1.617) 1.115 (0.926) 1 ,t+ i Q 1.238 (1.996)** 1.044 (2.546)*** 0.612 (1.695)* 2.224 (1.770)*
(
Liq K)
i,t−1 1.438 (2.101)** -0.965 (-0.391) 1.892 (1.973)** 1.247 (1.699)*(
P K)
i,t−1 -0.954 (-1.239) 2.906 (1.736)* -1.311 (-1.527) 1.736 (1.458) YEAR 3.436 (1.890)* 1.228 (1.002)** 1.113 (1.790)* -0.958 (-1.536) (Liq/K)* YEAR 1.775 (2.114)** -1.346 (-1.119) 1.918 (2.092)** 0.076 (1.423) Adj-R2 0.375 0.286 0.271 0.229The sensitivity measure is different in the two groups. When firms belong to the non-construction firms, they can obtain funds from bank loans relatively easily, and hence will keep lower liquidity on hand, suggesting an insignificant coefficient. On the other hand, construction firms need to maintain more liquidity because they may face information asymmetry more seriously, suggesting a positive coefficient. ***, **, and * denote the significant level at 1%, 5% and 10%, respectively.
These findings can be interpreted in two ways. First, the monetary policy seemingly has less of the expected effect on construction firms. The degree of financial constraints on construction firms has diverse direction to the loose monetary policy (for example, lower interest rate). On the contrary, the construction firms seem to retain more cash on hand. Secondly, after the Asian financial crisis, the monetary authority decreased the interest rate and intended to maintain a loose monetary
policy, and the loan amounts to construction industry sharply decreased. Thus, construction firms were forced to keep cash on hand for future investment, which explains why the liquidity coefficient is negative and significant. There is concert evidence showing that the loose monetary policy did not solve the financial constraints on construction firms. Even though the cash holdings of construction firms are greater than those of other industries, the features of their high financial need and bank-dependency would still remain financial constraints on construction firms.
Table 5 Regression Results of the Cross-Section Comparison
( )
( )
(2b) (2a) 2 2 2 1 0 1 2 1 1 0 t ) ( ) ( t t ) ( ) ( t R R β α + α = β α + α =The proxy to liquidity
Model Model A
Re-discount rate
Model B Short-term loan ate
Industry Construct Non-Construct Construct Non-Construct Intercept 0.771 (1.995)** 1.227 (1.761)* 1.013 (1.842)* -0.854 (-1.522)
2
β
-1.642 (-2.115)** 1.136 (1.806)* -1.778 (-2.086)** 0.948 (1.829)*Adj-R2 0.296 0.201 0.273 0.176
Notes: The number in the parenthesis is the t value. ***, **, and * denote the significant level at 1%, 5% and 10%, respectively.
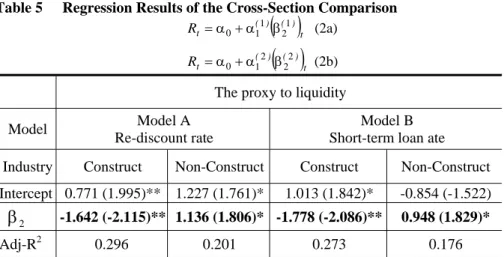
Next, we re-test the structural changes for the liquidity coefficients of investment to monetary policy in different industries. The results are shown in Table 6. When we use the re-discount interest rate to proxy monetary policy in Model A, the coefficient before the financial crisis is 0.113 (t=1.715, at the 10% significant level). After the financial crisis, however, the coefficient is merely -0.208 (t=-2.109, at the 5% significant level). The F value for Chow test is 19.472, up to the 1% significant level. Regarding the group of non-construction firms, the coefficient before the financial crisis is 0.038 (t=1.583), but after the financial crisis, it is higher at 0.112 (t=1.802), with both coefficients up to the 10% significant level. The sign of liquidity of construction firms’ investment shifted from positive to negative both before and after the financial crisis. This shows that construction firms are more financially constrained after the financial crisis. It is abundantly clear that banks imposed more restrictive loan terms on the construction firms.
When we employ the short-term loan interest rate as the proxy, the coefficients of construction firms are 0.207 (t=1.991, at the 5% significant level) and -1.125 (t=-2.354, at the 1% significant level) before and after the financial crisis, respectively. The structural change is significant (F=21.432). However, the
coefficients of non-construction firms are 0.314 (t=1.831, at the 10% significant level) and 0.207 (t=1.799, at the 10% significant level) before and after the financial crisis, respectively. And, there is no significant change (F=4.326). This robust check also supports the above conclusions.
Table 6 Structural Change in the Effect of Monetary Policy on Construction Firms
Model A: Re-discount rate Model B: Short-term interest rate Construction firms Non- construction firms Construction firms Non- construction firms Period 1991- 1997 1998- 2000 1991- 1997 1998- 2000 1991- 1997 1998- 2000 1991- 1997 1998- 2000 2
β
0.113 (1.715)* -0.208 (-2.109)** 0.038 (1.683)* 0.112 (1.802)* 0.207 (1.991)** -1.125 (-2.354)*** 0.314 (1.831)* 0.207 (1.799)* F 19.472*** 6.135* 21.432*** 4.326 Adj-R2 0.148 0.192 0.115 0.167 0.243 0.251 0.184 0.156Notes: 1.1991~1997: before the Asian financial crisis. 1998~2004: after the Asian financial crisis. 2. The number in the parenthesis is the t value. 3. ***, **, and * denote the significant level at 1%, 5% and 10%, respectively.
6. Conclusions
To confirm the transmission of credit in Taiwan’s monetary policy and how it affects the borrowing terms for construction firms and their real investment in Taiwan, this study posits and tests two hypotheses. Construction firms in Taiwan collectively represent an interesting case for the investigation of the effects of credit channel on business investment. This study provides policy-markers with useful insights into various methods to confront recession such as that after for the policy-makers. The main empirical results are presented in the following.
First, in accordance with the theory of information asymmetry, construction firms in Taiwan have a greater likelihood of being viewed as “lemons”, and this helps us understand the credit crunch policy as far as bank lending to these firms goes. Clearly, the lender knows the lemon’s incentive, and therefore, he requires either a risk premium or collateral. Thus, we are able to determine that the borrowing terms imposed on the construction industry are more restrictive than those on other industries. Our empirical results, as shown in Table 2, indicate that the borrowing terms for the construction firm are more restrictive than those for other firms; more specifically, they are for shorter periods of time, in smaller amounts and at higher interest rates. What this means is that the cost of capital for construction firms is considerably higher.
Second, we run the investment regression and intend to try to capture the effect of such monetary policy. The liquidity coefficient, which is our focus, shows the sensitivity of investment to liquidity. We argue that those firms that belong to the construction industry, most probably face more serious information asymmetry, and they may need to maintain more liquidity because they may not be able to obtain funds through bank loans, suggesting a positive liquidity coefficient. In sharp contrast, non-construction firms are more likely to obtain funds from bank loans relatively easily, and hence, they tend to keep less cash on hand, suggesting an insignificant liquidity coefficient. Moreover, this effect has been more obvious since the financial crisis. Based on the results shown in Table 3 and Table 4, the construction firms retained more internal funds for investment opportunities, and the liquidity coefficient is significant. On the other hand, the effect of monetary policy from the channel of firms’ balance sheets is negative and insignificant particularly for the construction firms after the Asian financial crisis. In other words, bank lending attitude has a disadvantageous effect on the investments of different industries.
Since the Asian financial crisis, the monetary authority has decreased interest rate and made efforts to maintain a loose monetary policy. Compared with increases in the amounts banks lend to the non-construction industry, the borrowing terms for the construction industry have been sharply restricted. But, by any measure, the loose monetary policy has not helped mitigate the effects of financial constraints on the construction firms. The sign of liquidity of construction firms’ investment shifted from positive to negative before and after the financial crisis. This attests to the fact that the construction firms have been more financially constrained since the financial crisis. On the weight of the evidence here, there can be no denying that banks in Taiwan have considerably more restrictive loan terms for the construction firms.
Acknowledgement
This study has been supported by the National Science Council of Taiwan (Grant No. NSC 90-2416-H-035-005: Does Financial Liberalization Make Firms and Banks More Risky? A Tale of Two Worsening Balance Sheets). The draft was presented at the AsRES/AREUA 7th Joint International Conference 2002 (in Korea), and 10th 2005 (in Australia). We are grateful for the helpful comments we received at these annual meetings and are also most appreciative of the extremely constructive suggestions from an anonymous referee from this journal.
References
Allen, F., and D. Gale (2000). Comparing Financial Systems. MIT.
Bell, C. and G.. Clemenz (2006). The Desire for Land: Strategic Lending with Adverse Selection. Journal of Development Economics, 79, 1, 1-25.
Bernanke, B.S., and M. Gertler (1995). Inside the Black Box: The Credit Channel of Monetary Policy Transmission. Journal of Economic Perspectives, 9, 4, 27-48. Bernanke, B.S., and I. Mihov (1998). Measuring Monetary Policy. Quarterly
Journal of Economics, 113, 3, 869-902.
Berger, A.N., and G..F. Udell (1990). Collateral, Loan Quality, and Bank Risk,
Journal of Monetary Economics, 25, 21-42.
Chaing, Y.H.; B.S. Tang and W.Y. Leng (2001). Market structure of the construction industry in Hong Kong. Construction Management and Economics, 19, 7, 675-687. Chaing, Y.H.; A.P.C. Chan and E.C. Hui (2002). Capital structure and prifitability of property and construction sectors Hong Kong. Journal of Property Investment and
Finance, 20, 6, 434-453.
Chan, Y.S., and G.. Kantas (1985). Asymmetry Valuations and the Role of Collateral in Loan Agreements, Journal of Money, Credit and Banking, 17, 84-95.
Chan, Y.S., and A.V. Thakor (1987). Collateral and Competitive Equilibrium with Moral Hazard and Private Information, Journal of Finance, 52, 345-363.
Chang, C.O. and C. Ward (1993). Forward Pricing and the Housing Market: the Pre-Sales Housing System in Taiwan. Journal of Property Research, 10, 3, 217-227. Chen, S.; G.H.H. Yeo and K.W. Ho (1998). Further Evidence on the Determinants of Secured versus Unsecured Loans. Journal of Business Finance and Accounting, 25, 371-385.
Chen, N.K. and H.J. Wang (2005a). Procyclical Collateral Value and Business
Investment: An Empirical Investigation of Firm Level Data. National Taiwan
University, mimeo.
Chen, N.K. and H.J. Wang (2005b). The Procyclical Leverage Effect of Collateral
Value on Bank Loans – Evidence from the Transaction Data of Taiwan. National
Taiwan University, mimeo.
DiPasquale, D. (1999). Why Don't We Know More about Housing Supply? Journal
of Real Estate Finance and Economics, 18, 1, 9-23.
Economic Research Department of the Central Bank of China (2001). Financial
Statistics Monthly Taiwan District Republic of China, Taiwan: Taipei.
Fazzari, S.M.; R.G. Hubbard and B.C. Peterson (1988). Financing Constraints and Corporate Investment. Brookings papers on Economic Activity, 141-195.