行政院國家科學委員會專題研究計畫 成果報告
論”入世” 前後中國保險業之清償能力及組織結構對效率
之影響
計畫類別: 個別型計畫 計畫編號: NSC92-2416-H-004-041- 執行期間: 92 年 08 月 01 日至 93 年 07 月 31 日 執行單位: 國立政治大學風險管理與保險學系 計畫主持人: 鄭士卿 報告類型: 精簡報告 處理方式: 本計畫可公開查詢中 華 民 國 93 年 11 月 11 日
Solvency, Organizational Structure, and Efficiency of Insurance Industry in China: Pre- and post-WTO
ABSTRACT
This paper examines the efficiency performance of Chinese insurance industry in the period of 1996-2000. It is the first paper to use the input/output efficiency method to measure the efficiency of Chinese insurance industry. We apply data envelopment analysis (DEA)
methodology to measure the efficiency in this paper, and both the value-added approach and the financial intermediary approach of DEA are examined. Using the value-added approach, we find that state-owned insurers are more efficient than stock insurers prior to China’s entry into WTO. Our results imply that state-owned firms have enjoyed lots of resources for a long time and thus possess advantages in the market. A further analysis of financial intermediary
approach shows that the privilege of state-owned insurers is jeopardized by their current financial conditions. Such disadvantage may put the state-owned firms at risk and may change the structure of the Chinese insurance industry in the near future. Besides, a comparison between composite and specialized firms implies that Chinese regulatory authority may adjust its speed in the transformation of business diversification.
Keywords: Solvency, Efficiency, China, WTO, Organizational Structure
摘要
本文探討中國保險業自 1996 至 2000 年間的效率表現,並首次以投入/產出的衡量方法研究 中國保險業的效率。本研究利用資料包絡分析法 (Data Envelopment Analysis, DEA)衡量公 司的技術效率及組成技術效率的兩項因子,並同時利用附加價值法及金融仲介法來定義保 險業的投入及產出。作者以傳統的附加價值法來分析,發現國有獨資機構較其他本國公司 有效率,顯示國有公司長久以來獨占的優勢亦反映在公司的運作效率上。但若考慮公司的 清償能力,則發現國有公司弱勢的財務狀況完全抵消了原有的效率優勢,證明清償能力問 題在中國保險業的嚴重性。作者亦發現業務多元化的程度並未改善公司的效率,也間接懷 疑中國保險監理機構實行產.壽險分業經營的合理性。 關鍵詞: 清償能力,效率,中國,世貿組織,組織結構
Solvency, Organizational Structure, and Efficiency of Insurance Industry in China: Pre- and post-WTO
I. Introduction and Literature Review
The development of the insurance industry in the China is still in the rising stage compared with most of the developed countries. As a result of China’s substantial economic growth, increased public awareness of insurance protection and more, the insurance market in China has evolved dramatically in recent years. China’s insurance market has been growing at an average annual rate of 27 percent since 1980. Medium-term growth estimates indicate that China’s total insurance premium would risk from US$19.2 billion in year 2000 to US$33.7 billion in year 2005, according to the China Insurance Regulatory Commission (CIRC).
Although Chinese insurance industry is expected to keep its strong growth, China’s entry into the WTO will significantly affect the development in Chinese insurance sectors, including the efficiency of the firms, the degree of competition and, specifically, the solvency regulation. Chinese domestic insurers are encountered with serious solvency problem (Ma, 1999, and Hu, 2001). The Chinese insurers, especially those state-owned insurers, have been protected by Chinese government for a long time, enjoy broad resources and have little idea of how the solvency might affect their performances (Chang, 1999). This fact is further jeopardized by the lacking of knowledge and expertise in the solvency regulation of Chinese government. It is believed that the development of the related regulation, solvency, and reporting standards of the industry is far away from the development of the insurance market in China (Wong, 2002). Without considering the solvency issue, the performance of the domestic insurers may seem adequate, but their performance can be seriously harmed when solvency is taken into consideration. A recent report shows that the insolvency of Chinese domestic insurers has amounted to 7.45 billion RMB and the insolvency ratio is 32.69% in 1997 (Ma ,1999).
While the development of the Chinese insurance market has received a lot of attention in academics as well as in practice, only one study has examined the performance of Chinese insurance industry in the past. Hu (2001) examines the revenue and cost efficiency of Chinese insurers over the period of 1996-1999 using some financial ratios of insurance companies. He finds that the behavior of large insurance companies (mainly state-owned insurers) was not fully competitive as compared to the behavior of small insurance companies. While Hu (2001) measures the performance of the firms using variables such as return on premium or return on asset only, our paper adopts the data envelopment analysis (DEA), a non-linear programming technique to evaluate the efficiency of the Chinese insurers. By applying to
multiple-input/output operations, we believe DEA is a better method to measure the efficiency of our sample firms in Chinese insurance industry. The data period we use is between 1996 and 2000. We analyze the domestic and foreign insurers separately as the tax treatment and law
regulation are all different for domestic and foreign insurers.
II. Purpose
This paper tries to address the following three issues. First, by using the value-added
approach, we examine whether the issue of organizational structure affects the efficiency of firms. We intend to study whether the state-owned insurers are more efficient than other domestic
insurers (i.e. stock insurers) prior to the entry of WTO. Second, we use the financial
intermediary approach to study the impact of solvency situation on the efficiency of our sample firms. We expect to find the efficiency of the domestic insurers with strong solvency problems to decrease significantly after we consider the solvency situation of the firm. Finally, we examine whether the level of business diversification affects the efficiency of the firms by comparing the efficiency of composite insurers with the specialized insurers. Our results can provide policy indication to the Chinese regulatory authority in many ways including the importance of solvency regulation and the suitability of diversified operations.
III. Data and Methodology
The data used in this paper are drawn from the Chinese Insurance Yearbook from 1996 through 2000, which are complied by an institution related to China Insurance Regulatory
Commission (CIRC) and include the regulatory annual statement filed by insurers with the CIRC. Because all insurers are required to report to CIRC, our database consists of virtually the entire industry. At the end of 2000, there are thirty insurers in China, twelve are domestic insurers and eighteen are foreign insurers. Table 1 shows the characteristics of domestic insurers in Chinese insurance industry in detail. As we described above, among the twelve domestic insurers, three are the so-called “composite” insurers, and three as well are the state-owned insurers. Besides, seven out of twelve insurers operate nationally while the rest operate in specific regions. These characteristics may result in differences in firm efficiency and performance.
[Table 1 about here]
We use two approaches in data envelopment analysis (DEA) to measure outputs and inputs: the value-added approach and the financial intermediary approach. The value-added approach states that all the financial variables with substantial value added are employed as the important outputs (see Berger & Humphrey, 1992). On the other hand, the second approach views an insurance company as a financial intermediary, and the objective of establishing an insurance firm is to 1) maximize the return on capital and maximize the value of the firm and 2) ensure the financial conditions of the firm represented by paying ability and solvency. In our paper, we examine the efficiency of firms by adopting both approaches. We use value-added approach to examine the efficiency when we do not consider solvency for our sample firms, and we use financial intermediary approach to examine the efficiency when we want to see the solvency effect on firm’s efficiency performance. Through our analysis, we intend to see whether the
solvency of the firm affects the efficiency of our sample firms or not.
IV. Results and Conclusion
Table 2 examines the inputs and outputs used in this paper. Panel A examines the descriptive statistics of inputs, including the numbers by all years and by individual years. Panel B examines the descriptive statistics of outputs by reporting outputs in two different methods. We find in Panel A that the size and scale of Chinese insurers deviate a lot from each other as the standard deviation of the inputs is relatively large. We also find that all the inputs have increased substantially by year. In addition, the results in Panel B show that the outputs in both approaches are either stable or grow gradually throughout the sample years. In summary, the inputs/outputs in our analysis show that the Chinese insurance industry is growing at a stable speed in year 1998 to 2000.
[Table 2 about here]
Table 3 examines the efficiency differences between state-owned and stock insurers by two different methods. As the state-owned insurers have enjoyed huge resources in the market for a long time, we predict that by using value-added method, state-owned insurers are more efficient than firms otherwise comparable. However, by using financial intermediary method, we expect to find the efficiency of the domestic insurers with strong solvency problems to decrease
significantly, which in consensus are the state-owned insurers. We consider three efficiency measures: technical efficiency (TE), pure technical efficiency (PTE) and scale efficiency (SE). Panel A reports the results by using value-added method. We find that same as our prediction, all the efficiency measures (TE, PTE and SE) are higher for state-owned insurers than for stock insurers, although the differences are not significant. This is possibly because the number of observations in our data set is small. Panel B of Table 3 reports the results by using the financial intermediary method. Opposite to the results in Panel A, we find that the state-owned insurers are less efficient than stock insurers in all three measures, and the differences are significant.
[Table 3 about here]
One of our purposes in this paper is to examine whether the state-owned insurers are more efficient than other domestic insurers prior to the entry of WTO by adopting two different approaches. However, if we look back at Table 1, we find that domestic insurers in China possess a few characteristics, including differences in business diversification, organizational structure (state-owned vs. stock), and geographic location (nationally vs. regionally). For robustness check, we reexamine the results in Table 3 by controlling other factors. In other words, we examine the efficiency performances between state-owned and stock firms in four different versions by controlling both business diversification and geographic location1. We find
1 In the first version we consider firms which are specialized and operate nationally only, and in the second version
that the results in four versions are completely consistent with our results in Table 3. We thus claim that our results are robust after considering alternative effects.
We summarize our results as following. We find that the issue of organizational structure affects the efficiency of firms. By using the value-added approach, we find that state-owned insurers are more efficient than stock insurers prior to China’s entry into WTO. Although the results are not significant, they provide a clear picture on the development of Chinese insurance industry in that state-owned firms have enjoyed lots of resources for a long time and thus possess advantages in the market. However, further analysis of financial intermediary approach shows that the privilege of state-owned insurers is jeopardized by their current financial conditions. As China has formally entered into the WTO in 2000, these state-owned insurers are sure to
encounter more keen competition in the market. This hole in their operation is sure to put the state-owned firms at risk and may change the structure of the Chinese insurance industry in the near future.
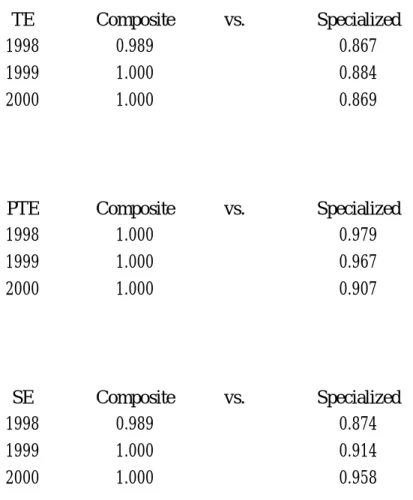
Finally, Table 4 examines the results between specialized and composite firms. We examine the results using value-added method in Table 4 only as the results of using financial intermediary method are nearly the same. Our results clearly show that composite firms are more efficient than the specialized firms in all three efficiency measures, although the differences are not significant. We thus suggest that from the efficiency viewpoint, the requirement of “focusing on one side of business only” in China is not at immediate need using the data of 1998 to 2000. A robustness check shows that the results are consistent with Table 4 when we control factors such as organizational structure and geographic location.
[Table 4 about here]
V. 計畫結果自評部份 本研究針對原計畫所述三項疑問加以分析,並就分析結果對中國保險監理機構的政策 走向提出建議。作者所提出的兩項建議如下: 第一,監理機關對中國保險業清償能力的監 管工作刻不容緩。第二,中國保險監理機構鼓勵產壽險分業經營的合理性似乎有待商確。 此外,對於學術界長久以來在保險業效率分析中對投入 產出的衡量方法的爭論,本研究 可提出不同的見解。本研究已於 2003 年 8 月發表於全美風險管理與保險年會(ARIA Annual Conference, Denver, CO USA),並即將於近期內投稿至適合的學術期刊發表,相信未來發 表的機會和價值極高。
References
Berger, Allen N., and David B. Humphrey, 1992, “Measurement and Efficiency Issues in Commercial Banking,” in Z. Griliches, ed., Output Measurement in the Service Sectors, National Bureau of Economic Research, Studies in Income and Wealth, Vol.56, University of Chicago Press: 245-279.
Brockett, Patrick L., Cooper, William W., Golden, Linda L., Rousseau, John J., Wang, Yuying Wang, 2000, Working paper, University of Texas, at Austin.
Chang, WeiYing, 1999, “The Solvency Issue in Chinese Financial Service Industry”, Capital
Market 1. (Chinese)
Chinese Insurance Yearbook, various issues, Beijing, China.
Coelli, Tim, 1996, “A Guide to DEAP Version 2.1: A Data Envelopment Analysis Program”, Working Paper, University of New England, Armidale, Australia.
Cummins, J. David, and Mary A. Weiss, 2000, “Analyzing Firm Performance in the Insurance Industry Using Frontier Efficiency and Productivity Methods,” Handbook of Insurance, edited by Georges Dionne, Kluwer Academic Publishers, 767-829.
Cummins, J David, Weiss, Mary A, Zi, Hongmin, 1999, “Organizational form and efficiency: The coexistence of stock and mutual property-liability insurers,” Management Science 45: 1254-1269.
Cummins, J. David, and Zi, Hongmin, 1998, ”Measuring Economic Efficiency of the U.S. Life Insurance Industry: Econometric and Mathematical Programming Techniques, Journal of
Productivity Analysis 10: 131-152.
Färe, R., S. Grosskopf, M. Norris and Z. Zhang, 1994,”Productivity Growth, Technical Progress, and Efficiency Change in Industrialized Countries,” American Economic Review 1994: 66-83.
Fare, R., Grosskopf, S., 1992, “Malmquist Productivity Indexes and Fisher Ideal Indexes,” The
Economic Journal 102: 158-175.
Färe, R., S. Grosskopf, and C. A. K. Lovell, 1985. The Measurement of Efficiency of Production. (Boston: Kluwer-Nijhoff).
Farrell, M. J., 1957, “The Measurement of Productive Efficiency,” Journal of the Royal
Statistical Society 120: 253-281.
Fecher, F., D. Kessler, S. Perelman, and P. Pestieau, 1993, “Productive Performance of the French Insurance Industry,” Journal of Productivity Analysis 4: 77-93.
Hu, Kun, 2001, “Competition, Market Structure and Efficiency in Chinese Insurance Sectors on the eve of WTO: An Empirical Investigation,” Working Paper, Fudan University, Shanghai, China.
Ma, Peter, 1999, “Challenging the Competition”, China Commercial Publishing House, Beijing. (Chinese)
Wong, Johnny, 2002, “A Comparison of Solvency Requirements and Early Warning Systems for Life Insurance Companies in China with Representative World Practices,” North American
Table 1 The Characteristics of Chinese Insurance Industry
Table 1 reports the characteristics of Chinese insurance industry in details.
English Chinese Property/Life National State-Owned Year Name Name /Regional /Stock Founded
PICC 中國人民 Property National State-Owned 1949
China Life 中國人壽 Life National State-Owned 1982
China Pacific 太平洋 Life and Property National Stock 1991
China Ping An 平安 Life and Property National Stock 1988
Hua Tai Life 華泰 Property National Stock 1996
Xinjiang Corps 新彊 Life and Property Regional State-Owned 1986
Tian An 天安 Property Regional Stock 1994
Da Zhong 大眾 Property Regional Stock 1995
Yong An Property 永安 Property Regional Stock 1996
Sinosafe General 華安 Property Regional Stock 1996
New China Life 新華 Life National Stock 1996
Table 2: Inputs/Outputs in Chinese Insurance Industry
Note: X1= Underwriting Expenses X2= Policyholder Surplus Capital X3= Debt Capital
In Value-added approach, Y1= Benefits Paid
Y2= Total Invested Assets In financial intermediary approach, Y1= Return on Assets
Y2= Principal Component 1 of financial conditions Y3= Principal Component 2 of financial conditions
Panel A: Inputs total
Variable Mean Std Dev Minimum Maximum
x1 3045.24 5014.59 14.19 14461.00
x2 3884.11 10032.58 228.46 59418.00
x3 17910.51 35953.65 30.51 152679.49
by year
Year Variable Mean Std Dev Minimum Maximum
1998 x1 2765.88 4829.59 14.19 13645.93 x2 2103.37 2634.23 228.46 8708.70 x3 14188.49 27037.30 30.51 91658.05 1999 x1 2939.99 5097.54 24.10 14307.45 x2 2254.02 2850.52 232.99 9305.70 x3 18775.31 36587.27 88.84 126246.02 2000 x1 3464.82 5563.77 19.75 14461.00 x2 7605.01 17419.09 312.83 59418.00 x3 21027.48 45719.20 170.52 152679.49
Panel B: Outputs
Value-added Approach total
Variable Mean Std Dev Minimum Maximum
y1 5119.57 8534.30 14.50 25099.00
y2 7187.00 15502.69 41.42 72254.89
by year
Year Variable Mean Std Dev Minimum Maximum
1998 y1 5075.40 8877.91 14.56 25099.00 y2 5265.08 9360.21 49.20 31524.14 1999 y1 4936.29 8429.16 14.50 24249.00 y2 7878.08 15387.63 41.42 52023.26 2000 y1 5367.70 9092.36 24.78 24887.00 y2 8529.72 21291.13 49.72 72254.89
Finanial Intermediary Approach total
Variable Mean Std Dev Minimum Maximum
y1 0.017 0.012 0.001 0.044
y2 1.347 1.276 0.462 6.371
y3 0.709 0.801 0.001 2.779
by year
Year Variable Mean Std Dev Minimum Maximum
1999 y1 0.018 0.011 0.001 0.031 y2 1.535 1.750 0.479 6.371 y3 0.400 0.279 0.001 0.953 2000 y1 0.017 0.013 0.001 0.044 y2 1.159 0.545 0.462 1.983 y3 1.018 1.032 0.001 2.779
Table3: Results between state-owned and stock insurers
Panel A: Value-Added Result
TE State-Owned vs. Stock
1998 1.000 0.849
1999 1.000 0.869
2000 1.000 0.852
PTE State-Owned vs. Stock
1998 1.000 0.976 1999 1.000 0.963 2000 1.000 0.895 SE State-Owned vs. Stock 1998 1.000 0.857 1999 1.000 0.904 2000 1.000 0.953
Panel B: Financial Intermediary Result
TE State-Owned vs. Stock
1999 0.060 ** 0.557
2000 0.021 ** 0.603
PTE State-Owned vs. Stock
1999 0.722 0.766 2000 0.043 ** 0.633 SE State-Owned vs. Stock 1999 0.114 ** 0.724 2000 0.504 * 0.852
*** shows statistically significant difference at 1% level ** shows statistically significant difference at 5% level * shows statistically significant difference at 10% level
Table 4: Results between composite and specialized insurers
Note: The results are calculated using value-Added method.
TE Composite vs. Specialized
1998 0.989 0.867
1999 1.000 0.884
2000 1.000 0.869
PTE Composite vs. Specialized
1998 1.000 0.979 1999 1.000 0.967 2000 1.000 0.907 SE Composite vs. Specialized 1998 0.989 0.874 1999 1.000 0.914 2000 1.000 0.958