Reaction Dynamics of O(
1D,
3P) + OCS Studied with Time-Resolved Fourier Transform
Infrared Spectroscopy and Quantum Chemical Calculations
†Hung-Chu Chiang, Niann-Shiah Wang, and Soji Tsuchiya*
Department of Applied Chemistry and Institute of Molecular Science, National Chiao Tung UniVersity, Hsinchu 30010, Taiwan
Hsin-Tsung Chen
National Center for High-Performance Computing, No. 28, Nan-Ke Third Road, Hsin-Shi, Tainan, 74147, Taiwan
Yuan-Pern Lee*
Department of Applied Chemistry and Institute of Molecular Science, National Chiao Tung UniVersity, Hsinchu 30010, Taiwan, and Institute of Atomic and Molecular Sciences, Academia Sinica, Taipei 10617, Taiwan
M. C. Lin*
Department of Applied Chemistry and Institute of Molecular Science, National Chiao Tung UniVersity, Hsinchu 30010, Taiwan, and Department of Chemistry, Emory UniVersity, Atlanta, Georgia 30322
ReceiVed: April 30, 2009; ReVised Manuscript ReceiVed: June 4, 2009
Time-resolved infrared emission of CO2and OCS was observed in reactions O(3P) + OCS and O(1D) + OCS with a step-scan Fourier transform spectrometer. The CO2 emission involves ∆ν3 ) -1 transitions from highly vibrationally excited states, whereas emission of OCS is mainly from the transition (0, 0°, 1) f (0, 0°, 0); the latter derives its energy via near-resonant V-V energy transfer from highly excited CO2. Rotationally resolved emission lines of CO (V e 4 and J e 30) were also observed in the reaction O(1D) + OCS. For O(3P) + OCS, weak emission of CO
2 diminishes when Ar is added, indicating that O(3P) is translationally hot to overcome the barrier for CO2formation. The band contour of CO2agrees with a band shape simulated on the basis of a Dunham expansion model of CO2; the average vibrational energy of CO2 in this channel is 49% of the available energy. This vibrational distribution fits with that estimated through a statistical partitioning of energy E* = 18 000 ( 500 cm-1 into all vibrational modes of CO2. For the reaction of O(1D) + OCS, approximately 51% of the available energy is converted into vibrational energy of CO2, and a statistical prediction using E* = 30 000 ( 500 cm-1best fits the data. The mechanisms of these reactions are also investigated with the CCSD(T)/6-311+G(3df)//B3LYP/6-311+G(3df) method. The results indicate that the triplet O(3P) + OCS(X1Σ+
) surface proceeds via direct abstraction and substitution channels with barriers of 27.6 and 36.4 kJ mol-1, respectively, to produce SO(X3Σ
-) + CO(X1Σ+
) and S(3P) + CO2(X1A1), whereas two intermediates, OSCO and SC(O)O, are formed from the singlet O(1D) + OCS(X1Σ
+ ) surface without barrier, followed by decomposition to SO(a1∆) + CO(X1Σ+
) and S(1D) + CO 2(X1A1), respectively. For the ground-state reaction O(3P) + OCS(X1Σ+
), the singlet-triplet curve crossings play important roles in the observed kinetics and chemiluminescence.
Introduction
The reaction of oxygen atom with carbonyl sulfide (OCS) is important in atmospheric chemistry, especially in the strato-sphere in which ozone is a key constituent; the concentration of ozone is determined by a balance in a complicated photo-chemical reaction mechanism including reactions of O atoms in its electronically excited and ground states. Because OCS is relatively stable in the troposphere, it might enter the strato-sphere to undergo photodissociation or reactions with other active species. Reactions of O atoms with OCS thus play a role
in balancing the O3 concentration and the radiation in the stratosphere.1
Several kinetic studies of the reaction O(3P) + OCS have been reported; the rate coefficients are mostly in accord with recommendations by Atkinson et al., k ) 1.6 × 10⁻¹¹ exp(-17.9 kJ mol-1/RT) cm3molecule-1s-1for the temper-ature range 230-500 K,2and Singleton and Cvetanovic´, k ) 7.80 × 10⁻¹¹exp(-21.8 kJ mol-1/RT) cm3molecule-1s-1 for the temperature range 230-1900 K.3 From their discharge-flow experiments, Homann et al. proposed that of these two possible channels
†Part of the “Robert W. Field Festschrift”.
* To whom correspondence should be addressed. E-mail: sojitsuchiya@ mail.nctu.edu.tw (S.T.); [email protected] (Y.-P.L.); chemmcl@
emory.edu (M.C.L.). O(
3
P) + OCS f CO + SO (1)
10.1021/jp903976z CCC: $40.75 2009 American Chemical Society Published on Web 07/14/2009
the S-atom abstraction channel, reaction 1, dominates near room temperature.4Hsu et al. performed experiments with18O(3P) at 298 K and found no product of C18O, supporting the fact that the reaction proceeds via direct S-atom abstraction.5At temperatures above 1000 K, reaction 2 becomes important. Isshiki et al.6directly observed the time-dependent concentrations of both O and S atoms upon pulsed UV photolysis of mixtures of OCS and SO2behind shock waves and determined rate coefficients of these two channels that yield a branching fraction of reaction 2 to be expressed as (0.40 ( 0.10) - (202 ( 137)/T in the temperature range of 1120-1540 K. They also performed quantum chemical calculations on this system with G2M(CC1) and CCSD-based G3 methods. The rate coefficients they derived by using transition-state theory (TST) with Wigner tunneling corrections are much smaller than experimental values; in contrast, the predicted branching ratios are similar to experimental values.
Rochford et al. performed crossed molecular beam experi-ments on O(3
P) + OCS f SO + CO and found that the fraction of translational energy is∼30% of the available energy.7They proposed that the cone-shaped scattering of SO arises from direct dissociation of an early transition state that is formed by a broadside approach of the O atom to the S atom of the OCS molecule; the reaction occurs over a triplet potential energy surface (PES) involving planar cis or trans bent intermediates; an extensive product rotational excitation is consequently expected. Shortridge and Lin employed resonance absorption with a CO laser to detect the vibrational population of CO product from mixtures of NO2/OCS/SF6upon UV (λ> 300 nm) photolysis and reported CO (V e 4) with a vibrational temper-ature of 9500 K, corresponding to 11% of the available energy.8 In contrast, Nickolaisen et al. investigated the reaction O(3P) +OCS with photolysis of mixtures of NO2and OCS at 355 nm and detected CO product with a tunable IR laser. They observed CO in levels only V ) 0 and 1 with a ratio [CO(V ) 1)]/[CO(V ) 0)] = 0.05, whereas CO is rotationally excited with a temperature of 4400 K.9Their results indicate a mechanism of direct attack of O(3P) at the S atom of OCS, followed by rapid C-S bond scission that exerts a large torque on the CO fragment. Chen et al. employed laser-induced fluorescence to determine the internal state distribution of SO(X3Σ-) from the reaction O(3P) + OCS and found that the SO product is highly vibrationally excited (V e 9) with an inverted state distribution showing a maximum at V ) 5.10 The total internal energy amounts to about 50% of the available energy, with 26.0 and 8.1% converted to vibration and rotation of SO, and 0.6 and 15.7% to vibration and rotation of CO, respectively. This distribution was explained with a Franck-Condon model based on a mechanism of sudden separation of SO from the collision intermediate OSCO.11
The reaction of O(1D) + OCS is little studied. Gauthier and Snelling reported the rate coefficient to be 3.0 × 10⁻¹⁰ cm3 molecule-1s-1at 300 K.12The electronically excited state O(1D2) is located 15 867.86 cm-1 above the ground state O(3P2).13 Previously,14the authors reported that in the quenching reaction of O(1D) by CO2, which proceeds through a collision complex CO3, the product CO2is highly vibrationally excited, with 44 and 5% of the available energy converted to vibrational and rotational degrees of freedom of product CO2, respectively. OCS is isoelectronic with CO2, but the bond energy of CdS is much smaller than that of CdO; consequently, in addition to the quenching reaction
two reaction channels might occur
Jones and Taube irradiated an O3/OCS/Ar matrix with UV light and observed CO, CO2, SO2, and SO3 as products, indicating the existence of both reactions 4 and 5.15They also performed experiments with 18O3/16OCS/Ar and 16O3/18OCS/ Ar and observed the CO product with only C16O and C18O, respectively, indicating that the oxygen atom of CO comes from OCS, not from O(1D). In contrast, Jaeger et al. performed similar matrix experiments and reported that reaction 5 is major; some S atom product is further oxidized to SO2, SO3, and SO4.16Their 18O3/16OCS experiments lead to the formation of S18O2 and 16OC18O, supporting the proposed mechanism. To investigate the gaseous reaction of O(1D) + OCS, Shortridge and Lin applied resonance absorption of CO laser emission to determine the vibrational population of CO produced upon UV (λ> 215 nm) photolysis of mixtures of O3/OCS/SF6; CO (V e 9) with vibrational temperature of 3300 K, corresponding to 4% of the available reaction energy, was reported.8
Froese et al. calculated a single-point energy with full fourth-order Møller-Plesset perturbation theory (MP4SDTQ) on structures optimized with second-order Møller-Plesset (MP2) for the singlet and triplet PES of the SCO2system.17They found that the singlet complexes are more stable than the triplet complexes and proposed that reaction 1 might proceed on the singlet surface; multiple intersystem crossings are required to connect ground-state reactants to products because both have triplet multiplicity.
No report regarding the quenching by OCS of O(1D) to O(3P), reaction 3, is available. For the reaction O(3P) + OCS, no experimental information is available on the reaction channel for the production of CO2 + S, and the reported internal distributions of CO have large uncertainties. For the reaction O(1D) + OCS, the dynamics of the channel CO2+ S are also unreported. Here we present observations of the time-resolved IR emission spectra of product molecules CO and CO2of the reactions O(1D,3P) + OCS. The nascent distributions of internal states of these product molecules are derived and compared with those calculated assuming a statistical partitioning of the reaction energy into internal degrees of freedom of the product mol-ecules. Furthermore, to understand the reaction mechanisms further, we performed high-level quantum chemical calculations on this system including the singlet-triplet crossing points with the CCSD(T)/6-311+G(3df)//B3LYP/6-311+G(3df) methods. Experiments
The apparatus employed to obtain step-scan time-resolved Fourier transform spectra (TR-FTS) has been previously described;18-20only a summary is given here. A telescope mildly focused the photolysis beam from a KrF laser (248 nm, 23 Hz, ∼50 mJ) to an area ∼9 × 10 mm2 at the reaction center to yield a fluence of∼50 mJ cm-2; this laser beam decomposes O3to form O(1D). For the reaction O(3P) + OCS, the KrF laser was replaced by an ArF laser (193 nm, 23 Hz, ∼20 mJ) that decomposes SO2to produce O(3P); the laser beam was focused to an area∼4 × 8 mm2at the reaction center to yield a fluence
O(3P) + OCS f CO2+ S (2) O(
1
D) + OCS f O(3P) + OCS (3)
O(1D) + OCS f CO + SO (4) O(1D) + OCS f CO2+ S (5)
of∼67 mJ cm-2. The transient signal from an InSb detector equipped with a preamplifier (Kolmar Technologies, rise time 0.34 µs and responsivity 3.2× 10⁶VW-1) was further amplified with a factor of 5-50 (Stanford Research Systems, model 560, bandwidth 1 MHz) before being digitized with an internal data acquisition board (12-bit) at 25 ns resolution. Data were typically averaged over 60 laser pulses at each scan step; 497 scan steps were performed to yield an interferogram resulting in spectra of resolution 4.0 cm-1for CO2 detection. For CO detection, 4881 scan steps were performed to yield spectra with a spectral range 1800-2360 cm-1at resolution of 0.3 cm-1. The temporal response function of the instrument was determined with a pulsed IR laser beam, as described previously.21 The spectral response function was calibrated using a blackbody radiation source.
For experiments on O(3P) + OCS, approximately 30% of SO2was dissociated upon irradiation at 193 nm on the basis of the reported absorption cross section of 3.7 × 10⁻¹⁸ cm2 molecule-1for SO2at 193 nm.22Partial pressures were: PSO
2) 0.080 to 0.090 Torr, POCS) 0.090 to 0.100 Torr, and PAr) 0 to 1 Torr. Flow rates were FSO2) 2.0 to 2.3 sccm, FOCS) 2.0 to 2.5 sccm, and FAr) 0 to 25 sccm; sccm denotes 1 cm3min-1 under standard conditions (273.15 K and 760 Torr). The absorption cross section of OCS at 193 nm is 1.8× 10⁻²⁰cm2 molecule-1.23
For experiments on O(1D) + OCS, ozone (O3) and OCS were injected separately into the reaction chamber. To decrease the collision quenching of CO2and CO, a minimal pressure yielding acceptable signals was used: PO3) 0.016 to 0.069 Torr, POCS ) 0.018 to 0.087 Torr, and PAr) 0 to 1.5 Torr. Flow rates were FO3) 1.0 to 2.4 sccm, FOCS) 0.6 to 3.0 sccm, and FAr ) 0 to 70.0 sccm. Approximately 60% of O3was dissociated upon irradiation at 248 nm on the basis of the reported absorption cross section of 1.15 × 10⁻¹⁷ cm2molecule-1 for O3at 248 nm.24The depletion of O3in the flowing system after each laser pulse was modest, as was confirmed by the negligible variation of the signal intensity when we varied the repetition rate of the photolysis laser from 20 to 30 Hz. To minimize quenching of the produced O(1D) to O(3P) by collisions with O3, of which the rate coefficient is comparable to that with OCS, the molar fraction of O3 in the OCS + O3 mixture was maintained at less than 30%, except for experiments to detect product CO in which the fraction of O3was∼60%.
SO2(AGA Gas, 99.98%) and Ar (Linde Gas, 99.995%) were employed without further purification, and OCS (Linde, 98%) was purified upon being passed through a trap filled with molecule sieve 3A (Ridel-deHe¨n). Impurities such as CO2and CS2were monitored with IR absorption in a 10 cm cell filled with OCS at 8 Torr; and no absorption other than OCS was observed. O3 was produced from O2(Scott Specialty Gases, 99.995%) with an ozone generator (Polymetrics, model T-408) and stored over silica gel at 196 K. The partial pressure of O3 was determined from the absorption of Hg emission at 254 nm in a cell of length 7.0 cm; the absorption cross section of O3at 254 nm was taken to be 1.15× 10⁻¹⁷cm2.25
Computational Methods
Geometries of reactants, products, intermediates, and transition states on the PESs of the O(3P,1D) + OCS reaction were optimized with B3LYP/6-311+G(3df) density functional theory (DFT).26The vibrational wavenumbers were calculated at this level to characterize local minima and transition state and corrections of zero-point energy (ZPE). To obtain reliable energies and rate coefficient predictions, we calculated
single-point energies at level CCSD(T)/6-311+G(3df) on the basis of the structures at the B3LYP/6-311+G(3df), expressed as CCSD(T)/6-311+G(3df)//B3LYP/6-311+G(3df). Calcula-tions of the intrinsic reaction coordinate (IRC)26 were performed to connect each transition state with designated reactants and products. All calculations of electronic structure were performed with the Gaussian 03 program.27For points of the surface intersection (MSX), their geometry was located using the state-averaged complete active space self-consistent field (CASSCF)28 method with the 6-311+G(3df) basis set. The default value, six electrons in six active orbitals, in the Gaussian program was used for the CASSCF calculations; the active space is defined assuming that the electrons come from the highest occupied orbitals in the initially guessed determinant and that the remaining orbitals required for the active space come from the lowest virtual orbitals of the initial guess. The vibrational wave numbers of the intersection point are calculated at the B3LYP/6-311+G(3df) level on the singlet surface. The number of imaginary frequencies (NIMG) with NIMG ) 1 was obtained, indicating that the MSX has transition-state characteristics. An MSX between singlet and triplet PES is treated as a transition state for the adiabatic reaction in our estimation of the rate coefficient for the ground-state reaction to which we later allude. Results and Discussion
A. Infrared Emission from the O(3P) + OCS System.
Observed time-resolved IR emission spectra from the reaction O(3P) + OCS, in which O(3P) was produced upon photodis-sociation of SO2 at 193 nm, are shown in Figure 1. Two weak emission bands are identified in the region 1800-2360 cm-1. The broadband with maximum intensity near 2200 cm-1and a full width at half-maximum (fwhm) of 130 cm-1 Figure 1. Time-resolved emission spectra observed upon irradiation
at 193 nm of a mixture containing SO2(0.080 Torr) and OCS (0.100
Torr). Each spectrum is obtained upon integration at 10 µs intervals with delays of (a) 0, (b) 10, (c) 150, and (d) 300 µs. (e) Emission spectrum of SO2 (0.080 Torr) irradiated at 193 nm. Spectral
resolution is 4 cm-1, and the fluence of the photolysis laser is∼43 mJ cm-2.
in the early stage of reaction is assigned to emission from CO2 in its asymmetric stretching (ν3) mode; its intensity decreases in a later stage. In contrast, the band near 2060 cm-1that gained intensity gradually and reached its maximum near 150 µs after reaction is assigned to the emission of OCS in its CO stretching (ν3) mode.
1. CO2Emission. The CO2band is similar to that observed
in the reaction of O(1D) + CO2with a maximum near 2250 cm-1.14This band is due to the ∆ν3) -1 transition of CO2 in internally excited states; the maximum wavenumber of this band is smaller than that of the ν3 fundamental band because of the anharmonic couplings among ν1, ν2, and ν3 modes. As CO2is gradually deactivated by collisions with surrounding atoms and molecules, the intensity of the CO2 emission diminishes and the band shifts toward a larger wavenumber, as indicated in Figure 1c,d. A weak shoulder is also observed near 2280 cm-1; this feature is attributed to an emission of SO2that is excited by irradiation at 193 nm, as was confirmed upon observation of this emission when only SO2was present, as shown in Figure 1e, in which the overtone bands of SO(2ν) and SO2 (2ν1) were identified. Therefore, we subtracted small contributions of these features, observed under similar conditions, from the observed emis-sion band to obtain emisemis-sion spectra of CO2. In Figure 2c, the corrected emission band of CO2observed 0-10 µs after photolysis is shown. This spectrum is assumed to reflect the nascent vibrational distribution of CO2 produced from reaction of OCS with O(3P) because vibrational quenching of excited CO2is small under these experimental conditions. To analyze the observed emission band of CO2, we introduced an approximation to describe the vibrational energies with quantum number (V1, V2l, V3) using the Dunham equation14
in which parameters determined by Chedin are employed.29For highly vibrationally excited CO2, the couplings are strong among the polyads that have a common quantum number of P ) 2V1 + V2 + 3V3 because of the near-resonance of these states.30 Although the Dunham equation gives only the zeroth-order level energy, we assume that this equation can be applied to describe our observed broadband, which is composed of many transitions. The emission of vibrationally excited CO2consists of ∆V3) -1 transitions in the ν3mode, that is, (V1, V2l, V3) f (V1, V2l, V3
- 1). The frequency is represented with
The intensity of the vibrational transition is given as
in which A is the radiative transition rate that is assumed to be proportional to V3and independent of V1/V2, and po(V1,V
2l, V3) is the prior distribution of the vibrational state (V1, V2l, V3). The prior distribution for the vibrational level of CO2with energy
Evis given by the formula31
in which g(Ev) is the degeneracy of the vibrational level and
E* is the energy available for distribution. Much available
energy is partitioned into the ν1/ν2modes rather than the ν3 mode because of the large density of the stretch/bending polyad states.14
By varying the E* value, we obtained the best fit spectrum with E* ) 18 000 ( 500 cm-1, as shown in Figure 2. Trace a of Figure 2 is a stick diagram of ∆V3) -1 transitions calculated with the ν1/ν2polyad approximation14in which, for simplicity, the level energy is described with (Vbl, V3) instead of (V1,V
2l, V3); Vb is the polyad quantum number 2V1 + V2. We have confirmed that distributions of transitions of ∆V3 ) -1 calculated with this polyad approximation are essentially the same as those with (V1, V2l, V3). Trace b represents the same distribution convoluted with fwhm ) 4 cm-1; the latter provides a practical comparison of vibrational distributions with experi-mental data. The rotational contour was simulated with the PGopher program32with a constant rotational temperature for all vibrational levels and the expression B(V3) ) 0.39022 -0.00309× V3for rotational parameters and J e 150.29The final spectrum simulated with rotational distribution incorporated into Figure 2. Simulation of the observed emission band of product CO2
in the reaction O(3P) + OCS. (a) Vibrational band origins of CO 2
excited by statistical partitioning of available energy, E* ) 18 000 cm-1, (b) calculated band contour obtained on convoluting lines in part a with Gaussian functions with fwhm of 4 cm-1, and (c) comparison of the observed spectrum (thick solid line, same as Figure 1a, after correction of the overtone emission bands of SO and SO2) with the spectrum simulated on convoluting lines in part
a with rotational contours calculated for 500 K with the PGopher program (thin solid line). The shaded area indicates uncertainties ((200 K) in the rotational temperature.
G(V1,V2 l , V3) ) ω1V1+ ω2V2+ ω3V3+ x11V1 2+ x 22V2 2+ x33V32+ x12V1V2+ x13V1V3+ x23V2V3 + xlll2+ y111V1 3+ y 112V1 2V 2+ y113V1 2V 3+ y122V1V2 2 + y123V1V2V3 + y133V1V32+ y222V23+ y223V2 2V 3+ y233V2V3 2+ y 333V3 3+ y 1llV1l 2+ y 2llV2l 2+ y3llV3l2 (6) ω(V1, V2l, V3f V1, V2 l, V 3- 1) ) ω3+ x33(2V3- 1) + x13V1+ x23V2+ y333(3V3 2- 3V 3+ 1) + y113V 1 2+ y 223V2 2+ (y 113V1+ y223V2)(2V3- 1) + y3lll 2 (7) I(V1, V2 l , V3f V1, V2 l , V3- 1) ∝ ω(V1, V2 l , V3f V1, V2 l , V3 -1) × A(V1, V2l, V3f V1, V2 l, V 3- 1)p o (V1, V2l, V3) (8) po(Ev)∝ g(Ev)(E *- E v) 3/2 (9)
each vibrational transition is compared with experimental data in trace c of Figure 2. The thick line indicates the observed spectrum, and the thin line indicates a spectrum simulated with a rotational temperature of 500 K; the shaded area represents the uncertainty limits of (200 K. The experimental and simulated spectra agree satisfactorily. The band shape is mainly determined by the available energy E*; the rotational energy has only a limited effect on the band shape and has little effect on the position of the maximal intensity.
The rotational distribution might be determined inaccurately partially because the band shape is insensitive to rotational temperature and partially because the calculated vibrational term values and their transition frequencies are given as a zeroth-order approximation and the rotational parameters of the highly excited states are unknown. Because of the extremely dense vibrational transition lines, the band shape given as convoluted rotational envelopes for each vibrational transition might not depend significantly on the positions of vibrational transitions. In these experiments, O(3P) is produced upon photodisso-ciation of SO2at 193 nm. The dissociation energy of SO2to form SO(X3Σ
-) + O(3P) is 45 400 cm-1, and the excess energy given to SO and O is thus 6300 cm-1. The internal energy distribution of SO33-36and the velocity distribution of SO37,38 and O39,40upon SO2photodissociation have been reported. It is a general consensus that the vibrational population of the SO(V ) 2) level is largest and the populations for V g 4 are negligible upon photolysis of SO2at 193 nm. We use the kinetic energy determined by Brouard et al. as a representative value.40The average value of the space-fixed kinetic energy of O atom is 32 ( 11 kJ mol-1, corresponding to 2675 cm-1. In a collision of O atom with OCS, the center-of-mass kinetic energy becomes (32 ( 11)× [60/(16 + 60)] + 3.7 × [16/(16 + 60)] ) 26 ( 9 kJ mol-1(2170 ( 750 cm-1), in which 16 and 60 amu are the atomic and molecular masses of O and OCS, respectively, and 3.7 kJ mol-1is the thermal kinetic energy of OCS at room temperature. According to reaction 2, the available energy in our experiment is E* ) 227 + 26 ) 253 kJ mol-1, correspond-ing to 21 150 cm-1. If a statistical distribution in the spin-orbit states is assumed for O(3P) and S(3P), then the above value of
E* is corrected to be 21 150 + 78 - 196 ) 21 032 cm-1, in which 78 cm-1is the statistical spin-orbit energy of O(3P0,1,2) and 196 cm-1is that of S(3P0,1,2). The energies of S(3P
J) in the J ) 2, 1, and 0 states are 0, 396, and 574 cm-1, respectively; the statistically distributed S atom has an average energy of 196 cm-1above the ground J ) 2 state.
The vibrational distribution that yields the best fit with the observed band shape is obtained on the statistical partitioning of energy E* ) 18 000 ( 1000 cm-1, which is 86% of the available energy. This result is similar to the case of O(1D) + CO2f O(3P) + CO2in which the best fit of ν3emission band is obtained upon statistical partitioning of E* ) 13 000 ( 500 cm-1that is 81% of the available energy. Because the vibrational energy of product CO2in both reactions is near the statistical partitioning of the reaction energy, the reaction likely proceeds through a relatively long-lived complex O2CS or CO3in which the internal energy is nearly completely randomized.
According to the distribution of vibrational states derived from vibrational transitions depicted in Figure 2a, the observed average vibrational energy of product CO2 is 10 280 cm-1, which corresponds to∼49% of the available energy, similar to the value of 44% for the reaction O(1D) + CO2. The roughly estimated rotational temperature of 500 ( 200 K for CO2,
corresponding to <2% of the available energy, indicates that CO2has little rotational excitation, similar to the case of O(1D) + CO2.14
2. OCS Emission. The band that appears near 2060 cm-1
(Figure 1) was assigned to the emission of OCS in the CO stretching (ν3) mode. Because the position of this band does not change during observation, the emission is not from highly vibrationally excited states, as in the case of CO2emission; the emission is thus due to the vibrational transition of V3) 1 f 0. As shown in Figure 1, the intensity of this band increases in the initial stage with a rate similar to that of CO2, indicating that the source of the vibrational excitation of OCS is common to the formation of CO2. In the later stage, the band center of the CO2emission shifts toward a larger wavenumber, and its intensity decreases with a time constant of ∼75 µs, whereas the intensity of the OCS band increases toward a stationary value.
The fundamental vibrational wavenumbers for ν3of CO2and OCS differ by 287 cm-1; the collision probability of the V-V energy transfer between OCS (V3 ) 1) and CO2(V3) 1) is consequently on the order of 10-4because of a large difference in transition energies.41For highly vibrationally excited CO2, the anharmonic coupling between ν3and ν1/ν2modes decreases; however, the energy separation between V3and V3- 1 levels of CO2becomes resonant with the energy separation between the (0, 0°, 0) and (0, 0°, 1) levels of OCS
so that efficient V-V energy transfer occurs. Finzi and Moore reported intermolecular V-V energy transfer of this type;42the rate coefficients for the V-V energy transfer
were determined to be 1.2× 10⁻¹⁰ cm3molecule-1s-1, near the gas kinetic rate coefficient for collision. The observed weak emission of OCS hence comes from V-V energy transfer from highly vibrationally excited CO2 to OCS(0, 0°, 1). This phenomenon was observed more clearly in the reaction of O(1D) + OCS; the kinetic analysis will hence be given in Section C2. B. Infrared Emission from the O(3P) + OCS + Ar
System. Figure 3 shows how the emission band observed in the period 0-10 µs varies with the partial pressure of Ar buffer gas in the reaction O(3P) + OCS. The intensity of CO2emission decreased to less than half when 100 mTorr of Ar was added to a mixture of SO2 (80 mTorr) and OCS (100 mTorr) for experiments (traces a and b); it diminished to almost zero when 500 mTorr of Ar was added, as shown in trace c of Figure 3. The role of Ar is to deactivate hot atoms or molecules by collisions. The collision number of Ar atom with an excited species within 10 µs is less than 10 in our experiments under low pressure. At greater pressures, the rates of collision increase; the translational energy might be consequently deactivated efficiently to a value smaller than the barrier for the O(3P) + OCS reaction, resulting in a diminished yield of products.
When SO2is irradiated at 193 nm, translationally hot O(3P) atoms are produced to initiate their reactions with OCS, but some of them are subsequently deactivated on collisions with surrounding atoms and molecules. When all O atoms are CO2(V1,V2l,V3) + OCS(0, 00, 0) f CO2(V1,V2 l ,V3-1) + OCS(0, 0 0 , 1) (10) CO2(1, 00, 1 or 0, 20, 1) + CO2(0, 00, 0) f CO2(1, 0 0 , 0 or 0, 20, 0) + CO2(0, 0 0 , 1) (11)
quenched to have kinetic energy less than the threshold, the reaction stops. Figure 4 shows temporal profiles of integrated intensity of CO2emission for two irradiated flowing mixtures; trace a is from a mixture containing 0.088 Torr of SO2and 0.095 Torr of OCS, and trace b is from a similar mixture but with 0.092 Torr of Ar added. In trace a, the intensity of CO2reaches a steady value near 0.8 µs, whereas in trace b, this value decreases to 0.2 µs and the intensity decreases to∼40% of that of part a.
According to Abe et al.,43 the average kinetic energy in a laboratory frame of translationally hot O(3P) atoms produced from the photodissociation of SO2 in a buffer gas Q is deactivated within a few collisions in the initial stage according to the approximate equation
in which〈ELAB(t)〉 and 〈E
eq〉 are the average kinetic energies of O atoms at time t and at equilibrium, respectively, kqis the rate coefficient, and [Q] is the concentration of the quencher. In our reaction system containing SO2, SO, and OCS, the rate coefficients for deactivation of O atoms by these species are unknown. We hence used kq(Ar) ) kq(Kr) ) 1.5× 10⁻¹⁰cm3
molecule-1s-1and assume that these coefficients for SO2, SO, and OCS are the same as kq(CO2) ) 3× 10⁻¹⁰cm3molecule-1 s-1and that every collision of translationally hot O(3P) with OCS leads to the reaction. The initial average kinetic energy of O(3P) produced upon photodissociation of SO2at 193 nm is 32 ( 11 kJ mol-1in the laboratory frame. Assuming that the kinetic energy is deactivated according to eq 12, we estimated the average kinetic energy of O(3P) in the center-of-mass frame, which was 26 ( 9 kJ mol-1at t ) 0 to be 18 ( 6 kJ mol-1at 0.8 µs for the gaseous mixture employed in part a and 22 ( 7 kJ mol-1at 0.2 µs for the mixture b. The upper limit of these estimated values of 24-29 kJ mol-1might correspond to an approximate value of the barrier height for the reaction channel to form CO2because under such conditions, no further increase in CO2emission was observed; the estimates have large errors because of unknown rate coefficients of deactivation and uncertain kinetic energy distributions of O(3P) during quenching. We thus conclude that the reaction of O(3P) + OCS proceeds only with translationally hot O(3P) that has sufficient energy to overcome the barrier of the reaction. When more Ar is added to the system, the fraction of O(3P) that has sufficient energy to overcome the barrier decreases, and hence the yield of CO2 decreases.
C. Infrared Emission from the O(1D) + OCS System.
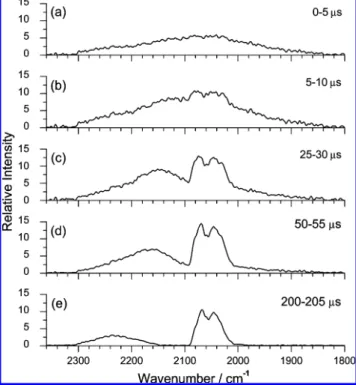
Figure 5 shows time-resolved emission spectra in the 1800-2360 cm-1region observed from a O3/OCS mixture irradiated at 248 nm. In the initial stage, only one broadband with maximal intensity near 2070 cm-1and a fwhm of 220 cm-1was observed (trace a). We assign the broadband as the ∆ν3) -1 emission of internally excited CO2, which is similar to that observed in the O(1D) + CO2(ref 14) and O(3P) + OCS systems. Compared with the emission spectra of CO2shown in Figure 1 of ref 14 and Figure 1 of this article, the band position is located at a much smaller wavenumber, indicating much more extensive vibrational excitation of CO2.
Figure 3. Emission spectra observed 0-10 µs upon irradiation at 193
nm of a mixture containing SO2(0.080 Torr), OCS (0.10 Torr), and
Ar. The partial pressure of Ar varies from (a) 0, (b) 0.10, and (c) 0.50 Torr. Spectral resolution is 2 cm-1, and the fluence of the photolysis laser is∼70 mJ cm-2.
Figure 4. Temporal profiles of the emission intensities of CO2upon
irradiation of a flowing mixture of (a) SO2(0.088 Torr) + OCS (0.095
Torr) and (b) SO2(0.088 Torr) + OCS (0.095 Torr) + Ar (0.092 Torr)
with an excimer laser at 193 nm with a fluence of 73 mJ cm-2.
〈ELAB
(t)〉 - 〈Eeq〉 〈ELAB
(t ) 0)〉 - 〈Eeq〉 ) exp(-kq[Q]t) (12)
Figure 5. Time-resolved emission spectra observed upon irradiation
at 248 nm of a mixture containing O3(0.026 Torr) and OCS (0.021
Torr). Each spectrum is obtained upon integration at 5 µs intervals with delays of (a) 0, (b) 5, (c) 25, (d) 50, and (e) 200 µs. Spectral resolution is 4 cm-1, and the fluence of the laser is∼80 mJ cm-2.
The maximum of the CO2 band shifts toward greater wavenumbers, and the width of the band decreases at a later period, as shown in traces b-e of Figure 5. In the spectrum at a reaction time of 5-10 µs (trace b), a new band centered near 2055 cm-1appears, and its intensity subsequently increases. This band consists of P and R branches and is readily assigned to the V3) 1 f 0 transition of OCS. The intensity of this band increases to attain its maximum near 80 µs. In contrast, the intensity of the CO2band diminishes continuously and more rapidly.
1. Emission of CO2. The following two reactions are
responsible for the production of vibrationally excited CO2
in which values of ∆H at 0 K are taken from the JANAF table.44 In reaction 13b, the distribution of spin-orbit states of the product S atom is expected to be statistical because the mechanism is likely similar to the reaction O(1D) + CO2in which the distribution in respective J states of O(3PJ) was reported to be nearly statistical.45
If the reaction O(1D) + OCS proceeds through a long-lived intermediate O2CS, similar to CO3in O(1D) + CO2,14then the electronic energy of O(1D) is likely partitioned statistically among the degrees of freedom of the product molecules. The distribution among the excited vibrational states of CO2was calculated under an assumption of statistical partitioning of the energy E13a* and E13b* released in reactions 13a and 13b, respectively. The initial average kinetic energy of O(1D) that is produced upon photolysis of O3at 248 nm was determined to be 36 kJ mol-1, corresponding to 3010 cm-1.46These hot O(1D) atoms are, however, rapidly deactivated with collisions with surrounding molecules. The rate coefficient for deactivation by collisions with O2is 1.5× 10⁻¹⁰cm3molecule-1s-1.47If we assume the same rate coefficient for the present system of reaction mixtures of O2and OCS, then the average space-fixed kinetic energy of O(1D) during the reaction interval of 2 µs upon photolysis of O3 is hence estimated to be 25.0 kJ mol-1, corresponding to 2341 cm-1. In the center-of-mass coordinate of the O(1D)+OCS collision, the kinetic energy is 25.0× (60/ 76) + 3.7× (16/76) ) 20.5 kJ mol-1(or 1715 cm-1), in which 3.7 kJ mol-1represents the thermal kinetic energy of OCS. The available energies to be partitioned to the products in reactions 13a and 13b are thus E13a* ) 25 580 + 1715 ) 27 295 cm-1 and E13b* ) 34 820 + 1715 - 196 ) 36 339 cm-1, respectively; the value 196 cm-1is the average spin-orbit state energy of the product S atom. If O(1D) atoms are completely thermalized, then E13a* ) 25 580 + 310 ) 25 890 cm-1and E13b* ) 34 820 + 310 - 196 ) 34 934 cm-1.
Similar to the procedures described for the reaction O (3P) + OCS in Section A, the best fit spectrum was obtained with
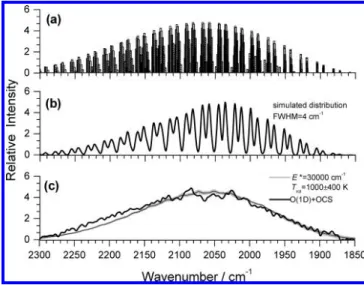
E* ) 30 000 ( 500 cm-1, as shown in Figure 6. Trace a is a stick diagram of ∆V3) -1 transitions calculated with the ν1/ν2 polyad approximation,14 and trace b represents the same distribution convoluted with fwhm ) 4 cm-1; the latter provides a practical comparison of vibrational distributions with experi-mental data. The final spectrum simulated with rotational distribution incorporated into each vibrational transition is
compared with experimental data in trace c of Figure 6. The thick line indicates the observed spectrum, and the thin line indicates the simulated spectrum with a rotational temperature of 1000 K; the shaded area represents the uncertainty limits of (400 K. The experimental and simulated spectra agree satisfactorily.
This fitted value of E* is ∼85% of the available energy, 34 934-36 339 cm-1, for the triplet channel and∼113% of the available energy, 25 890-27 295 cm-1, for the singlet channel. The former fraction (86%) is similar to the corresponding values (81 and 86%, respectively) of O(1D) + CO2and O(3P) + OCS in which the reactions proceed through a relatively long-lived complex so that the internal energy is nearly completely randomized. However, this fact does not imply that the contribution of the singlet channel is ruled out, although the triplet product channel is expected to be dominant. In our experiment, it is difficult to derive respective contributions of the singlet and triplet product channels to the observed emission band of CO2. If we assume that the reaction intermediate O2CS* is long-lived so that the reaction proceeds toward the singlet and triplet product channels statistically, then the branching ratio of the two channels may be formulated as ∑singletN(Ev)/ ∑tripletN(Ev), in which N(Ev) is the density of vibrational states
Evdetermined with statistical distribution of the available energy for each channel, as given in equation 10 of ref 14. The branching ratio thus calculated is 0.23, that is, 19% to the singlet channel and 81% to the triplet channel. A more detailed discussion on the branching between singlet and triplet channels is given in Section E2.
According to the distribution of vibrational states derived from vibrational transitions depicted in Figure 6a, the observed average vibrational energy of the product CO2is 17 830 cm-1, which corresponds to∼51% of the available energy, similar to the value of 44% for the reaction O(1D) + CO2. The roughly estimated rotational temperature of 1000 ( 400 K for CO2, corresponding to <2% of the available energy, indicates that CO2has little rotational excitation, similar to the case of O(1D) + CO2.14
Figure 6. Simulation of the observed emission band of product CO2
in the reaction O(1D) + OCS. (a) Vibrational band origins from CO 2
excited on statistical partitioning of available energy E* ) 30 000 cm-1, (b) calculated band contour obtained on convoluting lines in part a with Gaussian functions with fwhm of 4 cm-1, and (c) comparison of the observed spectrum (thick solid line, same as Figure 5a) with the spectrum simulated on convoluting lines in part a with rotational contours calculated for 1000 K with the PGopher program (thin solid line). The shaded area indicates uncertainties ((400 K) in the rotational temperature. O(1D) + OCS f CO2+ S( 1 D), ∆H ) -306.0 kJ mol-1)-25 580 cm-1 (13a) O(1D) + OCS f CO2+ S( 3 P), ∆H ) -416.5 kJ mol-1)-34 820 cm-1 (13b)
2. Emission of OCS. As shown in Figure 5, only the broad
CO2band located near 2050 cm-1appears in an early stage of the O(1D) + OCS reaction, and an additional band assigned to V3) 1 f 0 of OCS increases in intensity 15 µs after initiation of reaction, whereas the intensity of the CO2emission dimin-ishes, and its maximum shifts to a larger wavenumber. As discussed in Section A2, the excitation of OCS is due to V-V energy transfer from highly vibrationally excited CO2produced from O(1D) + OCS (reaction 10), not to quenching of O(1D) (reaction 3); the highly excited CO2molecules transfer their energy in the ν3mode to OCS as a nearly resonant process.
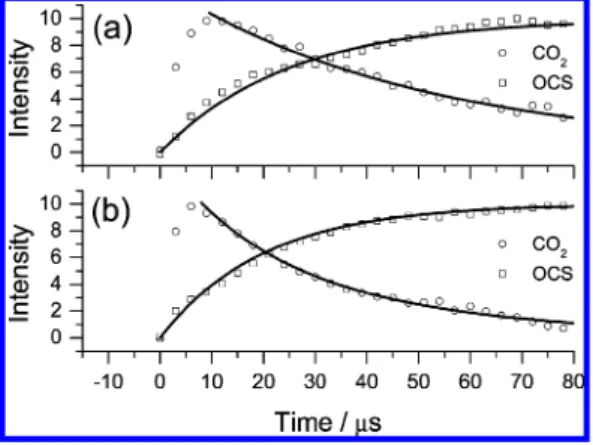
Figure 7 shows temporal profiles of the integrated emission intensities of CO2and OCS at two partial pressures of OCS. With a simple model of vibrational energy transfer, the rise of OCS and decay of CO2might be described with
in which kvvis the bimolecular rate coefficient for V-V energy transfer. The data in Figure 7 yield kvv) (3.5 ( 1.5) × 10-11 cm3molecule-1s-1; the error limit represents only the uncer-tainties in fitted values of kvv using this model. This value provides a qualitative description of the energy transfer because the present kinetic model involves several assumptions including the instant formation of excited CO2 from reaction O(1D) + OCS, no dependence of the V-V rate coefficient on the extent of the excitation of CO2, and the neglecting of the reverse V-V transfer from OCS to CO2. The large value of kvvindicates that the emission band of CO2 overlaps well with the OCS fundamental absorption so that the nearly resonant V-V transfer is efficient. In contrast, for O(3P) + OCS, the extent of the overlap is smaller because less highly internally excited CO2is produced.
An important finding is that the collision probability of the reaction involving the transfer of electronic to vibrational (E-V) energy
is small, as seen from the negligible emission of OCS in the initial stage of reaction. This observation is quite different from that for the reaction of O(1D) + CO2. Perri et al.48,49showed clearly from the18O(1D) +44CO2isotope exchange reaction in a crossed beam that only two exit channels are possible for the complex CO3*: one is the reverse reaction of O(1D) + CO2, and the other is the crossing to the triplet PES to form O(3P) and internally excited CO2. In contrast, the collision complex of O2CS* might dissociate via several channels on both singlet and triplet PESs, of which the products are located in energy regions much lower than O(3P) + OCS; the density of states in the O(3P) + OCS channel is thus negligibly small compared with those of the reaction channels.
3. Emission of CO. When the emission was recorded with
greater spectral resolution, weak emission lines were identified in the region 2000-2230 cm-1 overlapping the broad CO2 emission band, as shown in Figure 8. These emission lines are due to internally excited CO that was produced in the reaction O(1D) + OCS (reaction 4). The respective lines are assigned as the P(J) and R(J) rotational lines of the V f V - 1 vibrational transition, as marked in the upper part of the Figure. The assignments and the population analysis of these vibration-rotational transition lines of CO are described in detail elsewhere.50,51 Following this analysis of CO, the rotational distributions of CO in its respective vibrational states and the vibrational distribution are presented in Figure 9a,b, respectively. The rotational distributions are Boltzmann-like, and the rota-tional temperatures range from 520 to 810 K for V ) 3 to 1; the average rotational energy is 5.4 ( 0.5 kJ mol-1, only 2.5% of the released energy in the triplet channel and 3.8% in the singlet channel. Similarly, the vibrational distribution is also Boltzmann-like; we hence estimate the population of CO(V ) 0) by extrapolation, shown as an open circle in Figure 9b. The vibrational temperature is 5700 ( 260 K, and the average vibrational energy is 36 ( 2 kJ mol-1, corresponding to∼17% of the released energy in the triplet channel and∼26% in the singlet channel. The vibrational energy is greater than the value corresponding to 3300 K reported by Shortridge and Lin.8
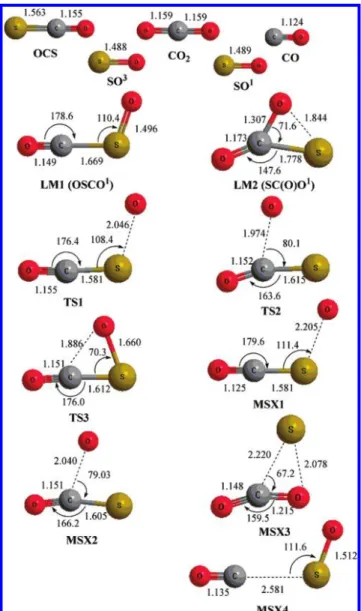
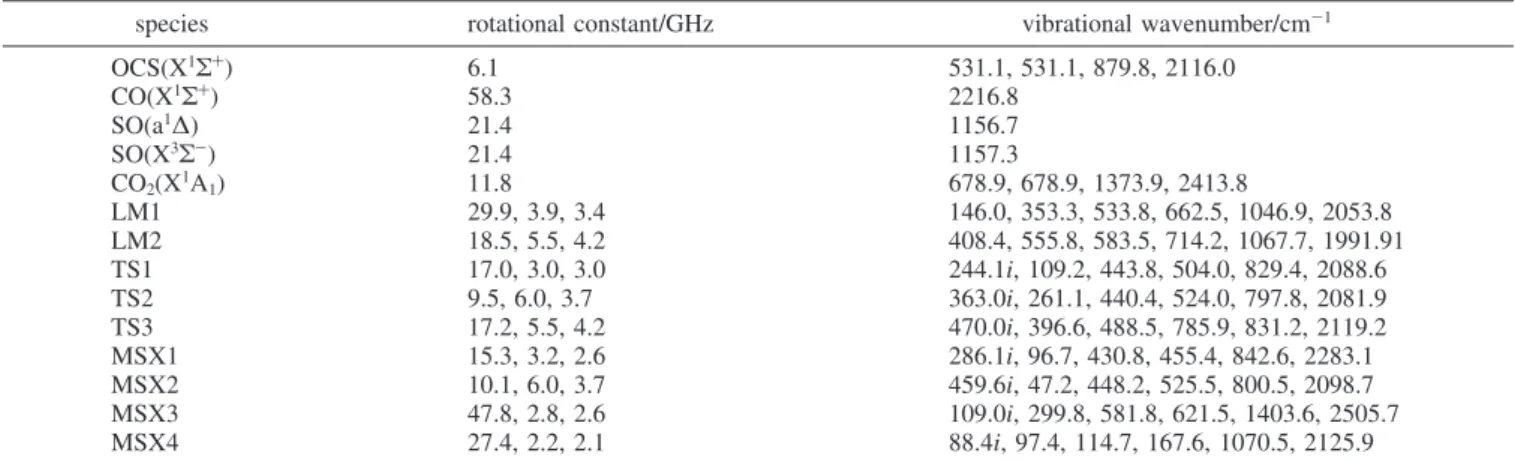
D. Reaction Mechanism and Calculated Potential Ener-gies. 1. Geometries and EnerEner-gies. The geometries of the reactants, products, intermediates (LM), and transition states (TS) involved in the singlet and triplet reactions, optimized with the B3LYP/6-311+G(3df) method, are shown in Figure 10. Vibrational wavenumbers and rotational constants for the reactants, intermediates, transition states, crossing points (MSX), and products of the O(1D,3P) + OCS reaction computed with the B3LYP/6-311+G(3df) method are listed in Table 1. The energy diagrams for singlet and triplet surfaces calculated at the CCSD(T)/6-311+G(3df)//B3LYP/6-311+G(3df) level are presented in Figure 11.
For the formation of CO(X1Σ-) + SO(X3Σ-)
the predicted enthalpies of reaction for reaction 17a is -203.3 kJ mol-1, 6.3% less exothermic than the experimental value of -217.0 kJ mol-1; the experimental values are obtained from JANAF thermochemical tables,44except for an updated value Figure 7. Temporal profiles of integrated emission of CO2and OCS
for two mixtures: (a) POCS) 0.021, PO3) 0.026 Torr and (b) POCS)
0.051, PO3) 0.022 Torr. The overlapping emission bands of CO2and
OCS were deconvoluted. Rate coefficients determined from the decay of CO2* are kVV) (a) 3 × 10-11and (b) 2× 10-11cm3molecule-1
s-1and from the rise of OCS* are kVV) (a) 6 × 10-11and (b) 3×
10-11cm3molecule-1s-1, respectively.
[OCS*] ) [CO2*]0[1 - exp(-kvv[OCS]t)] (14)
[CO2*] ) [CO2*]0exp(-kvv[OCS]t) (15)
O(1D) + OCS f O(3P) + OCS* (16)
O(3P) + OCS(X1Σ+) f CO(X1Σ+) + SO(X3Σ-),
∆H ) -217.0 kJ mol-1 (17a)
O(3P) + OCS(X1Σ+)fCO(X1Σ+) + SO(a1∆),
∆H ) -146.9 kJ mol-1 (17b)
for the energy of SO(a1∆).52For the formation of CO2(X1A1) + S(3P)
the predicted enthalpy of reaction is -227.2 kJ mol-1, which is also consistent with the experimental value of -226.7 mol-1. As shown in Figure 11, the triplet surfaces of reactions 17a and 18a might proceed via direct abstraction and substitution channels via TS1 and TS2, respectively, to produce CO(X1Σ+) + SO(X3Σ
-) and S(3P) + CO2(X1A1). In TS1, the distances of O-S bond formation and C-S bond breaking are 2.046 and 1.581 Å, respectively. In TS2, the distances of C-O bond formation and C-S bond breaking are 1.974 and 1.615 Å, respectively. The energy barriers are predicted to be 27.6 and 36.4 kJ mol-1, respectively, for these abstraction and substitution channels. The reaction O(3P) + OCS(X1Σ+
) f CS(X1Σ+ ) + O2(X3Σg-) is neglected because of its large barrier of 304.1 kJ mol-1and the large endothermicity of 181.6 kJ mol-1.
Two stable intermediates, LM1 and LM2, are found in the singlet surface (Figure 11). LM1 is associated with the O atom attacking the S atom of OCS, whereas LM2 is associated with the O atom attacking the C atom of OCS. The energies are calculated to be 150.1 and 190.0 kJ mol-1 below the triplet reactants. LM1 might dissociate without a well-defined TS to excited-state products CO(X1Σ+) + SO(a1∆) or isomerize to LM2 via TS3, with a barrier of 66.1 kJ mol-1. LM2 might dissociate without a well-defined TS to excited-state products CO2(X1A1) + S(1D) or isomerize to LM1 via TS3.
We also located four crossing points (MSXi) for the singlet-triplet surfaces. The structures of MSX1 and MSX2 optimized at the CASSCF(6,6)/6-311+(3df) level are illustrated in Figure 10; their geometries are similar to those of TS1 and TS2, respectively. The energies of MSX1 and MSX2 are 14.2 and 33.4 kJ mol-1 above O(3P) + OCS(X1Σ+
). MSX3 and MSX4 have energies at -136.3 and -108.3 kJ mol-1, slightly smaller than those of the corresponding excited-state products. The geometry of MSX4 is similar to that of LM1 except for an
increased C-S distance. The geometry of MSX3 is similar to LM2 except for an increased C-S distance.
2. Potential Energy Surfaces and Reaction Mechanism.
Both LM1 and LM2 are formed without a barrier from O(1D) + OCS(X1Σ+). The crossing from the singlet to the triplet surface might be unimportant because of the large exothermicity of these two channels. There are four branching channels from LM1: (1) decomposition to CO(X1Σ+
) + SO(a1∆) without well-defined TS; (2) crossing at MSX4 to the triplet surface to form CO(X1Σ+) + SO(X3Σ-); (3) isomerization to LM2 via TS3 with a barrier of 66.1 kJ mol-1, followed by decomposition to S(1D) + CO2(X1A1); (4) isomerizes to LM2, followed by crossing at MSX3 to the singlet surface to produce S(3P) + CO2(X1A1). Similarly, LM2 has four branching channels to form four possible product pairs.
The reaction O(3P) + OCS(X1Σ+
) might proceed, in addition to the direct channels via TS1 and TS2 to produce CO(X1Σ+) + SO(X3Σ
-) and S(3P) + CO2(X1A1), respectively, via crossing points MSX1 and MSX2 to form LM1 and LM2, respectively, on the singlet surface, as was shown previously for the reaction S + OCS.53 The subsequent paths for LM1 and LM2 are described above.
For the channel to form CO2, the calculation indicates that the barrier at TS2 is 36.4 kJ mol-1, but the crossing from the triplet to the singlet curve is predicted to occur with∼3 kJ mol-1 less energy at MSX2 that has a structure like that of TS2. For the channel to form CO, the calculation indicates that the barrier at TS1 is 27.6 kJ mol-1, but the crossing from the triplet to the singlet curve is predicted to occur with∼13 kJ mol-1less energy at MSX1 that has a structure like that of TS1. On the basis of the energy, geometry, and vibrational frequencies of OSCO at MSX1, a TST calculation gives k[O(3P) + OCS)] ) 2.6× 10⁻¹⁴ cm3molecule-1s-1at 298 K, which is near the experimental value 1.2 × 10⁻¹⁴ cm3 molecule-1 s-1.2 In fact, a slightly increased energy of MSX1 from 14.2 to 17.1 kJ mol-1provides quantitative account for the experimental value. This result indicates that the crossing probability for this heavy system, similar to the reaction S + OCS,53is near unity within the ( 4 kJ mol-1uncertainty in the predicted energy.
E. Comparison of Observed and Predicted Results. 1.
Re-action of O(3P) + OCS. According to calculations, the reaction
of O(3P) + OCS near room temperature is expected to proceed mainly via crossing at MSX1 to form SO (a1∆) and CO. For the minor channel, the reaction is expected to proceed via crossing at MSX2 to form S(1D) + CO2. At higher temperature, Figure 8. Partial emission spectrum of CO observed from the reaction O(1D) + OCS. Partial pressures of O
3and OCS are 0.078 and 0.052 Torr,
respectively. Spectral resolution is 0.3 cm-1, and the fluence of the laser is∼55 mJ cm-2.The signals are integrated 5-10 µs after laser irradiation.
O(3P) + OCS(X1Σ+) f CO2(X 1 A1) + S( 3 P), ∆H ) -226.7 kJ mol-1 (18a) O(3P) + OCS(X1Σ+) f CO2(X 1 A1) + S( 1 D), ∆H ) -116.2 kJ mol-1 (18b)
the formation of CO + SO via TS1 with energy∼13 kJ mol-1 greater than MSX1 must be taken into account. At even higher temperature (T> 1500 K), reactions via TS1 and TS2 dominate because the crossing probabilities of MSX1 and MSX2 decrease as the velocity increases. Thermal rate coefficients predicted by Isshiki et al.6using TST with Wigner tunneling corrections are much smaller than experimental values because they did not take the crossing into account. However, predicted branching ratios are similar to experimental values at high temperatures because the crossing becomes less important.
To produce ground-state products SO + CO, LM1 must cross to the triplet surface at MSX4 before dissociation. The nearly linear O-C-S geometry of MSX4 implies that the fission of the C-S bond leads to little rotational excitation of CO but much rotational excitation of SO. The C-O bond length of MSX4 is similar to that of diatomic CO, indicating little vibrational excitation for CO product upon dissociation. In contrast, the S-O bond length of MSX4 is larger than that of SO; greater vibrational excitation of SO is hence expected. The
vibrational distribution of SO observed by Chen et al.10 and that of CO by Nickolaisen et al.9 are consistent with this expectation; 26.0 and 0.6% of available energy was converted to the vibrational energies of SO and CO, respectively. The observed rotational distributions, 8.1 and 15.7% for SO and CO contradict, however, the expectation from computation; the reason is unclear. Further work on the internal distribution of CO is needed. In our experiment, we were unable to detect CO from this reaction. To produce ground-state products S + CO2, the reaction must proceed via TS2 (36.4 kJ mol-1) or via MSX2 (33.4 kJ mol-1) to form LM2, followed by crossing at MSX3; the path via MSX2 likely dominates at room temperature. Both MSX3 and TS2 have a C-O distance (1.215 and 1.974 Å, respectively) much greater than that (1.159 Å) of CO2; high vibrational excitation of CO2product is hence expected, which is consistent with our experimental observation. The reaction intermediate LM2 is expected to have a sufficient lifetime for intramolecular vibrational relaxation before it decomposes to S + CO2. The observed vibrational distribution of the product CO2is thus similar to the prior distribution assuming a statistical partitioning of the available energy. The observed E* of 18 000 ( 500 cm-1(215 ( 12 kJ mol-1) indicates a small contribution Figure 9. (a) Semilogarithmic plot of relative population Pv(J′)/(2J′
+ 1) as a function of J(J + 1) for V ) 1 to 4 of CO. The slope of each line yields the rotational temperature for the respective vibrational state. (b) Semilogarithmic plot of vibrational population of CO as a function of the vibrational quantum number, V. The value for V ) 0 is an estimated value from linear extrapolation of the plot.
Figure 10. Optimized geometries of reactants, intermediates (LM),
and transition states (TS) of the O + OCS system calculated at the B3LYP/6-311+G (3df) level; bond lengths are given in angstroms and bond angles are given in degrees.
from the S(1D) + CO2channel; that is, direct dissociation of LM2 on the singlet surface might be less important.
The quenching experiments on the reactivity of O(3P) atoms toward OCS indicate a barrier for the channel to form CO2, which is consistent with computed energies of TS2 (36.4 kJ mol-1) or MSX2 (33.4 kJ mol-1) to form LM2. Our estimated value of 24-29 kJ mol-1for this barrier height is smaller than, but consistent with, calculated values.
2. Reaction of O(1D) + OCS. According to calculations, the
reaction of O(1D) + OCS near room temperature is expected to proceed without a barrier to form LM1 and LM2. Because of the large exothermicity, curve crossing at MSX1 or MSX2 might be unimportant. LM1 and LM2 lead to the formation of SO + CO and S + CO2, respectively.
The intermediate LM1 has a structure OCSO in which∠OCS is 179° and ∠OCS of the crossing point MSX4 is essentially 180°. Because of the torque exerted on CO upon fission of the C-S bond, the extent of the rotational excitation is expected to be small, which is consistent with our experiments. Similarly, the C-O bond lengths are 1.149 and 1.135 Å for LM1 and MSX4, respectively, similar to the bond length 1.124 Å of CO;
vibrational excitation of CO product is hence expected to be modest, which is consistent with our observation.
The structure of intermediate LM2 has two C-O bonds with lengths 1.173 and 1.307 Å, respectively; the latter is much greater than that (1.159 Å) calculated for CO2. Similarly, the structure of MSX3 has two C-O bonds with lengths 1.148 and 1.215 Å, respectively. We hence expect that CO2products via these channels are highly vibrationally excited. The observed
E* of 30 000 ( 500 cm-1(359 ( 6 kJ mol-1) is 16% greater than the available energy of 25 890 cm-1for the S(1D) + CO2 channel but is 86% that of the 34 934 cm-1for the S(3P) + CO2channel. Because it is unreasonable to have E* exceeding the available energy, we conclude that crossing at MSX3 to form S(3P) + CO2plays an important role. The probability of the crossing is unknown, but it might be similar to that of MSX1, close to unity, so that the triplet S(3P) + CO2channel dominates. The value of 86% for the triplet channel is similar to the fractions of the available energy found in the cases of O(1D) + CO2and O(3P) + OCS in which the reactions proceed through a relatively long-lived complex so that the internal energy is nearly completely randomized.
TABLE 1: Vibrational Wavenumbers and Rotational Constants for the Reactants, Intermediates (LM), Transition States (TS),
Crossing Points (MSX), and Products of the O(1D,3P) + OCS Reaction Computed with the B3LYP/6-311+G(3df) Method
species rotational constant/GHz vibrational wavenumber/cm-1 OCS(X1Σ+ ) 6.1 531.1, 531.1, 879.8, 2116.0 CO(X1Σ+) 58.3 2216.8 SO(a1∆) 21.4 1156.7 SO(X3Σ -) 21.4 1157.3 CO2(X1A1) 11.8 678.9, 678.9, 1373.9, 2413.8 LM1 29.9, 3.9, 3.4 146.0, 353.3, 533.8, 662.5, 1046.9, 2053.8 LM2 18.5, 5.5, 4.2 408.4, 555.8, 583.5, 714.2, 1067.7, 1991.91 TS1 17.0, 3.0, 3.0 244.1i, 109.2, 443.8, 504.0, 829.4, 2088.6 TS2 9.5, 6.0, 3.7 363.0i, 261.1, 440.4, 524.0, 797.8, 2081.9 TS3 17.2, 5.5, 4.2 470.0i, 396.6, 488.5, 785.9, 831.2, 2119.2 MSX1 15.3, 3.2, 2.6 286.1i, 96.7, 430.8, 455.4, 842.6, 2283.1 MSX2 10.1, 6.0, 3.7 459.6i, 47.2, 448.2, 525.5, 800.5, 2098.7 MSX3 47.8, 2.8, 2.6 109.0i, 299.8, 581.8, 621.5, 1403.6, 2505.7 MSX4 27.4, 2.2, 2.1 88.4i, 97.4, 114.7, 167.6, 1070.5, 2125.9
Figure 11. Potential energy (in kilojoules per mole) diagram for the O + OCS system calculated at the CCSD(T)//B3LYP/6-311+G (3df) level.
Conclusions
We observed emission of CO and CO2 produced from reactions of O(1D,3P) + OCS with time-resolved FTIR and determined their internal-state distributions. In the reaction of O(3P) with OCS, the vibrational distribution of CO2that yields the best fit with the observed band shape is obtained with the statistical partitioning of energy E* ) 18 000 ( 500 cm-1, which is 85% of the available energy. The observed average vibrational energy of product CO2corresponds to∼49% of the available energy, but the observed rotational energy is<2% of the available energy, similar to the reaction O(1D) + CO2. The addition of Ar quenches the reaction, indicating that the reaction proceeds with a barrier.
In the reaction of O(1D) with OCS, the electronic-to-vibrational energy transfer for O(1
D) + OCS f O(3P) + OCS† is negligible. Emission of OCS(0, 0°, 1) was observed, which results from V-V energy transfer from highly vibrationally excited CO2, as in the case of O(3P) + OCS. Emissions of both CO and CO2were observed. The vibrational distribution of CO2 is consistent with predictions using statistical partitioning of energy E* ) 30 000 ( 500 cm-1, 86% of the available energy. The observed average vibrational energy of product CO2 corresponds to∼51% of the available energy, but the observed rotational energy is<2% of the available energy, similar to the reaction O(1D) + CO2.
The mechanisms of these reactions are also investigated with the CCSD(T)/6-311+G(3df)//B3LYP/6-311+G(3df) method. The results indicate that the triplet O(3P) + OCS(X1Σ+) surface proceeds via direct abstraction and substitution channels, with barriers of 27.6 and 36.4 kJ mol-1, respectively, to produce SO(X3Σ
-) + CO(X1Σ+
) and S(3P) + CO2(X1A1), whereas two intermediates, OSCO and SC(O)O, are formed from the singlet O(1D) + OCS(X1Σ+
) surface without a barrier, followed by decomposition to SO(a1∆) + CO(X1Σ+) and S(1D) + CO2(X1A1), respectively. For the ground state reaction O(3P) + OCS(X1Σ+), the singlet-triplet surface curve crossings play important roles. The major reaction channel to form SO + CO proceeds via crossing point MSX1 to form intermediate OSCO, whereas the minor channel to form S + CO2proceeds via MSX2 to form intermediate SC(O)O. For the reaction of O(1D) + OCS a direct formation of intermediates OSCO and SC(O)O before decomposition dominates. The observed distributions of internal states of CO and CO2are consistent with those expected from the computed PES.
Acknowledgment. National Science Council of Taiwan (contract numbers NSC97-2113-M009-009-MY3) and the ATU program of the Ministry of Education, Taiwan supports this work. Calculations were performed at the National Center for High-Performance Computing, Taiwan. M.C.L. is grateful to National Science Council, Taiwan for a Distinguished Visiting Professorship and to Taiwan Semiconductor Manufacturing Co. (TSMC) for a Distinguished Professorship. S.T. is grateful to the National Science Council of Taiwan for a Distinguished Visiting Professorship at National Chiao Tung University, Hsinchu, Taiwan.
References and Notes
(1) Wayne, R. P. Chemistry of Atmospheres; Oxford University Press: Oxford, U.K., 1991.
(2) Atkinson, R.; Baulch, D. L.; Cox, R. A.; Crowley, J. N.; Hampson, R. F., Jr.; Hynes, R. G.; Jenkin, M. E.; Kerr, J. A.; Rossi, M. J.; Troe, J.
Summary of EValuated Kinetic and Photochemical Data for Atmospheric Chemistry, web version, 2006.
(3) Singleton, D. L.; Cvetanovic´, R. J. J. Phys. Chem. Ref. Data 1988,
17, 1377, and references therein.
(4) Homann, K. H.; Krome, G.; Wagner, H. Gg. Ber. Bunsen-Ges. 1968,
72, 998.
(5) Hsu, D. S. Y.; Shaub, W. M.; Burks, T. L.; Lin, M. C. Chem. Phys.
1979, 44, 143.
(6) Isshiki, N.; Murakami, Y.; Tsuchiya, K.; Tezaki, A.; Matsui, H. J.
Phys. Chem. A 2003, 107, 2464.
(7) Rochford, J. J.; Powell, L. J.; Grice, R. J. Phys. Chem. 1995, 99, 15369.
(8) Shortridge, R. G.; Lin, M. C. Chem. Phys. Lett. 1975, 35, 146. (9) Nickolaisen, S. L.; Veney, D. W.; Cartland, H. E. J. Chem. Phys.
1994, 100, 4925.
(10) Chen, X.; Wu, F.; Weiner, B. R. Chem. Phys. Lett. 1995, 247, 313. (11) Berry, M. J. Chem. Phys. Lett. 1974, 29, 323.
(12) Gauthier, M. J. E.; Snelling, D. R. J. Photochem. 1975, 4, 27. (13) Wiese, W. L.; Fuhr, J. R.; Deters, T. M. J. Phys. Chem. Ref. Data,
Monogr. 1996, No. 7.
(14) Chen, H.-F.; Chiang, H.-C.; Matsui, H.; Tsuchiya, S.; Lee, Y.-P.
J. Phys. Chem. A 2009, 113, 3431.
(15) Jones, P. R.; Taube, H. J. Phys. Chem. 1973, 77, 1007. (16) Jaeger, K.; Weller, R.; Schrems, O. Ber. Bunsen-Ges. 1992, 96, 485.
(17) Froese, R. D. J.; Goddard, J. D. Mol. Phys. 1993, 79, 685. (18) Yeh, P.-S.; Leu, G.-H.; Lee, Y.-P.; Chen, I.-C. J. Chem. Phys. 1995,
103, 4879.
(19) Lin, S.-R.; Lee, Y.-P. J. Chem. Phys. 1999, 111, 9233. (20) Wu, C.-Y.; Chung, C.-Y.; Lee, Y.-C.; Lee, Y.-P. J. Chem. Phys.
2002, 117, 9785.
(21) Yang, S.-K.; Liu, S.-Y.; Chen, H.-F.; Lee, Y.-P. J. Chem. Phys.
2005, 123, 224304.
(22) Prahad, V.; Kumar, V. J. Quant. Spectrosc. Radiat. Transfer 1997,
57, 719.
(23) Molina, L. T.; Lamb, J. J.; Molina, M. J. Geophys. Res. Lett. 1981,
8, 1008.
(24) Matsumi, Y.; Kawasaki, M. Chem. ReV. 2003, 103, 4767. (25) DeMore, W. B.; Raper, O. J. Phys. Chem. 1964, 68, 412. (26) Gonzalez, C.; Schlegel, H. B. J. Chem. Phys. 1989, 90, 2154. (27) Frisch, M. J.; Trucks, G. W.; Schlegel, H. B.; Scuseria, G. E.; Robb, M. A.; Cheeseman, J. R.; Montgomery, J. A., Jr.; Vreven, T.; Kudin, K. N.; Burant, J. C.; Millam, J. M.; Iyengar, S. S.; Tomasi, J.; Barone, V.; Mennucci, B.; Cossi, M.; Scalmani, G.; Rega, N.; Petersson, G. A.; Nakatsuji, H.; Hada, M.; Ehara, M.; Toyota, K.; Fukuda, R.; Hasegawa, J.; Ishida, M.; Nakajima, T.; Honda, Y.; Kitao, O.; Nakai, H.; Klene, M.; Li, X.; Knox, J. E.; Hratchian, H. P.; Cross, J. B.; Bakken, V.; Adamo, C.; Jaramillo, J.; Gomperts, R.; Stratmann, R. E.; Yazyev, O.; Austin, A. J.; Cammi, R.; Pomelli, C.; Ochterski, J. W.; Ayala, P. Y.; Morokuma, K.; Voth, G. A.; Salvador, P.; Dannenberg, J. J.; Zakrzewski, V. G.; Dapprich, S.; Daniels, A. D.; Strain, M. C.; Farkas, O.; Malick, D. K.; Rabuck, A. D.; Raghavachari, K.; Foresman, J. B.; Ortiz, J. V.; Cui, Q.; Baboul, A. G.; Clifford, S.; Cioslowski, J.; Stefanov, B. B.; Liu, G.; Liashenko, A.; Piskorz, P.; Komaromi, I.; Martin, R. L.; Fox, D. J.; Keith, T.; Al-Laham, M. A.; Peng, C. Y.; Nanayakkara, A.; Challacombe, M.; Gill, P. M. W.; Johnson, B.; Chen, W.; Wong, M. W.; Gonzalez, C.; Pople, J. A. Gaussian 03, revision C.01; Gaussian, Inc.: Wallingford, CT, 2004.
(28) Yamamoto, N.; Vreven, T.; Robb, M. A.; Frisch, M. J.; Schlegel, H. B. Chem. Phys. Lett. 1996, 250, 373.
(29) Chedin, A. J. Mol. Spectrosc. 1979, 761, 430.
(30) Tashkun, S. A.; Perevalov, V. I.; Teffo, J.-L.; Rothman, L. S.; Tynterev, VI. G. J. Quant. Spectrosc. Radiat. Transfer 1998, 60, 785.
(31) Levine, R. D.; Bernstein, R. B. Molecular Reaction Dynamics and
Chemical ReactiVity; Oxford University Press: New York, 1985.
(32) Western, C. M. PGOPHER, a program for simulating for rotational structure. http://pgopher.chm.bris.ac.uk.
(33) Kanamori, H.; Butler, J. E.; Kawaguchi, K.; Yamada, C.; Hirota, E. J. Chem. Phys. 1985, 83, 611.
(34) Kolbe, W. F.; Leskovar, B. J. Chem. Phys. 1986, 85, 7117. (35) Chen, X.; Asmar, F.; Wang, H.; Weiner, B. R. J. Phys. Chem. 1991,
95, 6415.
(36) Yamasaki, K.; Taketani, F.; Sugiura, K.; Tokue, I.; Tsuchiya, K.
J. Phys. Chem. A 2004, 108, 2382.
(37) Felder, P.; Effenhauser, C. S.; Haas, B. M.; Huber, J. R. Chem.
Phys. Lett. 1988, 148, 417.
(38) Felder, P.; Haas, B.-M.; Huber, J. R. Chem. Phys. Lett. 1993, 204, 248.
(39) Kawasaki, M.; Sato, H. Chem. Phys. Lett. 1987, 139, 585. (40) Brouard, M.; Cireasa, R.; Clark, A. P.; Preston, T. J.; Vallance, C.; Groenenboom, G. C.; Vasyutinskii, O. S. J. Phys. Chem. A 2004, 108, 7965.
(41) Stephenson, J. C.; Wood, R. E.; Moore, C. B. J. Chem. Phys. 1968,
48, 4790.
(42) Finzi, J.; Moore, C. B. J. Chem. Phys. 1975, 63, 2285.
(43) Abe, M.; Sato, Y.; Inagaki, Y.; Matsumi, Y.; Kawasaki, M. J. Chem.
Phys. 1994, 101, 5647.
(44) Chase, M. W., Jr. J. Phys. Chem. Ref. Data, Monogr. 1998, No. 9. (45) Matsumi, Y.; Inagaki, Y.; Morley, G. P.; Kawasaki, M. J. Chem.
Phys. 1994, 100, 315.
(46) Thelen, M.-A.; Gejo, T.; Harrison, J. A.; Huber, J. R. J. Chem.
Phys. 1995, 103, 7946.
(47) Matsumi, Y.; Shamsuddin, S. M.; Sato, Y.; Kawasaki, M. J. Chem.
Phys. 1994, 101, 9610.
(48) Perri, M. J.; Van Wyngarden, A. L.; Boering, K. A.; Lin, J. J.; Lee, Y. T. J. Chem. Phys. 2003, 119, 8213.
(49) Perri, M. J.; Van Wyngarden, A. L.; Lin, J. J.; Lee, Y. T.; Boering, K. A. J. Phys. Chem. A 2004, 108, 7995.
(50) Wu, C.-Y.; Lee, Y.-P.; Ogilvie, J. F.; Wang, N. S. J. Phys. Chem.
A 2003, 107, 2389.
(51) Chen, H.-F.; Lee, Y.-P. J. Phys. Chem. A 2006, 110, 12096. (52) Setzer, K. D.; Fink, E. H.; Ramsay, D. A. J. Mol. Spectrosc. 1999,
198, 163.
(53) Lu, C.-W.; Wu, Y.-J.; Lee, Y.-P.; Zhu, R. S.; Lin, M. C. J. Chem.
Phys. 2006, 125, 164329.