I
NFLUENCE OF
D
ESIGN AND
O
PERATION
P
ARAMETERS ON
B
AG
-C
LEANING
P
ERFORMANCE OF
P
ULSE
-J
ET
B
AGHOUSE
By Hsin-Chung Lu
1and Chuen-Jinn Tsai
2ABSTRACT: In this study, a filter test system with clean new fabric bags was used to measure the pulse pressure and acceleration of the filter bag. Fabric acceleration and pulse pressure were used as an index of bag-cleaning intensity. The jet pump curves, which relate the flow rate through the venturi to the average developed pressure by the venturi, were determined by the similar system. The intersection of the jet pump curve and the bag operating line, which relates the pressure drop to flow rate across the bag during pulse-jet cleaning, is the system operating point that was used to predict the average pulse pressure in the bag during pulse-jet cleaning. Ex-perimental results of this study show that a higher pulse pressure can be achieved without the venturi at the top of the bag for bag materials with low resistance coefficient. For bags with higher resistance coefficients, higher pulse pressure is obtained with a venturi installed at the top of the bag. The predicted pressure values are in good agreement with experimental data. Dimensional analysis for jet pump performance was developed to reduce the experimental data. The results show that the jet pump curves obtained under different operating conditions can be reduced to the same nondimensional curve, which can be used to facilitate the design and operation of a pulse-jet cleaning system.
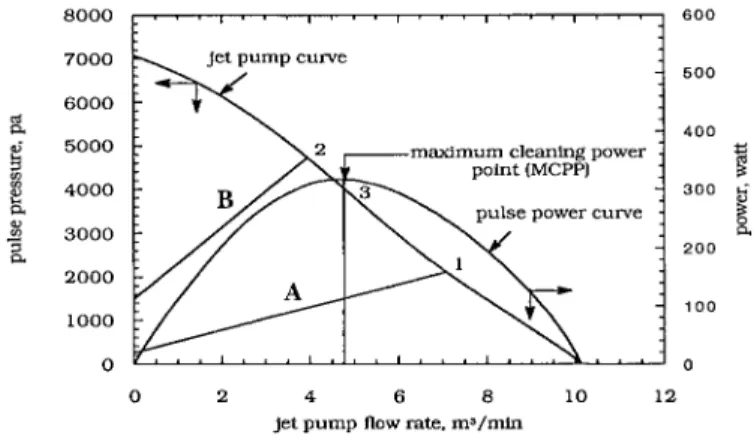
FIG. 1. Typical Jet Pump and Pulse Power Curves INTRODUCTION
Pulse-jet fabric filters are used widely for collecting fly ash from combustion sources because of their high air-to-cloth ra-tio and low cost. In bag filtrara-tion, dust particles deposited on the surface of the filter form a dust cake. This consequently leads to an increase of the pressure drop across the baghouse. To maintain an acceptable pressure drop across the filter, the dust cake must be removed periodically. In a pulse-jet bag-house, a filter bag is cleaned by a short (approximately 30 – 100 ms) blast of compressed air from a nozzle. As the com-pressed air is discharged from the nozzle, the high-velocity air expands with constant momentum and secondary air is in-duced from the surrounding air. The pulse of air usually is directed through a venturi into the filter bag to increase the pulse pressure within the bag. The secondary flow will mix with the primary high-speed air in the venturi installed some distance downstream of the nozzle. The nozzle-venturi assem-bly system converts the velocity energy into pressure energy. Therefore, the sudden increase of pressure in the bag leads to the acceleration of the fabric and creation of a reverse airflow through the bag, resulting in the removal of dust cake. This nozzle-venturi system is a so-called jet pump (Bakke 1974; Ravin et al. 1988; Morris et al. 1991).
Fig. 1 shows a typical jet pump curve, pulsing power curve, and bag operating lines of a pulse-jet fabric filter [after Bakke (1974)]. A jet pump characteristic curve varies with the initial tank pressure, nozzle size, venturi configuration, and the dis-tance between the nozzle and the venturi. The maximum pulse pressure developed in the bag by the jet pump is obtained at zero flow rate. Conversely, the maximum flow rate through venturi is obtained at zero pulse pressure or when the bag has zero resistance. The jet pump curve can be obtained easily by measuring the pulse pressure developed in the bag by the jet
1
Dept. of Envir. Engrg. and Health, Hungkuang Inst. of Technol., 34, Chung Chie Rd., 435 Shalu, Taichung, Taiwan. E-mail: hclu@sunrise.hkc. edu.tw
2
Prof., Inst. of Envir. Engrg., Nat. Chiao Tung Univ., No. 75, Poai St., 300 Hsin Chu, Taiwan. E-mail: cjtsai@green.ev.nctu.edu.tw
Note. Associate Editor: Mark E. Zappi. Discussion open until Novem-ber 1, 1999. To extend the closing date one month, a written request must be filed with the ASCE Manager of Journals. The manuscript for this paper was submitted for review and possible publication on September 2, 1997. This paper is part of the Journal of Environmental Engineering, Vol. 125, No. 6, June, 1999.䉷ASCE, ISSN 0733-9372/99/0006-0583– 0591/$8.00⫹ $.50 per page. Paper No. 16548.
pump for various airflow rates using bags of different resis-tance coefficients.
The relationship of the pressure drop⌬p across a clean filter bag and filtration velocity v is given by the following equation (Ravin et al. 1988):
QK1
⌬p = K v =1 (1)
Ac
where K1 = resistance coefficient of a clean fabric; Ac=
filtra-tion area of the fabric; and Q = air volumetric flow rate. When the dust accumulates on the bag, the pressure drop is described by the following equation (Ravin et al. 1988):
QRf
⌬p = (K ⫹ K M)v = R v =1 2 f (2)
Ac
where K2 = specific resistance coefficient of dust cake; M =
mass areal density of the dust cake; and Rf = filter final’s
re-sistance coefficient. If the effect of airflow to pressure drop is the same for both forward filtration and reverse bag-cleaning processes, the bag operating line will be linear and its slope equals the ratio of bag’s final resistance to filter area Rf/Acas
described by (2). In Fig. 1, different bag operating lines are shown as solid straight lines A and B. The intercept of the bag operating line with the vertical coordinate is the filtration pres-sure drop. When the bag is cleaned on-line, the pulse prespres-sure of the bag-cleaning process must exceed the filtration pressure drop in order to remove the dust cake. If the bag is cleaned off-line, the pulse pressure must be zero at zero flow rate; hence the line passes through the origin. It is possible to pre-dict the average pulse pressure inside the bag from the
584 / JOURNAL OF ENVIRONMENTAL ENGINEERING / JUNE 1999
ating point, which is the intersection of the bag operating line and the jet pump curve.
Also shown in Fig. 1 is the pulsing power curve, which is calculated from the product of the jet pump flow rate and the developed pulse pressure. The pulsing power curve is located between the maximum pressure at zero flow and zero pressure at the maximum flow rate. A maximum cleaning power point (MCPP) exists between the two zero values. The point can be seen in Fig. 1.
The method described by Bakke (1974) cannot only predict the pulse pressure but also judge the stability of a baghouse operation (Ravin et al. 1988; Morris et al. 1991). For an op-erating point located at the right side of the MCPP, such as point 1 in Fig. 1, if a perturbation of the process causes the filter pressure drop to increase, the slope of the bag operating line A will get steeper. The operating point 1 will slide upward along the jet pump curve, leading actually to the increase of the cleaning power and a better bag-cleaning efficiency. Here, a stable self-compensated cleaning system is maintained. Con-versely, if the filter is originally stable with the operating point at the left side of the MCPP, such as point 2 in Fig. 1 and a perturbation occurs causing the filter pressure drop to increase, then the intersection of the operating line with the jet pump curve moves upward along the jet pump curve. Consequently, the cleaning power will decrease, resulting in a lesser bag-cleaning effect. Eventually, this phenomenon causes an in-crease of the pressure drop or bag-cleaning frequency. The filtration system becomes unstable leading to a possible bag blinding or failure.
The shape of the jet pump curve is dependent on the venturi configuration, nozzle size, and initial tank pressure, which are the most important parameters influencing the jet pump per-formance. Three commonly used pulse-cleaning designs, clas-sified by the tank pressure for dust cake removal are low-pressure, intermediate-low-pressure, and high-pressure baghouses (Bustard et al. 1992). In the low-pressure configuration, the tank pressure reaches approximately 82.7 kPa (12 psi), and no venturi is installed at the top of the bag. In the high-pressure configuration, a venturi usually is installed at the top of the bag to induce secondary airflow. However, whether a venturi is required can’t be determined from the available experi-mental data in the literature. The Electric Power Research In-stitute report (Lanois and Wiktorsson 1982) compared the per-formance of the ‘‘advanced’’ and ‘‘traditional’’ fabric filter designs. The advanced system utilizes 103.4 – 206.7 kPa (15 – 30 psi) compressed air to clean the filter bag and no venturi is used, whereas the traditional system utilizes 482.3 – 620.1 kPa (70 – 90 psi) compressed air and a venturi is installed. It was found that the advanced system design requires lower cleaning energy for an equivalent cleaning efficiency. How-ever, there is no mentioning about the venturi type, nozzle size, and filter’s final resistance coefficient, which are all very important factors influencing the pulse-cleaning performance. The jet pump curve can demonstrate the potential cleaning performance of a nozzle-venturi assembly system. An appro-priate nozzle-venturi system not only reduces the consumption of pulse energy but also increases the bag-cleaning effect. In this study, an experimental apparatus is set up for determining the jet pump curves for different nozzle-venturi assemblies and operating conditions, such as various initial tank pressures. Two clean new fabrics with different resistance coefficients are tested for determining the bag operating lines. The fabric with higher resistance coefficient is used to simulate the filter final’s resistance coefficient for filters loaded with dust cake. More-over, dimensional analysis and an experimental procedure are developed for determining the nondimensional parameters in-fluencing the jet pump performance.
LITERATURE REVIEW Design of Venturi
Venturi design is one of the main design parameters affect-ing the jet pump performance. The characteristic of the jet pump curve determines the bag-cleaning performance. The de-sign of commonly used venturis differs widely, ranging from no venturi at all to a complex venturi shape. If the air flows through a poorly designed venturi, it may separate from the venturi wall, resulting in a dissipation of momentum and en-ergy of flow. The pulse pressure and cleaning effect may be reduced. Morris et al. (1991) demonstrated the performance characteristics of six venturi designs and found that the jet pump curve was sensitive to the venturi configuration.
The presence of a venturi results in a very fast oscillation of negative pulse pressure, which occurs near the top of the bag at the beginning of the cleaning process (Klingel and Lo¨ff-ler 1983). The bag snaps back on the cage and the dust emis-sion increases during cleaning. This phenomenon causes re-duced bag life and bag-cleaning efficiency. Rothwell (1990) compared the performance of a commercial and a specially designed venturi. He found that the specific venturi design can reduce the negative pulse pressure and the pressure impulse increases with the separation distance between the nozzle and the venturi.
Kroll (1947) has found that the jet entrance, venturi throat diameter, nozzle diameter, distance between nozzle and ven-turi, and configuration of venturi outlet are the most important parameters affecting the jet performance. The best entrance form of the venturi is a well-rounded entry with a cone angle of approximately 20⬚. The throat of the venturi should be cy-lindrical with a length of 5 – 10 times its diameter. Finally, the optimum angle of the divergent section of the venturi ranges from 4 to 10⬚ and the length of the section is 7–9 times the throat diameter. The distance between the nozzle and the jet must be adjustable so that an optimal distance can be found experimentally (Kroll 1947).
Effect of Bag-Cleaning Parameters
Many different bag-cleaning parameters such as peak pres-sure, initial pressure rise rate, fabric acceleration, and pressure impulse in the fabric bag have been claimed to be responsible for dust cake release by previous investigators (Dennis et al. 1981; Ellenbecker and Leith 1981; Humphris and Madden 1983). Dennis et al. (1981) demonstrated that significant cake release only occurs when the pressure pulse has an initial pres-sure rise rate greater than 600 Pa/ms. Rothwell (1988, 1990) used the same criteria in the study of pulse-jet fabric filtration systems. Other authors (Ellenbecker and Leith 1981; Hum-phris and Madden 1983) claimed that fabric acceleration is the main cleaning mechanism and that reverse airflow plays only a minor role.
Many investigators studied the relationship of the bag-clean-ing effect with fabric acceleration. The experimental results of Ravin et al. (1988) showed that the fabric acceleration in-creases with pulse pressure inside the bag. Dennis et al. (1981) predicted that an acceleration of 200g is required to achieve complete dust dislodgment during pulse-jet cleaning. How-ever, Morris’s (1984) experiment demonstrated that the pulse-jet fabric system can operate steadily when the acceleration ranged from only 30 to 60g. From Bustard’s (1992) observa-tion, the acceleration of 100 – 200g is necessary to dislodge dust effectively. The magnitude of acceleration required to re-move dust effectively was found to be related to the fabric material (Sievert and Lo¨ffler 1987). It was found that the dust removal efficiency increased with fabric acceleration and only an acceleration exceeding 30g was needed to dislodge dust effectively when a flexible polyester fabric was used.
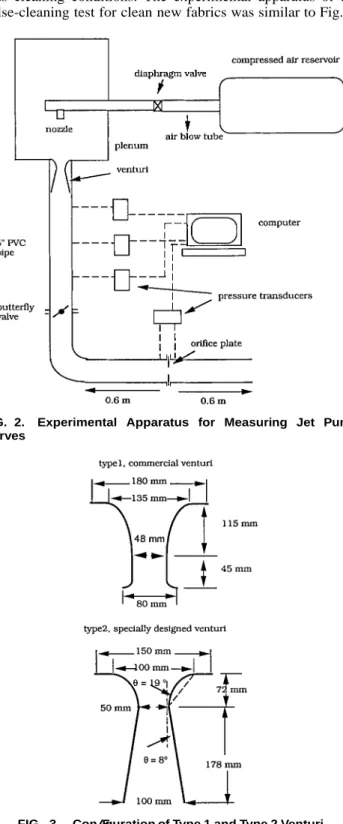
FIG. 3. Configuration of Type 1 and Type 2 Venturi FIG. 2. Experimental Apparatus for Measuring Jet Pump Curves
ever, if an inflexible fabric was tested, the fabric acceleration must reach 200 – 500g to dislodge dust effectively (Sievert and Lo¨ffler 1987).
Klingel and Lo¨ffler (1983) pointed out when air pressure impulse (PI) in the fabric bag was greater than 50 Pa⭈s, dust removal efficiency would not increase further. Air PI is defined as the integral of pressure versus time over the pulse duration,
or p(t)dt (Tpd= pulse duration). Humphries and
Mad-Tpd PI =兰0
den (1983) found that there is a minimum pulse pressure of approximately 0.3 kPa in the fabric bag, which removed ap-proximately 60% of the dust cake from the fabric. Increasing the pulse pressure beyond this minimum value results in only a slight increase in the amount of dust dislodged. Sievert and Lo¨ffler (1989) also showed that it is necessary to reach a crit-ical static overpressure of 400 – 500 Pa at all locations along the length of a bag in order to achieve a good fabric-cleaning efficiency. The overpressure is defined as pulse pressure minus the bag pressure drop. Along the fabric bag, cleaning mecha-nisms responsible for dust release may be different. The strong acceleration/deceleration in the upper bag regions was found to be responsible for cake dislodgment, whereas in the lower bag regions the dust removal was caused by the reverse airflow (Sievert and Lo¨ffler 1987, 1989).
In this study, the PI, peak pressure, average pulse pressure, and acceleration of bag are used as indices to evaluate the pulse-jet-cleaning effect.
Jet Pump Characteristic Similar to Fan
It is convenient to predict the performance of a fan by the reduced test data of the fan. The reduced data can be expressed as two nondimensional parameters,H/ D2 and Q/D2 (Fox
2 f f
and McDonald 1973), where Q is the air volumetric flow rate,
is the angular velocity of the impeller, H is the developed
pressure head of the fan, and Dfis the impeller diameter. The
relationship of these two nondimensional parameters is known as the fan law. From this law, fan curves under different con-ditions can be developed from a single fan curve. Morris et al. (1991) has proposed the similar relationship between a jet pump and a fan. However, the dimensional analysis for the jet pump has not been developed. To develop the dimensional analysis for the jet pump performance is one of the goals of this study.
EXPERIMENTAL METHOD Jet Pump Curve Measurements
The experimental arrangement for measuring a jet pump curve was shown in Fig. 2. The equipment consists of a com-pressed air reservoir, a diaphragm valve, an air blow tube, a nozzle, a venturi and a PVC pipe simulating the fabric bag. A butterfly valve and orifice plate are installed downstream of the PVC pipe. The jet pump curve was determined by mea-suring the developed pulse pressure and air volumetric flow rate generated by the combination of the nozzle and venturi assembly system. The developed pressure by the jet pump was measured by three pressure transducers (model: R22-01505, MODUS instruments, Inc.), which were installed on the ver-tical section of PVC pipe, and the volumetric flow rate was measured by the orifice plate. To measure the developed pres-sure under different resistances, the opening of butterfly valve was varied. Thus, the opening of the butterfly valve repre-sented a change in the bag’s permeability. The signals of pulse pressure and airflow rate were recorded by a computer using the pressure transducers. The variations of pressure in the res-ervoir and blow tube also were recorded by the computer.
In this experiment, jet pump curves were determined under various conditions. The nozzle diameters dn used were 8, 13,
and 20 mm and the initial compressed air tank pressure ptk0
was varied from 98 to 392 kPa (or 1 to 4 kg cm⫺2). The distance between the nozzle and the venturi S was kept at a constant 73 mm. The operating conditions were tested both with and without the venturi installed. Two different types of venturi were used, a type 1 commercial venturi and a type 2 venturi designed according to Kroll’s (1947) criteria. The de-tails of these two venturi types are shown in Fig. 3.
Pulse-Cleaning Test
In this study, the objectives of the pulse-cleaning test were to demonstrate a method to predict average pulse pressure in-side the bag and to provide the cleaning indices such as peak pressure, average pressure, PI, and bag acceleration under var-ious cleaning conditions. The experimental apparatus of the pulse-cleaning test for clean new fabrics was similar to Fig. 2,
586 / JOURNAL OF ENVIRONMENTAL ENGINEERING / JUNE 1999
FIG. 4. Jet Pump Curves, Pulse Power Curves, and Bag Oper-ating Lines for Various Venturis When ptk0= 294 kPa and dn= 13
mm
with the PVC pipe replaced by a clean fabric bag. The bag length was 1.5 m and the inside diameter was 127 mm. Two kinds of polyester bag materials labeled as 1 and 2 were tested in this experiment. The resistance coefficient of the clean bags must be measured for predicting the average pulse pressure. To measure the resistance coefficient of the bag material, a circular fabric of 47 mm in diameter was placed in a filter holder. A pressure transducer was installed to measure the pressure drop across the fabric while the airflow was passing through the fabric at different flow rates. The resistance co-efficients of these two bag materials, 1 and 2, were calculated by (1) to be 1,280 and 10,134 Pa⭈s/m, respectively.
Four pressure transducers (1⬃4) were installed on the bag. They were positioned at a distance from the bag opening of 20, 60, 100, and 140 cm, respectively. Three accelerators for measuring the acceleration of bag motion also were installed at a distance from the bag opening of 20, 60, and 140 cm, respectively.
The operating conditions for the pulse-cleaning test were
ptk0, from 98 to 392 kPa (1 to 4 kg cm
⫺2); d
n, 8, 13, and 20
mm; S, 73 and 150 mm; pulse duration, 150 ms. The pulse pressure and acceleration signals of the clean bag were re-corded at the same time the diaphragm valve was opened. The recorded data were analyzed to determine the magnitude of the pulse pressure and the acceleration of the clean bag fabric for each pulse.
Dimensional Analysis
The average pulse pressure p and pulse cleaning power ˙P
developed by the jet pump are a function of air density (), airflow rate (Q), initial tank presure ( ptk0), venturi throat
di-ameter (D), nozzle didi-ameter (dn), and the distance between the
nozzle and venturi (S ), as follows:
p = f ( p , d ,tk0 n , Q, D, S) (3)
˙
P = f ( p , d ,tk0 n , Q, D, S) (4)
From dimensional analysis, five nondimensional parameters
⌸1,⌸2,⌸3,⌸4, and⌸5are determined by the Buckingham pi
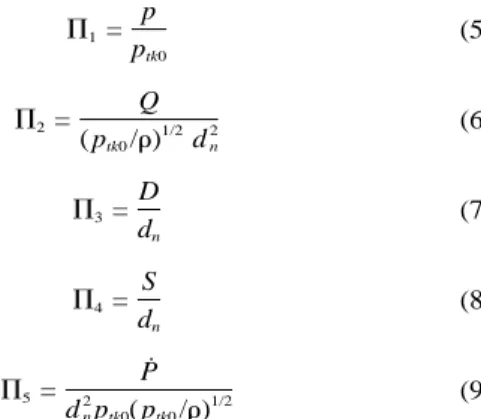
theorem (Fox and McDonald 1973). The five nondimensional parameters are: p ⌸ =1 (5) ptk0 Q ⌸ =2 1/2 2 (6) ( p /tk0 ) dn D ⌸ =3 (7) dn S ⌸ =4 (8) dn ˙ P ⌸ =5 d p ( p /2 )1/2 (9) n tk0 tk0
Therefore, the relationship between the nondimensional pa-rameters is
⌸ = f(⌸ , ⌸ , ⌸ )1 2 3 4 (10) ⌸ = f(⌸ , ⌸ , ⌸ )5 2 3 4 (11)
If the functional relationships among the nondimensional⌸ parameters have been determined from the experimental data, the jet pump curves and pulsing power curves under various operating conditions then can be established easily from the relationship of the nondimensional parameters. For example, given two jet pumps that are geometrically similar, i.e., if they
have the same values of ⌸3 and ⌸4 but differ in the initial
tank pressure, then the two jet pumps may be characterized by the respective jet pump curves, A and B. The jet pump curve A must be determined experimentally, but the jet pump curve B may be predicted from the jet pump curve A using the relationship between⌸1and⌸2. This procedure allows one
to predict the performance of each jet pump from a minimum set of test data; hence experimental work can be reduced greatly.
RESULTS AND DISCUSSION Jet Pump Performance
Fig. 4 depicts the jet pump curves for three cases (no ven-turi, type 1, and type 2 venturis), when ptk0= 294 kPa, dn =
13 mm, and S = 73 mm. It is seen from Fig. 4 that the jet pump curves vary with the venturi shape and size. When no venturi is used the jet pump curve has the lowest pressure at high flow rate and the highest pressure at low flow rate. It is caused by the fact that when no venturi is installed at bag top, more secondary air is induced from the surrounding and the pulse pressure inside the bag will decrease. Two straight lines represent the operating line for bag materials 1 and 2. The bag material 2 of higher resistance coefficient has a steeper slope. Pulse power curves also are shown in Fig. 4 as dotted curves. It is seen that the type 2 venturi has the highest MCPP value of 1.12 kW, no venturi condition has the second largest value, and type 1 venturi has the lowest MCPP value. The predicted pulse pressures for the low resistance bag material 1, for no venturi and type 1 and type 2 venturi, are 1,494, 797, and 1,245 Pa (or 6.0, 3.2, and 5.0 in. of H2O), respectively, and
their pulse-cleaning powers are 1.0, 0.25, and 0.69 kW, re-spectively. In contrast, the predicted pulse pressure and pulse-cleaning power are 3,237, 3,959, and 4,133 Pa (or 13.0, 15.9, and 16.6 in. of H2O) and 0.63, 0.89, and 1.05 kW for bag
material 2.
When the filtering area of the bag is constant, the predicted average pulse pressure of the high resistance bag material 2 is always higher than that of bag material 1. It is caused by the fact that a higher pulse pressure must be developed to over-come the resistance of the bag or dust cake. It also is found that when the low resistance bag material is tested, pulse pres-sure and pulse-cleaning power for the no venturi case is the highest. However, the pulse pressure and cleaning power be-come the lowest in such case when the high resistance bag material is tested. This phenomenon shows that the necessity of a venturi depends on the slope of the bag operating line K1/
Ac.
The influence of the filter’s resistance coefficient and bag length on the bag-cleaning effect can be examined from the slope of the bag operating line. If the filter’s resistance
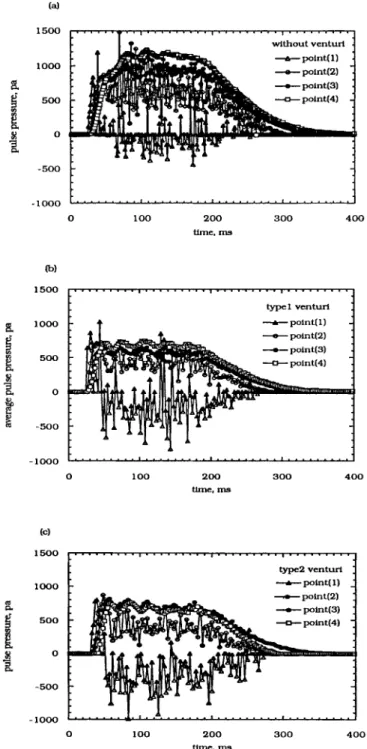
FIG. 7. Variation of Pulse Pressure Inside Bag with Time and Bag Position When ptk0= 98 kPa and dn= 13 mm: (a) No Venturi;
(b) Type 1 Venturi; (c) Type 2 Venturi FIG. 6. Jet Pump Curves for No Venturi Condition with
Differ-ent Nozzle Diameters When ptk0= 294 kPa
FIG. 5. Jet Pump Curves for No Venturi Condition With Differ-ent Initial Tank Pressures When dn= 13 mm
ficient is constant, the Rf/Ac value decreases with increasing
bag length. The operating point will shift to the left along the jet pump curve. Therefore, no venturi condition will become appropriate for obtaining a higher pulse pressure and cleaning power during pulse cleaning. However, if the filter final’s re-sistance coefficient is high or bag area is too small, the Rf/Ac
value will increase and a higher pulse pressure will be required to overcome the resistance of the dust cake. In this case, a venturi is required for obtaining a higher pulse pressure and pulse-cleaning power.
Effect of Initial Tank Pressure and Nozzle Diameter to Jet Pump Performance
Fig. 5 depicts the jet pump curve under no venturi condition for various initial tank pressures. It is seen that both developed average pulse pressure and air volumetric flow rate through the venturi increase with increasing initial tank pressure. The experimental data of other investigators (Ravin et al. 1988; Morris et al. 1991) show the same trend. The simplest way to improve the jet pump performance is to increase the pressure of the tank, which supplies compressed air to the nozzle. The other method to improve the performance of the jet pump is to increase the nozzle diameter. Fig. 6 shows the effect of the nozzle diameter on the jet pump curve. It is seen that by in-creasing the pressure and/or nozzle diameter, energy con-sumption will increase. The optimum nozzle size and tank pressure are determined by the critical cleaning force to re-move the dust cake (Lu and Tsai 1996).
Comparison of Measured and Predicted Average Pulse Pressure
Intersection of the jet pump curve and bag operating line can be used to predict the average pulse pressure for pulse
cleaning. Pulse pressure normally varies with time and bag position as shown in Fig. 7, which indicates that the pulse pressure distribution of the clean bag material 1 at different bag positions for various types of venturi when ptk0= 98 kPa, dn= 13 mm, S = 73 mm, and Tpd= 150 ms. It is found in all
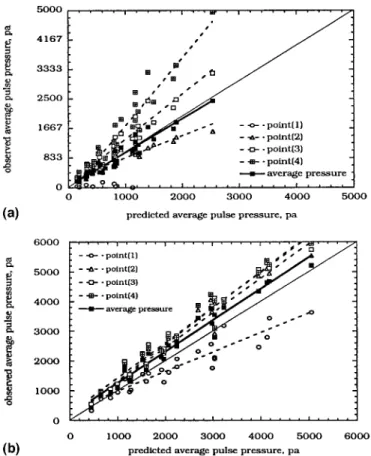
three cases that a strong oscillation of negative pulse pressure occurs near the top of the bag (point 1). The oscillation of a pulse inside the bag reduces and the magnitude of pulse pres-sure increases with increasing distance from the bag opening. Figs. 8(a – b) show the relationship between the time-aver-age measured pulse pressure and predicted avertime-aver-age pulse pres-sure for the bag materials 1 and 2, respectively. It is found that the measured average pulse pressure at four positions agree well with the predicted average pulse pressure. However, the measured time-average pressure at different positions de-viates from the ideal diagonal line in the figure. It is seen that
588 / JOURNAL OF ENVIRONMENTAL ENGINEERING / JUNE 1999 FIG. 8. Relationship between Measured Average Pulse Pres-sure and Predicted Average Pulse PresPres-sure for Various Bag Ma-terials under Different Operating Conditions: (a) Bag Material 1; (b) Bag Material 2
FIG. 9. Nondimensional Jet Pump Curve Expressed as⌸1
ver-sus⌸2: (a) Calculated Result Based on Experimental Data of
Morris et al. (1991); (b) Calculated Result Based on Experi-mental Data of Ravin et al. (1988)
the measured time-average pressure of point 1 and point 2 is less than the predicted average pulse pressure whereas that of point 3 and point 4 is higher than the predicted average pulse pressure for bag material 1. A similar situation occurs when the high resistance coefficient bag material 2 is tested. How-ever, the measured time-average pressure distribution along the bag is more uniform.
Although the current method only predicts the average pulse pressure for the whole bag from the intersection of the jet pump curve and bag operating line during pulse cleaning, it is a convenient method to estimate the average cleaning pulse pressure. This information is useful for determining the design parameters for the pulse-cleaning system.
Dimensional Analysis for Jet Pump Performance The various factors influencing the jet pump curve are tested in this study. From the dimensional analysis, the nondimen-sional group ⌸1 as a function of ⌸2, ⌸3, and ⌸4 is defined.
Figs. 9(a – b) show the experimental data of Morris et al. (1991) and Ravin et al. (1988), respectively, expressed in terms of the nondimensional group⌸1 versus⌸2 at different
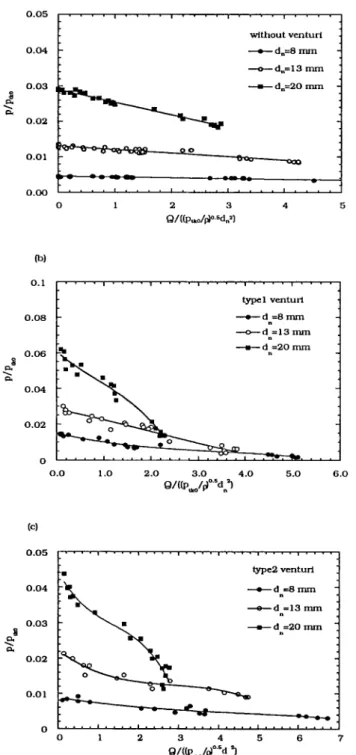
tank pressures for the same venturi. It is seen that the jet pump curves for different tank pressures are shifted to the same non-dimensional jet pump curve when the nonnon-dimensional param-eters⌸1 and⌸2are introduced. Figs. 10(a – c) show the
rela-tionship of ⌸1 and ⌸2 for different initial tank pressures and
different nozzle diameters in our experiment. The initial tank pressures used here were 98, 196, 294, and 392 kPa. The jet pump curves for different tank pressures also are shifted to the same nondimensional jet pump curve. The shape of nondi-mensional jet pump curves vary with the configuration of ven-turis and nozzle diameters. According to these results, it is found that the developed average pulse pressure of the jet pump is directly proportional to the initial tank pressure and
the flow rate is directly proportional to the square root of the initial tank pressure when the jet pumps are geometrically sim-ilar.
For different nozzle diameters, the shape of nondimensional jet pump curves is quite different for the same venturi. The nondimensional parameters can be reassembled and combined as 1 =⌸1 ⫻ and2 = ⌸2/⌸3. The relationship of 1and
2
⌸3
2is shown in Figs. 11(a – c). It is found that the experimental
data at various operating conditions seem to be shifted to the same curve when they are expressed as the combined nondi-mensional parameters1 and2. For no venturi condition, the
relationship of the combined nondimensional parameters 1
and 2 is linear and the experimental data is located closely
to the same line. For type 1 and type 2 venturis, the value of the combined parameter for a 20-mm nozzle diameter is some-what less than that of 13 and 8 mm. The reason for this dis-crepancy is the parameter⌸4, which was varied in our
exper-iment. If the value of⌸4were the same, the experimental data
will be shifted to the same combined nondimensional jet pump curve, which relate to 1 and2.
Fondse et al. (1987) pointed out that the entrainment rate, defined as E = [d(mz/m0)]/[d(S/dn)], increases with⌸4, S/dnin
the development region of a free jet, where mz is the mass
flow rate at the nozzle axial position z and m0is the mass flow
rate at nozzle exit z = 0. In the current experiment, the ⌸4
value for the 20-mm nozzle diameter is less than that for the other two nozzle diameters. This fact results in the reduction of the entrainment rate of the 20-mm nozzle diameter. Con-sequently, this causes the value of the combined parameters
FIG. 10. Nondimensional Jet Pump Curves Expressed as⌸1
versus⌸2for Current Experiment at Different Operating
Condi-tions: (a) No Venturi; (b) Type 1 Venturi; (c) Type 2 Venturi
FIG. 11. Relationship between Combined Nondimensional Parameters1and2for Different Operating Conditions: (a) No
Venturi; (b) Type 1 Venturi; (c) Type 2 Venturi
1 and2 for the 20-mm nozzle diameter to be less than the
others. However, from the Figs. 11(a – c), it is seen that the influence of ⌸4 on the combined nondimensional jet pump
curve is not very dominating under the current experimental conditions. Hence, the relationship of the developed pressure and the flow rate for the jet pump with the influencing param-eters, i.e., initial tank pressure, nozzle diameter, and venturi throat diameter, can be examined from the combined nondi-mensional jet pump curve. The developed average pulse pres-sure is directly proportional to the square of the ratio; nozzle diameter/venturi throat diameter; the flow rate is directly pro-portional to the nozzle diameter and the venturi throat diam-eter. Analysis of the experimental data of Morris et al. (1991), for the various venturis with different throat diameters, also showed that the developed pressure of the jet pump is
in-versely proportional to the square of the venturi throat diam-eter, which is in agreement with the current finding.
Pulse-Cleaning Test for Clean Fabric Bag
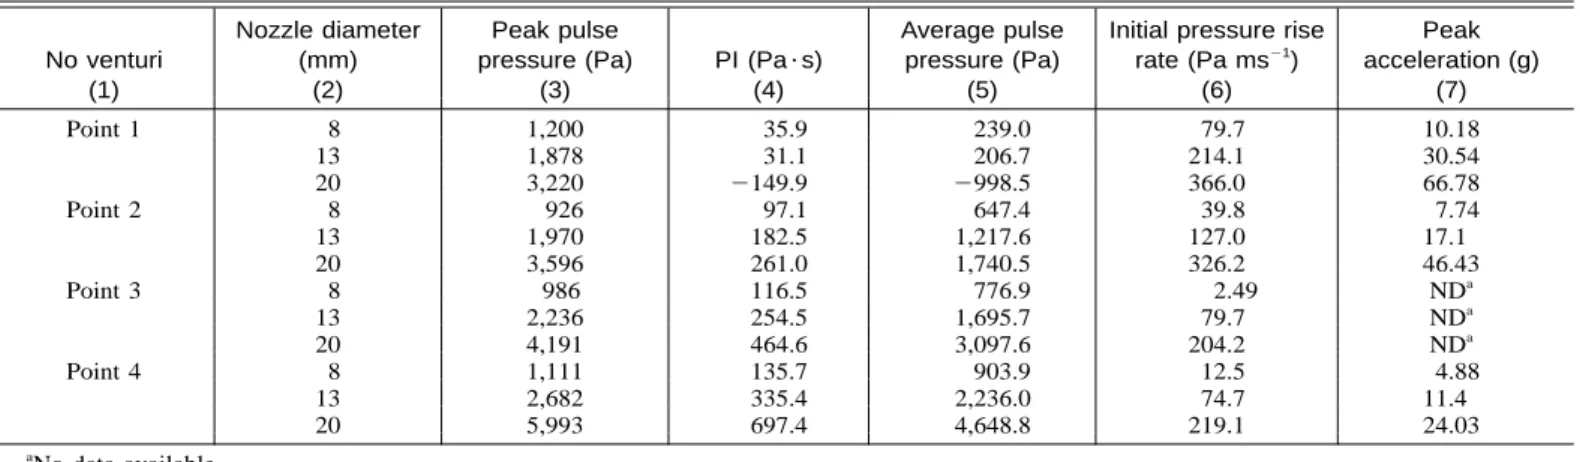
Table 1 compares the cleaning index for different nozzle diameters for bag material 1 and no venturi condition when
ptk0= 294 kPa and S = 150 mm. It is seen that the peak pulse
pressure and average pulse pressure are the highest at point 4, and the initial pressure rise rate is the highest at point 1. The pressure rise rate decreases and the magnitude of average pres-sure increases along the bag. The acceleration of the bag also is the highest at the bag top and decreases with the bag dis-tance. The results show that the acceleration caused by the bag motion dominates the cleaning force at the bag top, and the
590 / JOURNAL OF ENVIRONMENTAL ENGINEERING / JUNE 1999
TABLE 1. Cleaning Indices for Different Nozzle Diameters for Bag Material 1 and No Venturi Condition When ptk0= 294 kPa and S =
150 mm No venturi (1) Nozzle diameter (mm) (2) Peak pulse pressure (Pa) (3) PI (Pa⭈s) (4) Average pulse pressure (Pa) (5)
Initial pressure rise rate (Pa ms⫺1) (6) Peak acceleration (g) (7) Point 1 8 1,200 35.9 239.0 79.7 10.18 13 1,878 31.1 206.7 214.1 30.54 20 3,220 ⫺149.9 ⫺998.5 366.0 66.78 Point 2 8 926 97.1 647.4 39.8 7.74 13 1,970 182.5 1,217.6 127.0 17.1 20 3,596 261.0 1,740.5 326.2 46.43 Point 3 8 986 116.5 776.9 2.49 NDa 13 2,236 254.5 1,695.7 79.7 NDa 20 4,191 464.6 3,097.6 204.2 NDa Point 4 8 1,111 135.7 903.9 12.5 4.88 13 2,682 335.4 2,236.0 74.7 11.4 20 5,993 697.4 4,648.8 219.1 24.03 a No data available.
FIG. 12. Relationship between Initial Tank Pressure and Time-Average Pulse Pressure at Point 3
pressure pulse caused by the reverse airflow dominates the cleaning force at the bag bottom. When the nozzle diameter increases, all cleaning indices increases. This fact shows that a larger nozzle diameter increases the cleaning effect. How-ever, there always will be an optimum nozzle diameter for the maximum cleaning performance as was shown previously (Lu and Tsai 1996). Too large of a nozzle diameter causes a de-crease in cleaning force and the energy will be wasted. The same results can be examined from the jet pump test. For the jet pump performance, the developed pressure also increases with increasing nozzle diameter.
Fig. 12 shows the relationship of the average pulse pressure inside the clean bag with the initial tank pressure for various venturis and bag materials at point 3. The pressure pulse in-creases linearly with increasing initial tank pressure and the time-average pulse pressure always is higher for bag material with higher resistance coefficient, i.e., bag material 2. For bag material 2, the time-average pulse pressure for no venturi con-dition is the lowest, whereas for bag material 1, the time-average pulse pressure under no venturi condition is the high-est. These results agree well with the predicted results from the jet pump curve.
CONCLUSIONS
The study has investigated the performance of the jet pump curve for pulse-jet-cleaning systems. Jet pump curves vary with many parameters such as nozzle diameter, venturi type, and initial tank pressure. Dimensional analysis was developed for those parameters. The pulse-cleaning test for clean bags was used to demonstrate the method to predict pulse pressure and provided the cleaning indices such as peak pressure,
av-erage pressure, PI, and bag acceleration for judging the clean-ing performance.
It was found that the jet pump performance is sensitive to the venturi configuration, nozzle diameter, and initial tank pressure. The increase in both the initial tank pressure and the nozzle diameter improves the jet pump performance for the same venturi. A single nondimensional performance curve, which is expressed as the nondimensional parameters⌸1and
⌸2, can be achieved for the jet pump curves under different
initial tank pressures. The same calculated results also were obtained from the experimental data of other authors. The combined nondimensional parameters 1 and 2 were
intro-duced and allow one to represent the jet pump curves mea-sured under various operating conditions as one curve. From the combined nondimensional jet pump curve, it was found that the developed pressure of the jet pump is directly pro-portional to the initial tank pressure and to the square of dn/ D, and the flow rate is directly proportional to the nozzle
di-ameter, venturi throat didi-ameter, and 兹p .tk0 Various jet pump curves with different operating conditions can be developed conveniently from such a combined nondimensional jet pump curve. The results from the dimensional analysis allow one to predict the performance of each jet pump from a minimum set of test data; hence experimental effort can be minimized.
Experimental data of the pulse-cleaning test using clean bags show that the predicted average pulse pressures are in good agreement with the average measured pressures. The in-formation obtained from this predicting method is useful to determine the design parameters for the pulse-cleaning sys-tems.
The necessity of a venturi at the bag entrance depends on the resistance coefficient of the bag or the dust cake. Experi-mental results of this study show that a higher pulse pressure can be achieved without the venturi at the top of the bag with low resistance coefficient, i.e., bag material 1. For bags with a higher resistance coefficient, use of a venturi is necessary for generating a higher pressure pulse, and hence a better cleaning effect is obtained.
ACKNOWLEDGEMENTS
The writers are thankful for the funding provided by the National Science Council, Taiwan, under Grant Number NSC-85-2211-E-009-012.
APPENDIX. REFERENCES
Bakke, E. (1974). ‘‘Optimizing filtration parameters.’’ JAPCA, 24, 1150– 1154.
Bustard, C. J., Cushing, K. M., and Chang, R. L. (1992). ‘‘The potential of pulse-jet baghouse for utility boilers. Part 2: Performance of pulse-jet fabric filter pilot plants.’’ J. Air and Waste Mgmt. Assoc., 42, 1240–1249. Dennis, R., Wilder, J. E., and Harmon, D. L. (1981). ‘‘Predicting pressure
loss for pulse jet filters.’’ J. Air Pollution Control Assoc., 31, 987–992. Ellenbecker, M. J., and Leith, D. (1981). ‘‘Dust removal from non-woven fabric-cleaning methods need to be improved.’’ Filtration and Sepa-ration, Essex, U.K., 18, 41–45.
Fondse, H., Leijdens, H., and Ooms, G. (1987). ‘‘On the influence of the exit conditions on the entrainment rate in the development region of a free, round, turbulent jet. Appl. Sci. Res., 40, 355–375.
Fox, R. W., and McDonald, A. T. (1973). Introduction to fluid mechanics, 3rd Ed., Wiley, New York.
Humphris, W., and Madden, J. J. (1983). ‘‘Fabric filtration for coal-fired boilers: dust dislodgement in pulse jet filters.’’ Filtration and Sepa-ration, Essex, U.K., 20, 40–44.
Klingel, R., and Lo¨ffler, F. (1983). ‘‘Influence of cleaning intensity on pressure drop and residual dust areal density in a pulse-jet fabric filter.’’ Proc., Filtech Conf., London, 306–314.
Kroll, A. E. (1947). ‘‘The design of jet pumps.’’ Chem. Eng. Prog., 1(2), 21–24.
Lanois, E. D., and Wiktorsson, A. (1982). ‘‘Current status and future potential for high-ratio fabric filter technology applied to utility coal-fired boilers.’’ Proc., 1st Conf. on Fabric Filter Techol. for Coal-Fired Power Plants, EPRI, Denver, 4-125–4-154.
Lu, H. C., and Tsai, C. J. (1996). ‘‘Numerical and experimental study of
cleaning process of a pulse-jet fabric filtration system.’’ Envir. Sci. and Technol., 30, 3243–3249.
Morris, K., Cursley, C. J., and Allen, R. W. K. (1991). ‘‘The role of venturis in pulse-jet filters.’’ Filtration and Separation, Essex, U.K., 28, 24–31.
Ravin, M. D., Humphries, W., and Postle, R. (1988). ‘‘A model for the performance of a pulse jet filter.’’ Filtration and Separation, Essex, U.K., 24, 201–207.
Rothwell, E. (1988). ‘‘The design and operating characteristics of reverse-jet assemblies for pulse-reverse-jet dust collectors.’’ Filtration and Separation, Essex, U.K., 25, 257–262.
Rothwell, E. (1990). ‘‘Pulse-driven injectors for fabric dust filters III: Comparative performance of model and commercial assemblies.’’ Fil-tration and Separation, Essex, U.K., 27, 345–349.
Sievert, J., and Lo¨ffler, F. (1985). ‘‘The effect of cleaning system param-eters on the pressure pulse in a pulse-jet filter.’’ Proc., Conf. on Par-ticulate and Multiphase Process, Vol. II, Hemisphere Publication Corp., Washington, D.C., 647–662.
Sievert, J., and Lo¨ffler, F. (1987). ‘‘Dust cake release from non-woven fabrics.’’ Filtration and Separations, Essex, U.K., 24, 424–427. Sievert, J., and Lo¨ffler, F. (1989). ‘‘Fabric cleaning in pulse-jet filter.’’
Chem. Eng. Process, 26, 179–183.