3 O H at high temperatures
Chih-Wei Lu, Shen-Long Chou, Yuan-Pern Lee, Shucheng Xu, Z. F. Xu, and M. C. Lin
Citation: The Journal of Chemical Physics 122, 244314 (2005); doi: 10.1063/1.1924390
View online: http://dx.doi.org/10.1063/1.1924390
View Table of Contents: http://scitation.aip.org/content/aip/journal/jcp/122/24?ver=pdfcov Published by the AIP Publishing
Articles you may be interested in
Experimental and theoretical investigations of the reactions NH ( X 3 ) + D ( S 2 ) ND ( X 3 ) + H ( S 2 ) and NH ( X 3 ) + D ( S 2 ) N ( S 4 ) + HD ( X g + 1 )
J. Chem. Phys. 122, 204313 (2005); 10.1063/1.1899563
Experimental and theoretical investigation of the reaction NH ( X 3 ) + H ( S 2 ) N ( S 4 ) + H 2 ( X g + 1 ) J. Chem. Phys. 122, 114301 (2005); 10.1063/1.1862615
Reaction pathway for the nonadiabatic reaction of Ca ( 4 s 3 d D 1 ) + H 2 Ca H ( X + 2 ) + H J. Chem. Phys. 122, 084315 (2005); 10.1063/1.1850463
Isomers of OCS 2 : IR absorption spectra of OSCS and O(CS 2 ) in solid Ar J. Chem. Phys. 121, 12371 (2004); 10.1063/1.1822919
Experimental and theoretical investigations of rate coefficients of the reaction S ( 3 P )+ O 2 in the temperature range 298–878 K
J. Chem. Phys. 121, 8271 (2004); 10.1063/1.1792611
Experimental and theoretical studies of rate coefficients for the reaction
O
„
3P
…+CH
3OH at high temperatures
Chih-Wei Lu and Shen-Long Chou
Department of Chemistry, National Tsing Hua University, 101, Section 2, Kuang Fu Road, Hsinchu 30013, Taiwan
Yuan-Pern Leea兲,b兲
Department of Applied Chemistry and Institute of Molecular Science, National Chiao Tung University, 1001, Ta Hsueh Road, Hsinchu 30010, Taiwan and Institute of Atomic and Molecular Sciences, Academia Sinica, Taipei 106, Taiwan
Shucheng Xu, Z. F. Xu, and M. C. Lina兲,c兲
Department of Chemistry, Emory University, Atlanta, Georgia 30322
共Received 1 February 2005; accepted 29 March 2005; published online 29 June 2005兲
Rate coefficients of the reaction O共3P兲+CH3OH in the temperature range of 835– 1777 K were determined using a diaphragmless shock tube. O atoms were generated by photolysis of SO2 with
a KrF excimer laser at 248 nm or an ArF excimer laser at 193 nm; their concentrations were monitored via atomic resonance absorption excited by emission from a microwave-discharged mixture of O2and He. The rate coefficients determined for the temperature range can be represented by the Arrhenius equation, k共T兲=共2.29±0.18兲⫻10−10exp关−共4210±100兲/T兴 cm3molecule−1s−1;
unless otherwise noted, all the listed errors represent one standard deviation in fitting. Combination of these and previous data at lower temperature shows a non-Arrhenius behavior described as the three-parameter equation, k共T兲=共2.74±0.07兲⫻10−18T2.25±0.13exp关−共1500±90兲/T兴 cm3
molecule−1s−1. Theoretical calculations at the Becke-3-Lee–Yang–Parr 共B3LYP兲/6−311
+ G共3df ,2p兲 level locate three transition states. Based on the energies computed with coupled clusters singles, doubles共triples兲 关CCSD共T兲兴/6−311+G共3df ,2p兲//B3LYP/6−311+G共3df ,2p兲, the rate coefficients predicted with canonical variational transition state theory with small curvature tunneling corrections agree satisfactorily with the experimental observations. The branching ratios of two accessible reaction channels forming OH + CH2OH共1a兲 and OH+CH3O共1b兲 are predicted
to vary strongly with temperature. At 300 K, reaction 共1a兲 dominates, whereas reaction 共1b兲 becomes more important than reaction共1a兲 above 1700 K. © 2005 American Institute of Physics. 关DOI: 10.1063/1.1924390兴
I. INTRODUCTION
Methanol共CH3OH兲 is considered as an important alter-native fuel; it may be used directly in an internal engine via combustion or in a fuel cell via catalytic electrolytic reac-tions. The reaction
O共3P兲 + CH
3OH→ OH + CH2OH 共1a兲
→OH + CH3O 共1b兲
→HO2+ CH3 共1c兲
with three energetically accessible channels is one of the most important processes in combustion of CH3OH. The branching between these channels plays an important role in
the formation of the end products, inhibition of flames, and formation of soot.1
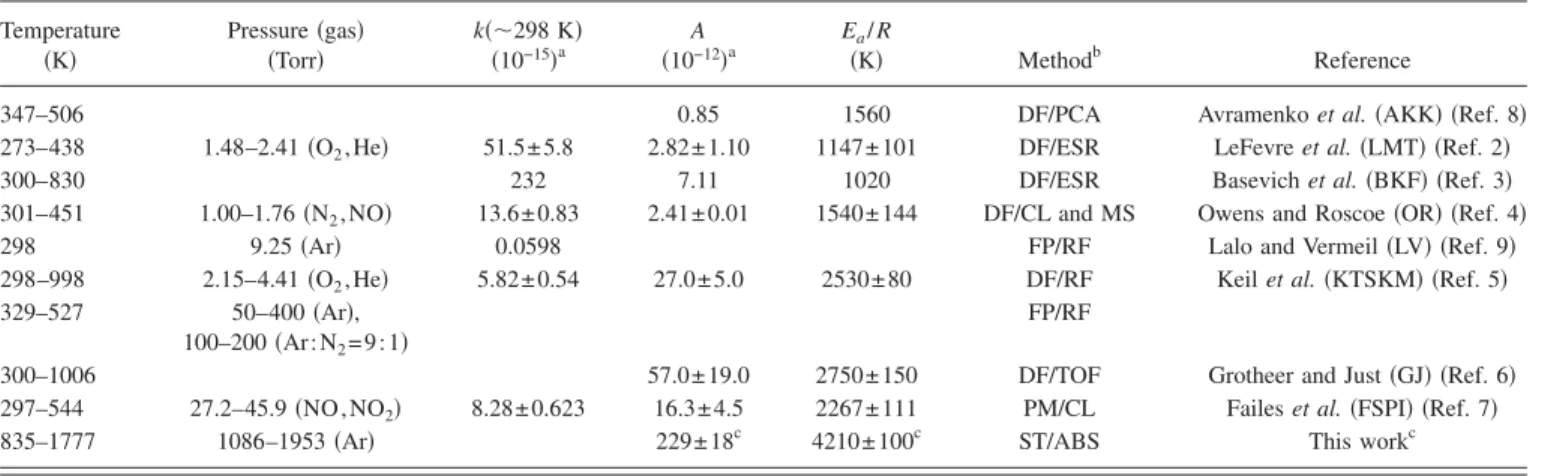
The rate coefficients of reaction 共1兲 have been deter-mined in the temperature range of 273– 1006 K by several groups.2–9The experimental conditions, reported rate coeffi-cients near room temperature, and Arrhenius parameters of these studies are listed in Table I for comparison; the corre-sponding Arrhenius plots are also shown in Fig. 1. Most rate coefficients are reported to be within a factor of two except those of LeFevre et al.2共designated LMT兲 and Basevich et
al.3 共designated BKF兲 which are 4–17 times greater near
298 K, and those of Avramenko et al.8 共designated AKK兲 which are about three times smaller. The rate coefficients of this reaction show a non-Arrhenius behavior, as the reported activation energies increases with the temperature of mea-surements. The two measurements covering limited tempera-ture range below 450 K by LMT共Ref. 2兲 and by Owens and Roscoe4 共designated OR兲 have activation energies 共Ea/ R
= 1150 and 1540 K, respectively兲 smaller than the two re-ports of Ea/ R⬵2640±110 K by Keil et al.
5 共designated
KTSKM兲 and Grotheer and Just6 共designated GJ兲 covering
temperatures up to ⬃1000 K. The experiments in the inter-a兲Authors to whom correspondence should be addressed.
b兲FAX: 886-3-5713491. Electronic mail: [email protected]
c兲Also at National Science Council Distinguished Visiting Professor at the Center for Interdisciplinary Molecular Science, National Chiao Tung University, Taiwan. FAX: 1-404-727-6586. Electronic mail: [email protected]
共2005兲
0021-9606/2005/122共24兲/244314/11/$22.50 122, 244314-1 © 2005 American Institute of Physics This article is copyrighted as indicated in the article. Reuse of AIP content is subject to the terms at: http://scitation.aip.org/termsconditions. Downloaded to IP:
mediate temperature range of 297– 544 K by Failes et al.7 共designated FSPI兲 yield an intermediate value of Ea/ R
= 2270± 110 K.
Although the two sets of experiments by KTSKM共Ref. 5兲 and GJ 共Ref. 6兲 at high temperatures show similar values of Ea/ R共2530±80 and 2750±150 K, respectively兲, rate
co-efficients vary by as much as 1.7 times at 1000 K partly because of variations in the Arrhenius preexponential factors 共2.7⫻10−11 and 5.7⫻10−11cm3molecule−1s−1,
respectively兲.5,6 The experimental data are lacking for tem-peratures above 1006 K.
To the best of our knowledge, there have been no high-level quantum-chemical calculations performed for the O + CH3OH system. Tsang10combined the existing
experimen-tal data with a transition state theory using bond-energy-bond-order 共BEBO兲 approximations and predicted the tem-perature dependence of the rate coefficient to be
k1= 6.44⫻ 10−19T2.50
⫻exp关− 共1550/T兲兴 cm3molecule−1s−1. 共2兲
The rate coefficient is predicted to increase rapidly at tem-peratures above 1000 K, yielding an upward curved Arrhen-ius plot.
Because of the importance of this reaction in combus-tion, kinetic data at higher temperatures are needed. We have determined the rate coefficients of the title reaction up to 1777 K with a diaphragmless shock tube. We also performed the theoretical calculations on this reaction to compare with our experimental measurements and to understand the com-petition between the two channels at varied temperatures.
II. EXPERIMENTS
The details of the diaphragmless shock tube apparatus have been described previously.11,12The shock tube 共length of 5.9 m and inside diameter共i.d.兲 of 7.6 cm兲 is coupled to a detection system using atomic resonance absorption. The speed of the shock wave was determined with pressure sen-sors and time-frequency counters. A microwave-discharged lamp with a flowing gas mixture of⬃1% O2in He served as a light source for atomic absorption of O atoms. Emission at 130.23, 130.49, and 130.60 nm, corresponding to atomic transitions of O共3S –3P
2,1,0兲, passes perpendicularly near the
end of the shock tube and a vacuum UV monochromator 共reciprocal linear dispersion of 4.0 nm mm−1 and slit width
of 350m兲 before being detected with a solar-blind photo-multiplier tube共PMT兲. Variation of the signal from the PMT was monitored with a digital storage oscilloscope and trans-ferred to a computer for further processing.
For kinetic measurements, O atoms were generated from laser photolysis of SO2 at 248 or 193 nm. At 248 nm,
ab-sorption cross section of SO2 is 7.7⫻10−20cm2 at 1100 K
and 5.3⫻10−19cm2 at 2000 K.13
At 193 nm, absorption cross section of SO2 is 3.4⫻10−18cm2 at 1100 K and 2.8
⫻10−18cm2 at 2000 K.13
Light from the ArF excimer laser at 193 nm共or KrF excimer laser at 248 nm兲 enters the shock tube from the quartz end plate and passes along the tube. A TABLE I. Summary of reported experimental rate coefficients using various methods.
Temperature 共K兲 Pressure共gas兲 共Torr兲 k共⬃298 K兲 共10−15兲a A 共10−12兲a Ea/ R 共K兲 Methodb Reference
347–506 0.85 1560 DF/PCA Avramenko et al.共AKK兲 共Ref. 8兲
273–438 1.48–2.41共O2, He兲 51.5± 5.8 2.82± 1.10 1147± 101 DF/ESR LeFevre et al.共LMT兲 共Ref. 2兲
300–830 232 7.11 1020 DF/ESR Basevich et al.共BKF兲 共Ref. 3兲
301–451 1.00–1.76共N2, NO兲 13.6± 0.83 2.41± 0.01 1540± 144 DF/CL and MS Owens and Roscoe共OR兲 共Ref. 4兲
298 9.25共Ar兲 0.0598 FP/RF Lalo and Vermeil共LV兲 共Ref. 9兲
298–998 2.15–4.41共O2, He兲 5.82± 0.54 27.0± 5.0 2530± 80 DF/RF Keil et al.共KTSKM兲 共Ref. 5兲
329–527 50–400共Ar兲,
100–200共Ar:N2= 9 : 1兲
FP/RF
300–1006 57.0± 19.0 2750± 150 DF/TOF Grotheer and Just共GJ兲 共Ref. 6兲
297–544 27.2–45.9共NO,NO2兲 8.28± 0.623 16.3± 4.5 2267± 111 PM/CL Failes et al.共FSPI兲 共Ref. 7兲
835–1777 1086–1953共Ar兲 229± 18c 4210± 100c ST/ABS This workc
aIn units of cm3molecule−1s−1.
bDF: discharge flow; FP: flash photolysis; PM: phase modulation; ST: shock tube; PCA: product collection and analysis; ESR: electron-spin resonance; CL: chemiluminescence; MS: mass spectrometry; RF: resonance fluorescence; TOF: time-of-flight mass; ABS: absorption.
ck共T兲=共2.74±0.07兲⫻10−18T2.25±0.13exp关−共1500±90兲/T兴 cm3molecule−1s−1for a combined fit of the data from KTSKM and this work.
FIG. 1. Arrhenius plots of k1 for the reaction O + CH3OH. Our data are shown as symbols䊊. Previous results are shown as lines of various types drawn for the temperature range of study. A combination of first character of each author’s last name is used to indicate previous reports, as listed in Table I.
pulse generator was employed to trigger the laser about 150– 200s after the arrival of the incident shock wave at the last pressure sensor.
Before each experiment, the system was pumped below 5.0⫻10−7Torr. The temperature共T
5兲, density 共5兲, and
pres-sure共P5兲 in the reflected shock regime were calculated from
measured velocity of the incident shock, the composition of the test gas, the initial pressure, and the temperature using the ideal shock-wave theory14 with Mirels’ boundary layer corrections.15,16
We calibrated the concentration of O atoms in the shock tube with pyrolysis of N2O, assuming a 100% yield of O
atoms.17 The concentration of O atoms is fitted with the equation
关O兴/1013molecule cm−3= 4.4233A − 0.0336A2
+ 2.5741A3 共3兲
in which absorbance A is calculated with the equation
A = ln共I0/I兲 共4兲
in which the light intensity before and after production of O atoms is denoted as I0and I, respectively.
He 共99.9995%, AGA Specialty Gases兲, Ar 共99.9995%, AGA Specialty Gases兲, N2O 共99%, Scott Specialty Gases兲, O2 共99.999%, Scott Specialty Gases兲, and SO2 共99.98%, Matheson兲 were used without further purification. CH3OH 共99.9%, Mallinckrodt, Analytical Reagent grade兲 was puri-fied by passing the vapor though P2O5to remove trace water impurity. Mixtures of CH3OH in Ar 共100–500 ppm兲 and
SO2in Ar共100–900 ppm兲 were used.
III. COMPUTATIONAL METHODS
The geometry of reactants, transition states, and products of the O + CH3OH system was optimized at the
Becke-3-Lee–Yang–Parr 共B3LYP兲/6−311+G共3df ,2p兲 level of theory with Becke’s three-parameter nonlocal exchange functional18and the nonlocal correlation functional of Lee et
al.19Single-point energies of all species were calculated with the coupled cluster singles, doubles 共triples兲 关CCSD共T兲兴/6 − 311+ G共3df ,2p兲 method,20
based on the optimized geom-etries at the B3LYP/ 6 − 311+ G共3df ,2p兲 level.
The rate coefficients were calculated with conventional transition state theory共TST兲, canonical variational transition 共CVT兲 state theory with zero curvature tunneling 共ZCT兲 cor-rections, and small curvature tunneling共SCT兲 corrections us-ing thePOLYRATEprogram of Corchado et al.21
All calculations were carried out withGAUSSIAN 03共Ref. 22兲 programs using a personal computer 共PC兲 cluster and the computers at the Emerson Computation Center of Emory University.
IV. RESULTS AND DISCUSSION A. Rate coefficient k1for O + CH3OH
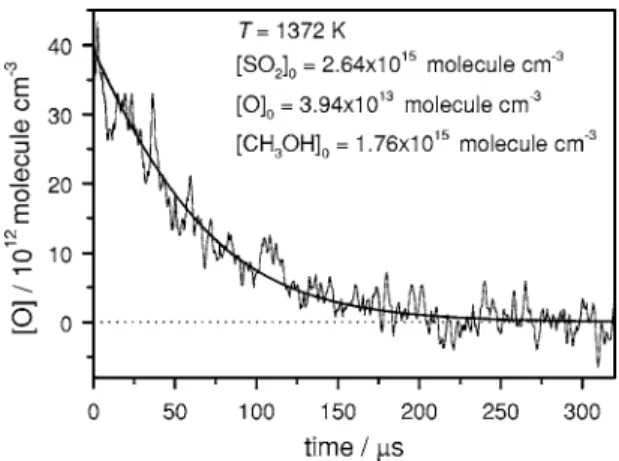
The experiments were carried out under pseudo-first-order conditions with 关CH3OH兴0Ⰷ关O兴. Figure 2 shows a
typical temporal profile recorded for the mixture containing SO2, CH3OH, and Ar after laser photolysis at 193 nm. The
concentration of O atoms at reaction period t 关O兴tis derived
according to Eqs. 共3兲 and 共4兲. 关O兴t follows an exponential
decay in the initial stage. The apparent pseudo-first-order rate coefficient kIis derived with the equation
ln共关O兴t/关O兴0兲 = − k I
t + at2− bt3 共5兲 in which t is the reaction time and a and b are the fitting parameters to account for deviation from the exponential de-cay due to secondary reactions. The apparent bimolecular rate coefficient, k1
⬘
is thus derived fromk1
⬘
= kI/关CH3OH兴0. 共6兲Comparison of k1
⬘
with the true bimolecular rate coefficientk1 provides information on the extent of interference due to
secondary reactions.
At low temperature, previously observed deuterium iso-topic effects on rate coefficients indicate that reaction 共1兲 is dominated by channel 共1a兲. Grotheer and Just6 observed similar apparent decay rates for reactions of O + CH3OH and
O + CH3OD at 305 K, which are⬃8 times greater than those
of O + CD3OH and O + CD3OD, indicating that the main re-action channel is the abstrre-action of the H atom of the methyl group. However, as temperature increases, reaction共1b兲 may become important. Our theoretical calculations共discussed in Sec. IV C兲 show that reaction 共1c兲 is unimportant under our experimental conditions and the branching ratio of reaction 共1b兲 increases from ⬃0.13 at 300 K to ⬃0.5 at 1700 K. Be-cause we are only probing the decay of关O兴 and cannot dis-tinguish between channels 共1a兲 and 共1b兲, we employed branching ratios calculated theoretically in this work in the model to derive the total decay coefficient.
Photolysis of SO2at 193 nm is more efficient in
gener-ating O atoms, thus enabling us to use smaller concentrations of SO2. However, irradiation of CH3OH with light at 193 nm
produces CH3O and H.23The effect of CH3O production on
the decay of关O兴 was examined by employing the photolysis laser at 248 nm, at which wavelength photolysis of CH3OH
is negligible. We estimate the photolysis yield by the follow-ing equation:
FIG. 2. A typical temporal profile of 关O兴 observed after irradiation of a sample containing SO2共300 ppm兲 and CH3OH共200 ppm兲 in Ar. T = 1372 K and total density= 8.79⫻1018molecule cm−3. The thick solid line represents the fitted results using the model described in text.
关CH3O兴0=F关CH3OH兴 共7兲
in which is the cross section 共cm2molecule−1兲 of CH3OH,24F is the fluence共photons cm−2兲 of the laser, and
is the photolysis yield.23No significant variations in derived rate coefficients were observed for photolysis of SO2at 193
and 248 nm.
Several interference reactions need to be considered. At high temperatures, pyrolysis of CH3OH is non-negligible.10
According to modeling, at 1777 K and 关CH3OH兴0= 5.95
⫻1014, 关SO
2兴0= 2.95⫻1015, and 关Ar兴=5.91⫻1018
molecule cm−3, about one-half of CH
3OH decomposes
within 90s.
CH3OH共+ M兲 → CH3+ OH共+ M兲 共8a兲
→CH2OH + H共+ M兲. 共8b兲
The products CH2OH and CH3react rapidly with O atoms
O + CH2OH→ H2CO + OH, 共9兲
O + CH3→ H2CO + H. 共10兲
Hence, subsequent reactions involving H and OH need to be considered.
Because we used SO2 as the source of O atoms,
reac-tions involving SO, SO2, and SO3should also be considered.
O + SO→ S + O2, 共11a兲
O + SO共+ M兲 → SO2共+ M兲, 共11b兲
O + SO2共+ M兲 → SO3共+ M兲, 共12a兲
O + SO2→ SO + O2. 共12b兲
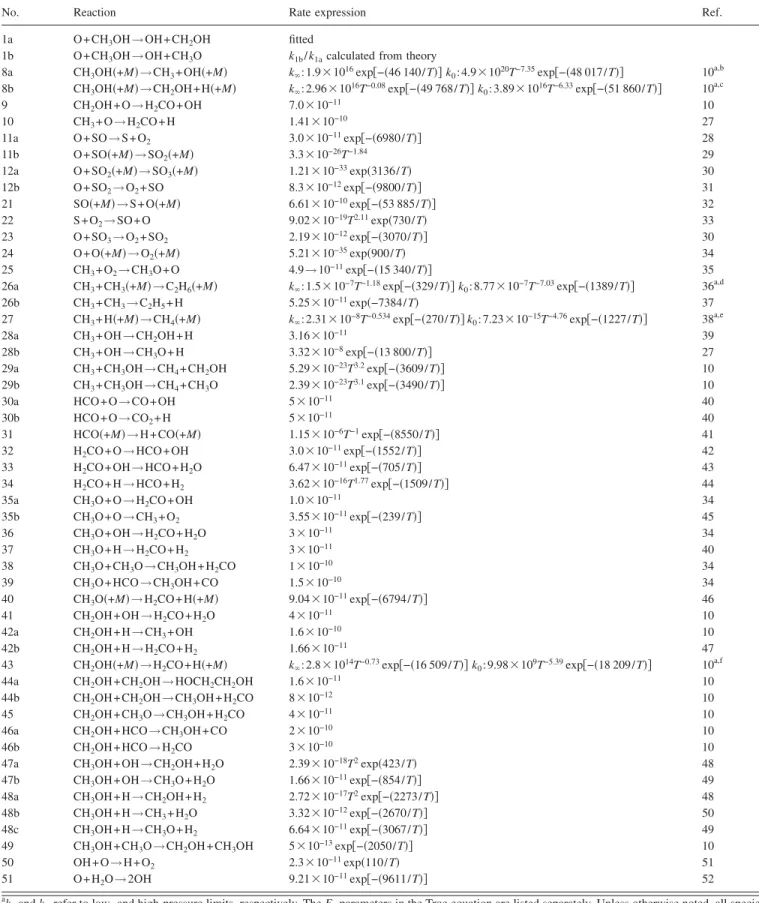
We modeled observed temporal profiles of 关O兴 with a commercial kinetic modeling program FACSIMILE.25 The model employed is listed in Table II; it is basically a simpli-fied version of that employed by Held and Dryer1with addi-tional reactions involving S, SOx, and CH3. The rate
coeffi-cients are obtained from the literature unless noted. It should be noted that the inclusion of 50 reactions or so in the model is only for completeness. If we use a simplified model with ten reactions, the results are within 15% of those derived with a more complete model.
Because the laser was triggered about 50– 100s after arrival of the reflected shock wave at the observation zone, pyrolysis of CH3OH before generation of O atoms should be
taken into account, especially at high temperature. We mod-eled these reactions in two separate periods: the first period started from the arrival of the reflected shock wave and ended with the arrival of the photolysis laser pulse, and the second period started on arrival of the photolysis laser pulse. In the first period, we used关O兴=0 to derive concentrations of all reactants and intermediates at the end of this period, which were then employed in the second period, along with experimentally observed concentration of laser-produced O atoms, to model the temporal profile of关O兴. In the fitting, the branching ratio of the title reaction calculated quantum chemically in this work and the literature values of rate
co-efficients of all reactions except the title reaction k1 were
held constant, and the bimolecular rate coefficient k1 was
varied to yield the best fit.
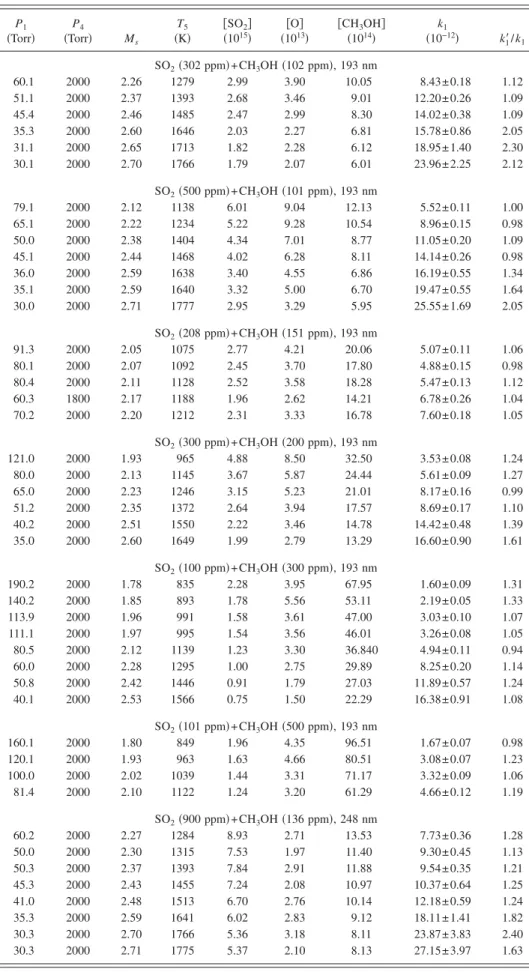
The experimental conditions and values of k1 for 44 measurements in a temperature range of 835– 1777 K using mixtures of various concentrations of CH3OH and SO2 are
summarized in Table III. We list k1
⬘
/ k1in Table III forcom-parison; except for a few cases under extreme conditions, most values of k1
⬘
obtained with Eq. 共6兲 from pseudo-first-order decays are within 25% of k1, indicating that even apseudo-first-order model is adequate in these cases. How-ever, for data at high temperature and high concentration of SO2, k1
⬘
is greater than k1by factors as much as 2.4,indicat-ing that interference reactions are non-negligible.
Sensitivity analysis shows that rate coefficient of the title reaction is most sensitive to variations of rate coefficients of reactions 共12a兲 and 共32兲 at low temperatures and reactions 共8a兲, 共10兲, 共27兲, 共28a兲, 共32兲, 共33兲, and 共50兲, at high tempera-tures. In most cases at temperatures below 1550 K, the rate coefficient k1 varies by less than 20% if one of the above
reactions was neglected. In the extreme case at temperature near 1770 K at which pyrolysis of CH3OH becomes
impor-tant, we found that the rate coefficient k1would increase by
as much as 2.7 times if k10was neglected in the model and k1
would decrease by a similar factor if k27was neglected in the
model.
Some representative decay curves covering the whole temperature range of study were also modeled with a com-plete model consisting of 89 reactions employed by Held and Dryer,1eight reactions involving sulfur compounds and eight additional reactions 关reactions 共26b兲, 共27兲, 共28a兲, 共28b兲, 共29b兲, 共35b兲, 共48b兲, and 共50兲兴 not included in the model of Held and Dryer.1The derived rate coefficients are similar to those listed in Table III using our model, with deviations less than 18%.
We tested the effect of branching ratio k1a/共k1a+ k1b兲 on the derived total rate coefficient k1and found that the derived
rate coefficient k1 is insensitive to the branching ratio at all temperatures. Presumably this is because secondary reactions associated with CH3O and CH2OH have similar effects on
the decay of O atoms. We also tested the effect of pyrolysis of CH3OH before its reaction with O atoms. Pyrolysis of
CH3OH has two counteractive effects: the decrease in 关CH3OH兴 and effects due to secondary reactions involving
pyrolysis products CH3, OH, CH2OH, and H. At tempera-tures below 1650 K, when we took out the simulation of the first period 共i.e., to assume that pyrolysis of CH3OH was
negligible before the photolysis laser arrived兲, we found that the fitted rate coefficients k1increased by⬍20%, indicating that the effect of ⬃10% decrease in 关CH3OH兴 during the
first period was smaller than the effect due to secondary re-actions. In contrast, we found that k1decreased by⬍15% for
temperatures above 1700 K because 20%–40% of CH3OH dissociated in the first period.
The values of k1 at various temperatures are compared
with the previous reports in Figs. 1 and 3. Our rate coeffi-cients correlate well with the data of KSTKM 共Ref. 5兲 and GJ 共Ref. 6兲 in the overlapped range of temperatures. Our This article is copyrighted as indicated in the article. Reuse of AIP content is subject to the terms at: http://scitation.aip.org/termsconditions. Downloaded to IP:
TABLE II. Reaction models employed to derive rate coefficients of O + CH3OH.
No. Reaction Rate expression Ref.
1a O + CH3OH→OH+CH2OH fitted
1b O + CH3OH→OH+CH3O k1b/ k1acalculated from theory
8a CH3OH共+M兲→CH3+ OH共+M兲 k⬁: 1.9⫻1016exp关−共46 140/T兲兴 k0: 4.9⫻1020T−7.35exp关−共48 017/T兲兴 10a,b 8b CH3OH共+M兲→CH2OH + H共+M兲 k⬁: 2.96⫻1016T−0.08exp关−共49 768/T兲兴 k0: 3.89⫻1016T−6.33exp关−共51 860/T兲兴 10a,c
9 CH2OH + O→H2CO + OH 7.0⫻10−11 10
10 CH3+ O→H2CO + H 1.41⫻10−10 27
11a O + SO→S+O2 3.0⫻10−11exp关−共6980/T兲兴 28
11b O + SO共+M兲→SO2共+M兲 3.3⫻10−26T−1.84 29
12a O + SO2共+M兲→SO3共+M兲 1.21⫻10−33exp共3136/T兲 30
12b O + SO2→O2+ SO 8.3⫻10−12exp关−共9800/T兲兴 31 21 SO共+M兲→S+O共+M兲 6.61⫻10−10exp关−共53 885/T兲兴 32 22 S + O2→SO+O 9.02⫻10−19T2.11exp共730/T兲 33 23 O + SO3→O2+ SO2 2.19⫻10−12exp关−共3070/T兲兴 30 24 O + O共+M兲→O2共+M兲 5.21⫻10−35exp共900/T兲 34 25 CH3+ O2→CH3O + O 4.9→10−11exp关−共15 340/T兲兴 35
26a CH3+ CH3共+M兲→C2H6共+M兲 k⬁: 1.5⫻10−7T−1.18exp关−共329/T兲兴 k0: 8.77⫻10−7T−7.03exp关−共1389/T兲兴 36a,d
26b CH3+ CH3→C2H5+ H 5.25⫻10−11exp共−7384/T兲 37
27 CH3+ H共+M兲→CH4共+M兲 k⬁: 2.31⫻10−8T−0.534exp关−共270/T兲兴 k0: 7.23⫻10−15T−4.76exp关−共1227/T兲兴 38a,e
28a CH3+ OH→CH2OH + H 3.16⫻10−11 39
28b CH3+ OH→CH3O + H 3.32⫻10−8exp关−共13 800/T兲兴 27
29a CH3+ CH3OH→CH4+ CH2OH 5.29⫻10−23T3.2exp关−共3609/T兲兴 10
29b CH3+ CH3OH→CH4+ CH3O 2.39⫻10−23T3.1exp关−共3490/T兲兴 10
30a HCO + O→CO+OH 5⫻10−11 40
30b HCO + O→CO2+ H 5⫻10−11 40
31 HCO共+M兲→H+CO共+M兲 1.15⫻10−6T−1exp关−共8550/T兲兴 41
32 H2CO + O→HCO+OH 3.0⫻10−11exp关−共1552/T兲兴 42 33 H2CO + OH→HCO+H2O 6.47⫻10−11exp关−共705/T兲兴 43 34 H2CO + H→HCO+H2 3.62⫻10−16T1.77exp关−共1509/T兲兴 44 35a CH3O + O→H2CO + OH 1.0⫻10−11 34 35b CH3O + O→CH3+ O2 3.55⫻10−11exp关−共239/T兲兴 45 36 CH3O + OH→H2CO + H2O 3⫻10−11 34 37 CH3O + H→H2CO + H2 3⫻10−11 40 38 CH3O + CH3O→CH3OH + H2CO 1⫻10−10 34 39 CH3O + HCO→CH3OH + CO 1.5⫻10−10 34 40 CH3O共+M兲→H2CO + H共+M兲 9.04⫻10−11exp关−共6794/T兲兴 46 41 CH2OH + OH→H2CO + H2O 4⫻10−11 10 42a CH2OH + H→CH3+ OH 1.6⫻10−10 10 42b CH2OH + H→H2CO + H2 1.66⫻10−11 47
43 CH2OH共+M兲→H2CO + H共+M兲 k⬁: 2.8⫻1014T−0.73exp关−共16 509/T兲兴 k0: 9.98⫻109T−5.39exp关−共18 209/T兲兴 10a,f
44a CH2OH + CH2OH→HOCH2CH2OH 1.6⫻10−11 10 44b CH2OH + CH2OH→CH3OH + H2CO 8⫻10−12 10 45 CH2OH + CH3O→CH3OH + H2CO 4⫻10−11 10 46a CH2OH + HCO→CH3OH + CO 2⫻10−10 10 46b CH2OH + HCO→H2CO 3⫻10−10 10 47a CH3OH + OH→CH2OH + H2O 2.39⫻10−18T2exp共423/T兲 48 47b CH3OH + OH→CH3O + H2O 1.66⫻10−11exp关−共854/T兲兴 49 48a CH3OH + H→CH2OH + H2 2.72⫻10−17T2exp关−共2273/T兲兴 48 48b CH3OH + H→CH3+ H2O 3.32⫻10−12exp关−共2670/T兲兴 50 48c CH3OH + H→CH3O + H2 6.64⫻10−11exp关−共3067/T兲兴 49 49 CH3OH + CH3O→CH2OH + CH3OH 5⫻10−13exp关−共2050/T兲兴 10 50 OH + O→H+O2 2.3⫻10−11exp共110/T兲 51 51 O + H2O→2OH 9.21⫻10−11exp关−共9611/T兲兴 52 ak
0and k⬁refer to low- and high-pressure limits, respectively. The Fcparameters in the Troe equation are listed separately. Unless otherwise noted, all species
are assumed to have a third body efficiency of 1.0. bF
c=共1−0.414兲exp关−共T/279兲兴+0.414 exp关−共T/5459兲兴.
cF
c=共1−0.773兲exp关−共T/693兲兴+0.773 exp关−共T/5333兲兴.
dF
c=共1−0.619兲exp关−共T/73.2兲兴+0.619 exp关−共T/1180兲兴. Enhanced third body coefficient 共relative to N2兲:Ar= 0.7. eF
c=共1−0.783兲exp关−共T/74兲兴+0.783 exp关−共T/2941兲兴+exp关−共6964/T兲兴. Enhanced third body coefficient 共relative to N2兲:Ar= 0.7. fF
c=共1−0.96兲exp关−共T/67.6兲兴+0.96 exp关−共T/1855兲兴+exp关−共7543/T兲兴.
TABLE III. Experimental conditions and rate coefficients k1for the reaction O + CH3OH.共P1: pressure of reactant gas mixture; P4: pressure of driver gas; Ms: Mach number; T5: temperature of reaction. Concentrations are in units of molecule cm−3; k
1in cm3molecule−1s−1are fitted with kinetic modeling and k1⬘are derived from pseudo-first-order decays; see text.兲
P1 共Torr兲 P4 共Torr兲 Ms T5 共K兲 关SO共10152兴兲 共10关O兴13兲 关CH3 OH兴 共1014兲 k1 共10−12兲 k 1 ⬘/ k1 SO2共302 ppm兲+CH3OH共102 ppm兲, 193 nm 60.1 2000 2.26 1279 2.99 3.90 10.05 8.43± 0.18 1.12 51.1 2000 2.37 1393 2.68 3.46 9.01 12.20± 0.26 1.09 45.4 2000 2.46 1485 2.47 2.99 8.30 14.02± 0.38 1.09 35.3 2000 2.60 1646 2.03 2.27 6.81 15.78± 0.86 2.05 31.1 2000 2.65 1713 1.82 2.28 6.12 18.95± 1.40 2.30 30.1 2000 2.70 1766 1.79 2.07 6.01 23.96± 2.25 2.12 SO2共500 ppm兲+CH3OH共101 ppm兲, 193 nm 79.1 2000 2.12 1138 6.01 9.04 12.13 5.52± 0.11 1.00 65.1 2000 2.22 1234 5.22 9.28 10.54 8.96± 0.15 0.98 50.0 2000 2.38 1404 4.34 7.01 8.77 11.05± 0.20 1.09 45.1 2000 2.44 1468 4.02 6.28 8.11 14.14± 0.26 0.98 36.0 2000 2.59 1638 3.40 4.55 6.86 16.19± 0.55 1.34 35.1 2000 2.59 1640 3.32 5.00 6.70 19.47± 0.55 1.64 30.0 2000 2.71 1777 2.95 3.29 5.95 25.55± 1.69 2.05 SO2共208 ppm兲+CH3OH共151 ppm兲, 193 nm 91.3 2000 2.05 1075 2.77 4.21 20.06 5.07± 0.11 1.06 80.1 2000 2.07 1092 2.45 3.70 17.80 4.88± 0.15 0.98 80.4 2000 2.11 1128 2.52 3.58 18.28 5.47± 0.13 1.12 60.3 1800 2.17 1188 1.96 2.62 14.21 6.78± 0.26 1.04 70.2 2000 2.20 1212 2.31 3.33 16.78 7.60± 0.18 1.05 SO2共300 ppm兲+CH3OH共200 ppm兲, 193 nm 121.0 2000 1.93 965 4.88 8.50 32.50 3.53± 0.08 1.24 80.0 2000 2.13 1145 3.67 5.87 24.44 5.61± 0.09 1.27 65.0 2000 2.23 1246 3.15 5.23 21.01 8.17± 0.16 0.99 51.2 2000 2.35 1372 2.64 3.94 17.57 8.69± 0.17 1.10 40.2 2000 2.51 1550 2.22 3.46 14.78 14.42± 0.48 1.39 35.0 2000 2.60 1649 1.99 2.79 13.29 16.60± 0.90 1.61 SO2共100 ppm兲+CH3OH共300 ppm兲, 193 nm 190.2 2000 1.78 835 2.28 3.95 67.95 1.60± 0.09 1.31 140.2 2000 1.85 893 1.78 5.56 53.11 2.19± 0.05 1.33 113.9 2000 1.96 991 1.58 3.61 47.00 3.03± 0.10 1.07 111.1 2000 1.97 995 1.54 3.56 46.01 3.26± 0.08 1.05 80.5 2000 2.12 1139 1.23 3.30 36.840 4.94± 0.11 0.94 60.0 2000 2.28 1295 1.00 2.75 29.89 8.25± 0.20 1.14 50.8 2000 2.42 1446 0.91 1.79 27.03 11.89± 0.57 1.24 40.1 2000 2.53 1566 0.75 1.50 22.29 16.38± 0.91 1.08 SO2共101 ppm兲+CH3OH共500 ppm兲, 193 nm 160.1 2000 1.80 849 1.96 4.35 96.51 1.67± 0.07 0.98 120.1 2000 1.93 963 1.63 4.66 80.51 3.08± 0.07 1.23 100.0 2000 2.02 1039 1.44 3.31 71.17 3.32± 0.09 1.06 81.4 2000 2.10 1122 1.24 3.20 61.29 4.66± 0.12 1.19 SO2共900 ppm兲+CH3OH共136 ppm兲, 248 nm 60.2 2000 2.27 1284 8.93 2.71 13.53 7.73± 0.36 1.28 50.0 2000 2.30 1315 7.53 1.97 11.40 9.30± 0.45 1.13 50.3 2000 2.37 1393 7.84 2.91 11.88 9.54± 0.35 1.21 45.3 2000 2.43 1455 7.24 2.08 10.97 10.37± 0.64 1.25 41.0 2000 2.48 1513 6.70 2.76 10.14 12.18± 0.59 1.24 35.3 2000 2.59 1641 6.02 2.83 9.12 18.11± 1.41 1.82 30.3 2000 2.70 1766 5.36 3.18 8.11 23.87± 3.83 2.40 30.3 2000 2.71 1775 5.37 2.10 8.13 27.15± 3.97 1.63
work extends the temperature range of study from 1006 to 1777 K. Fitting our results to an Arrhenius equation yields
k1=共2.29 ± 0.18兲 ⫻ 10−10
⫻exp关− 共4210 ± 100兲/T兴 cm3molecule−1s−1 共13兲
for 835⬍T/K⬍1777, in which the listed errors represent one standard deviation in fitting, unless otherwise noted. The observed value of Ea/ R = 4210 K is much greater than the
values Ea/ R = 2530– 2750 K reported previously from
mea-surements below 1000 K,5,6 indicating clearly the non-Arrhenius temperature dependence with an upward curva-ture. Fitting our data combined with the previous results of KTSKM共Ref. 5兲 yields the expression
k1=共2.74 ± 0.07兲 ⫻ 10−18T2.25±0.13
⫻exp关− 共1500 ± 90兲/T兴 cm3molecule−1s−1 共14兲
for 298艋T/K艋1777.
B. Potential-energy surfaces and reaction mechanism
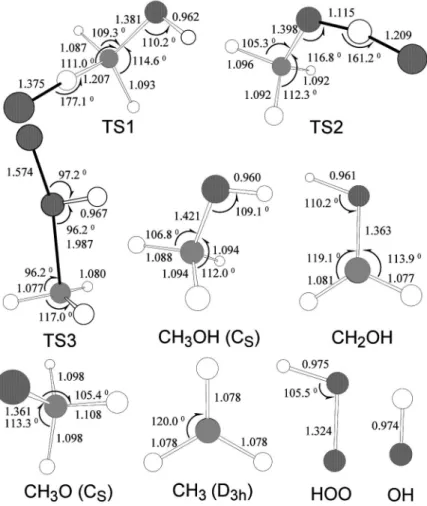
Geometries of the molecular reactant共CH3OH兲,
transi-tion states 共TS1, TS2, and TS3兲, and products 共OH, HO2,
CH3, CH2OH, and CH3O兲 optimized at the B3LYP/6-311
+ G共3df ,2p兲 level are shown in Fig. 4. The potential-energy diagram obtained by the CCSD共T兲/6-311+G共3df ,2p兲 single-point calculations based on the optimized geometries at the B3LYP/ 6-311+ G共3df ,2p兲 level is presented in Fig. 5. The total energies of the reactants and relative energies of the transition states and products are listed in Table IV and the vibrational frequencies and moments of inertia of all spe-cies are summarized in Table V.
The oxygen atom may attack CH3OH at one of the H
atoms of the methyl group关reaction 共1a兲兴, the H atom of the
hydroxyl group 关reaction 共1b兲兴, or the O atom of the hy-droxyl group 关reaction 共1c兲兴. As shown in Fig. 5, reaction 共1a兲 proceeds via TS1 with a barrier of 6.3 kcal mol−1 and
forms CH2OH and OH with energy of −5.5 kcal mol−1
rela-tive to that of the reactants. Reaction共1b兲 proceeds via TS2 with a barrier of 10.6 kcal mol−1 and forms CH
3O and OH
with energy of 2.4 kcal mol−1 above that of the reactants.
Reaction 共1c兲 proceeds via TS3 with a barrier of 52.7 kcal mol−1, giving CH
3 and HO2 with energy of
28.1 kcal mol−1 above that of the reactants; the contribution
of this channel to the rate coefficient is hence negligible in the temperature range of our study. The predicted enthalpies of reaction for the three branching reactions are compared with the experimental values in Table IV. The agreement between theory and experiment is satisfactory.
As shown in Fig. 4, the reacting atoms O, H, and C in TS1 are almost linear with ⬔OHC=177°; the length of the breaking C–H bond increases by 0.12 Å from that of CH3OH. The imaginary vibrational wave number of TS1 is
426i cm−1. For TS2,⬔OHO=161° and the C–H bond length increases by 0.15 Å from that of CH3OH. The imaginary
vibrational wave number of TS2 is 1313i cm−1. The signifi-cant difference between the two imaginary frequencies may be conceived by comparing the lengths of the forming O–H and the breaking C–H bonds in TS1 and TS2, as illustrated in Fig. 4. For TS3, the O–O bond length is 1.574 Å and the C–O bond is 1.987 Å; both are longer than those of HOO and CH3OH. The imaginary vibrational wave number of TS3
is 942i cm−1.
C. Calculation and comparison of rate coefficients
The rate coefficients of reactions共1a兲 and 共1b兲 calculated with TST, CVT, CVT/ZCT, and CVT/SCT methods in the temperature range of 300– 3000 K are presented in Fig. 6. As FIG. 3. Comparison of the total rate coefficient k1predicted with the theoretical calculations共CVT/SCT, dashed line兲 with the experimental results of this work共䉭兲, KTSKM 共䊏兲 共Ref. 5兲, GJ 共䊊兲 共Ref. 6兲, and FSPI 共䉮兲 共Ref. 7兲, and recommendation from Tsang 共dotted line兲 共Ref. 10兲 and Herron 共solid line兲 共Ref. 26兲. Insert: expanded view of our experimental and calculation results. 䊊: SO2共302 ppm兲+CH3OH共102 ppm兲; 䊐: SO2共500 ppm兲+CH3OH共101 ppm兲; 䉱: SO2共208 ppm兲+CH3OH共151 ppm兲; 䉲: SO2共300 ppm兲+CH3OH共200 ppm兲; 䊏: SO2共100 ppm兲+CH3OH共300 ppm兲; ⽧: SO2共101 ppm兲+CH3OH共500 ppm兲; 〫: SO2共900 ppm兲+CH3OH共136 ppm兲, irradiation at 248 nm. Unless otherwise specified, photolysis wavelength is 193 nm.
shown in panels共A兲 and 共B兲 of Fig. 6, the rate coefficients of reactions 共1a兲 and 共1b兲 predicted with TST are similar to those predicted with CVT because of their moderately high barriers. The rate coefficients predicted with CVT/ZCT are smaller than those predicted with CVT/SCT. At 300 K, the rate coefficients of reactions 共1a兲 and 共1b兲 predicted with CVT/SCT are 24 and 10 500 times that predicted with CVT, respectively.
The branching ratio of channels共1a兲 and 共1b兲 predicted with the CVT/SCT method for 300– 3000 K are plotted in Fig. 6共c兲. Reaction 共1a兲 is the major channel at low tempera-tures; its branching ratio decreases from 0.87 at 300 K to
0.50 at 1700 K. Above 1700 K, reaction 共1b兲 becomes the major channel; its branching ratio increases from 0.50 at 1700 K to 0.62 at 3000 K.
In order to compare the predicted rate coefficients with the experimental data quantitatively, we fit the rate coeffi-cients predicted with CVT/SCT in the temperature range of 300– 1000 K to the Arrhenius form to yield
k1a共T兲 = 1.77 ⫻ 10−11
⫻exp关− 共2298/T兲兴 cm3molecule−1s−1, 共15兲
TABLE IV. Total and relative energies共total energies are in a.u. and relative energies are in kcal mol−1兲 of reactants, transition states, and products of the reaction O + CH3OH. Species or reactions zero-point energy B3LYP/ 6-311+ G共3df ,2p兲 CCSD共T兲a/ 6-311+ G共3df ,2p兲 ⌬Hexptb O + CH3OH 0.0511 −190.864 006 −190.468 6391 TS1 −2.3 −1.2 6.3 TS2 −4.7 3.4 10.6 TS3 −2.4 44.7 52.7 CH2OH + OH −3.5 −7.7 −5.5 −6.8± 0.8 CH3O + OH −4.1 −0.5 2.4 1.2± 1.1 HO2+ CH3 −4.5 24.1 28.1 26.3± 0.9 aBased on optimized geometries calculated at B3LYP/ 6-311+ G共3df ,2p兲. bAt 0 K,⌬H
f共in kcal mol−1兲 are as follows: O, 58.98 共Ref. 53兲; CH3OH, 45.43共Ref. 54兲; OH, 8.85±0.07 共Ref. 55兲; HO2, 4.0± 0.8共Ref. 56兲; CH3, 35.86± 0.07 共Ref. 57兲; CH2OH, −2.1± 0.7 共Ref. 58兲; CH3O, 5.9± 1.0 共Ref. 59兲.
FIG. 4. Geometries of reactant CH3OH, three transition states 共TS1, TS2, and TS3兲 and products OH, HO2, CH3, CH2OH, and CH3O of the O + CH3OH system optimized at the B3LYP/ 6-311+ G共3df ,2p兲 level. Listed bond lengths are in angstrom and bond angles are in degree.
FIG. 5. Potential-energy diagram for various channels of the reaction O + CH3OH based on energies calculated with CCSD共T兲/6-311 + G共3df ,2p兲/ /B3LYP/6-311+G共3df ,2p兲. The listed energies are in kcal mol−1.
k1b共T兲 = 1.50 ⫻ 10−11
⫻exp关− 共2845/T兲兴 cm3molecule−1s−1. 共16兲
At higher temperatures, the rate coefficients increase more rapidly with temperature. We fit the rate coefficients pre-dicted with CVT/SCT in the temperature range of 300– 3000 K with a three-parameter function to yield
k1a共T兲 = 8.80 ⫻ 10−20T2.61
⫻exp关− 共941/T兲兴 cm3molecule−1s−1, 共17兲
k1b共T兲 = 4.15 ⫻ 10−23T3.64
⫻exp关− 共974/T兲兴 cm3molecule−1s−1. 共18兲
The predicted total rate coefficients may be expressed with the three-parameter equation
k1共T兲 = 1.93 ⫻ 10−21T3.20
⫻exp关− 共763/T兲兴 cm3molecule−1s−1. 共19兲
The total rate coefficients predicted with CVT/SCT in the temperature range of 300– 3000 K are plotted in Fig. 3 to compare with the experimental data of KTSKM,5GJ,6FSPI,7 and this work. In general, rate coefficients predicted with CVT/SCT are in satisfactory agreement with the experimen-tal values reported previously, indicating that the SCT method treats tunneling effects adequately. At low tempera-tures, the predicted rate coefficients are slightly greater than the experimental values, but within expected uncertainties of calculation and experiments. At high temperatures, the pre-dicted rate coefficients fit satisfactorily with the experimental data of this work and of KTSKM共Ref. 5兲 and GJ.6
Our experimental data are about 20% smaller than the theoretically predicted rate coefficients, but the deviations are within expected uncertainties. The equation reported by Herron26
k1共T兲 = 3.99 ⫻ 10−19T2.50
⫻exp关− 共1550/T兲兴 cm3molecule−1s−1 共20兲
is in satisfactory agreement with our experimental results in
the overlapping temperature range of 1000– 1777 K. The equation reported by Tsang10
k1共T兲 = 6.44 ⫻ 10−19T2.50
⫻exp关− 共1550/T兲兴 cm3molecule−1s−1 共21兲
is slightly greater than our experimental results but appears to fit well with the calculated rate coefficients at high tem-peratures, as illustrated in Fig. 3.
V. CONCLUSION
The total rate coefficients of the reaction O共3P兲
+ CH3OH in the temperature range of 835– 1777 K were
de-termined using a diaphragmless shock tube with atomic reso-nance absorption detection of O atoms. Our results extended the upper limit of the temperature range of study from 1006 to 1777 K and clearly indicate a non-Arrhenius behav-ior of the rate coefficient. The rate coefficients obtained in this work correlate well with those determined pre-viously by Keil et al.;5 they were combined to yield the temperature dependence as k1=共2.74±0.07兲⫻10−18T2.25±0.13
exp关−共1500±90兲/T兴 cm3molecule−1s−1 for 298艋T/K
艋1777. The theoretical calculations at the CCSD共T兲/6-311 + G共3df ,2p兲/ /B3LYP/6-311+G共3df ,2p兲 level predict tran-sition states and barriers for various channels. The rate coef-ficients predicted with CVT/SCT show that branching ratios of two accessible reaction channels to form OH + CH2OH
共1a兲 and OH+CH3O共1b兲 vary with temperature. At 300 K,
reaction 共1a兲 dominates, whereas above 1700 K, reaction 共1b兲 becomes more important. The predicted total rate coef-ficients are in satisfactory agreement with our experimental data at high temperature 共835–1777 K兲 and those reported by Keil et al.5at 298– 998 K.
ACKNOWLEDGMENTS
One of the authors共Y.P.L.兲 thanks the National Science Council of Taiwan共Grant No. NSC93-2119-M-009-002兲 for support. The authors共M.C.L., S.C.X., and Z.F.X.兲 thank the support from the Basic Energy Science, Department of En-ergy, under Contract No. DE-FG02-97-ER14784, and Cherry L. Emerson Center for Scientific Computation of Emory TABLE V. Vibrational wave numbers and moments of inertia Iifor the reactants, transition states, and products
of the reaction O + CH3OH calculated with B3LYP/ 6-311+ G共3df ,2p兲.
Species Ii共a.u.兲 Vibrational wave numbers共cm−1兲
OH 0.0, 3.2, 3.2 3722 HO2 2.9, 53.2, 56.1 1171, 1443, 3613 CH3 6.3, 6.3, 12.5 539, 1407, 1407, 3108, 3284, 3284 CH2OH 9.3, 60.2, 68.9 411, 528, 1054, 1204, 1356, 1483, 3130, 3272, 3851 CH3O 11.4, 64.1, 64.5 684, 960, 1108, 1355, 1366, 1513, 2885, 2959, 3002 CH3OH 14.0, 72.9, 75.5 288, 1043, 1077, 1174, 1366, 1481, 1500, 1511, 2991, 3038, 3107, 3856 TS1 51.5, 357.3, 392.3 137, 289, 476, 958, 1068, 1137, 1160, 1312, 1380, 1420, 1491, 3026, 3138, 3834, 426i TS2 49.1, 285.7, 323.1 142, 167, 189, 616, 1030, 1129, 1150, 1235, 1427, 1435, 1506, 2985, 3043, 3070, 1313i TS3 18.0, 360.8, 366.5 86, 216, 257, 427, 607, 669, 983, 1203, 1422, 1434, 3102, 3258, 3274, 3784, 942i
University for the use of its resources, which are in part supported by a National Science Foundation Grant 共Grant No. CHE-0079627兲 and an IBM Shared University Research Award. Another author共M.C.L.兲 also acknowledges the sup-port from the National Science Council of Taiwan for a Dis-tinguished Visiting Professorship at the National Chiao Tung University in Hsinchu, Taiwan. One of the authors共S.C.X.兲 also thanks the support from Cherry L. Emerson Center for Scientific Computation of Emory University for a Cherry L. Emerson Visiting Fellowship.
1T. J. Held and F. L. Dryer, Int. J. Chem. Kinet. 30, 805共1998兲. 2H. F. LeFevre, J. F. Meagher, and R. B. Timmons, Int. J. Chem. Kinet. 4,
103共1972兲.
3V. Y. Basevich, S. M. Kogarko, and G. A. Furman, Bull. Acad. Sci. USSR, Div. Chem. Sci. Engl. Transl. 948共1975兲; Izv. Akad. Nauk. SSR, Ser. Khi. 1035共1975兲.
4C. M. Owens and J. M. Roscoe, Can. J. Chem. 54, 984共1976兲. 5D. G. Keil, T. Tanzawa, E. G. Skolnik, R. B. Klemm, and J. V. Michael,
J. Chem. Phys. 75, 2693共1981兲.
6H. H. Grotheer and Th. Just, Chem. Phys. Lett. 78, 71共1981兲. 7R. L. Failes, D. L. Singleton, G. Paraskevopoulos, and R. S. Iewin, Int. J.
Chem. Kinet. 14, 371共1982兲.
8L. I. Avramenko, R. V. Kolesnikova, and N. L. Kuzentsova, Izv. Akad. Nauk SSSR, Otd. Khim Nauk 4, 599共1961兲.
9C. Lalo and C. Vermeil, J. Chim. Phys. Phys.-Chim. Biol. 77, 131 共1980兲.
10W. Tsang, J. Phys. Chem. Ref. Data 16, 471共1987兲.
11M. Koshi, M. Yoshimura, K. Fukuda, H. Matsui, K. Saito, M. Watanabe, A. Imamura, and C. Chen, J. Chem. Phys. 93, 8703共1990兲.
12C.-C. Hsiao, Y.-P. Lee, N. S. Wang, J. H. Wang, and M. C. Lin, J. Phys. Chem. A 106, 10231共2002兲.
13K. Tsuchiya, K. Yokoyama, H. Matsui, M. Oya, and G. Dupre, J. Phys. Chem. 98, 8419共1994兲.
14E. F. Greene and J. P. Toennies, Chemical Reactions in Shock Waves 共Academic, New York, 1964兲.
15J. V. Michael, J. Chem. Phys. 90, 189共1989兲.
16J. V. Michael and J. W. Sutherland, Int. J. Chem. Kinet. 18, 409共1986兲. 17S. K. Ross, J. W. Sutherland, S.-C. Kuo, and R. B. Klemm, J. Phys.
Chem. A 101, 1104共1997兲.
18A. D. Becke, J. Chem. Phys. 98, 5648 共1993兲; 96, 2155 共1992兲; 97, 9173共1992兲.
19C. Lee, W. Yang, and R. G. Parr, Phys. Rev. B 37, 785共1988兲. 20K. Raghavachari, G. J. Trucks, J. A. Pople, and M. Head-Gordon, Chem.
Phys. Lett. 157, 479共1989兲.
21J. C. Corchado, Y.-Y. Chuang, P. L. Fast et al.,
POLYRATEVersion 8.7, University of Minnesota, Minneapolis, MN, 2001.
22M. J. Frisch, G. W. Trucks, H. B. Schlegel et al.,
GAUSSIAN 03Revision A.7, Gaussian, Inc., Pittsburgh, PA, 2003.
23S. Satyapal, J. Park, R. Bersohn, and B. Katz, J. Chem. Phys. 91, 6873 共1989兲.
24B. M. Cheng, M. Bahou, W. C. Chen, C.-H. Yu, Y.-P. Lee, and L. C. Lee, J. Chem. Phys. 117, 1633共2002兲.
25
FACSIMILE is a computer software for modeling process and chemical reaction kinetics released by AEA technology, Oxfordshire, United King-dom.
26J. T. Herron, J. Phys. Chem. Ref. Data 17, 967共1988兲.
27K. A. Bhaskaran, P. Frank and Th. Just, Proc. Int. Symp. Shock Tubes Waves 12, 503共1980兲.
28C.-W. Lu, Y.-J. Wu, Y.-P. Lee, R. S. Zhu, and M. C. Lin, J. Phys. Chem. A 107, 11020共2003兲.
29A. Grillo, R. Reed, and M. W. Slack, J. Chem. Phys. 70, 1634共1979兲. 30O. I. Smith, S. Tseregounis, and S.-N. Wang, Int. J. Chem. Kinet. 14, 679
共1982兲.
31D. L. Singleton and R. J. Cvetanovic, J. Phys. Chem. Ref. Data 17, 1377 共1988兲.
32H. J. Plach and J. Troe, Int. J. Chem. Kinet. 16, 1531共1984兲. 33C.-W. Lu, Y.-J. Wu, Y.-P. Lee, R. S. Zhu, and M. C. Lin, J. Chem. Phys.
121, 8271共2004兲.
34W. Tsang and R. F. Hampson, J. Phys. Chem. Ref. Data 15, 1087共1986兲. 35C. L. Yu, C. Wang, and M. Frenklach, J. Phys. Chem. 99, 14377共1995兲. 36A. F. Wagner and D. M. Wardlaw, J. Phys. Chem. 92, 2462共1988兲. 37K. P. Lim and J. V. Michael, Symp. Int. Combust. Proc. 25, 713共1994兲. 38C. T. Bowman, R. K. Hanson, D. F. Davidson et al., http://
www.me.berkeley.edu/griគmech/index.html
39I. T. Woods and B. S. Haynes, Symp. Int. Combust. Proc. 25, 909共1994兲. 40D. L. Baulch, C. J. Cobos, R. A. Cox et al., J. Phys. Chem. Ref. Data 21,
411共1992兲.
41Y. Hidaka, T. Taniguchi, T. Kamesawa, H. Masaoka, K. Inami, and H. Kawano, Int. J. Chem. Kinet. 25, 305共1993兲.
42A. M. Dean, R. L. Johnson, and D. C. Steiner, Combust. Flame 37, 41 共1980兲.
43J. Vandooren and P. J. Van Tiggelen, Symp. Int. Combust. Proc. 16, 1133 共1977兲.
44Y. Hidaka, T. Taniguchi, H. Tanaka, T. Kamesawa, K. Inami, and H. Kawano, Combust. Flame 92, 365共1993兲.
45C. J. Cobos and J. Troe, J. Chem. Phys. 83, 1010共1985兲.
46T. K. Choudhury, Y. He, and W. A. Sanders, J. Phys. Chem. 94, 2394 共1990兲.
47P. H. Gribb, J. E. Dove, and S. Yamazaki, Combust. Flame 88, 169 共1992兲.
48S. C. Li and F. A. Williams, Symp. Int. Combust. Proc. 26, 1017共1996兲. 49W. C. Gardiner, Jr., in Combustion Chemistry, edited by J. Warnatz
共Springer, New York, 1984兲.
50Y. Hidaka, T. Oki, and H. Kawano, J. Phys. Chem. 93, 7134共1989兲. 51R. Atkinson, D. L. Baulch, R. A. Cox, R. F. Hampson, Jr., J. A. Kerr, M. FIG. 6. Theoretically predicted rate coefficients for the reaction O
+ CH3OH in the temperature range of 300– 3000 K. Solid line: CVT with SCT tunneling correction; dotted line: TST; dashed line: CVT; dot-dashed line: CVT with ZCT tunneling correction.共A兲 k1a,共B兲 k1b, and共C兲 branch-ing ratios for reactions共1a兲 and 共1b兲.
J. Rossi, and J. Troe, J. Phys. Chem. Ref. Data 26, 1329共1997兲. 52J. W. Sutherland, P. M. Patterson, and R. B. Klemm, Symp. Int. Combust.
Proc. 23, 51共1991兲.
53M. W. Chase, Jr., C. A. Davies, J. R. Downey, Jr., D. J. Frurip, R. A. McDonald, and A. N. Syverud, J. Phys. Chem. Ref. Data Suppl. 14, 1 共1985兲; see also M. W. Chase, Jr., J. Phys. Chem. Ref. Data Monogr. 9 共1998兲.
54D. D. Wagman, W. H. Evans, V. B. Parker, R. H. Schumm, I. Halow, S. M. Bailey, K. L. Churney, and R. L. Nuttall, J. Phys. Chem. Ref. Data Suppl. 11, 2共1982兲; H. M. Rosenstock, K. Draxl, B. W. Steiner, and J. T.
Herron, J. Phys. Chem. Ref. Data Suppl. 6, 1共1977兲.
55B. Ruscic, A. F. Wagner, L. B. Harding et al., J. Phys. Chem. A 106, 2727共2002兲.
56M. Litorja and B. Rustic, J. Electron Spectrosc. Relat. Phenom. 97, 131 共1998兲.
57B. Rustic, M. Litorja, and R. L. Asher, J. Phys. Chem. A 103, 8625 共1999兲.
58B. Rustic and J. Berkowitz, J. Phys. Chem. 97, 11451共1993兲. 59B. Rustic, E. H. Appelman, and J. Berkowitz, J. Chem. Phys. 95, 7957
共1991兲.