A Novel BLAST-Based Relative Distance (BBRD) Method Can Effectively Group Members of Protein Arginine Methyltransferases and Suggest their Evolutionary Relationship
Yi-Chun Wang1, 2, †, *, Jing-Doo Wang3, 4, †, Chin-Han Chen1, Yi-Wen Chen5, Chuan Li1, 2, *
1 Department of Biomedical Sciences, Chung Shan Medical University. No.110, Sec.1, Jianguo N.
Rd., Taichung 40201, Taiwan
2 Department of Medical Research, Chung Shan Medical University Hospital. No.110, Sec.1,
Jianguo N. Rd., Taichung 40201, Taiwan.
3 Department of Computer Science and Information Engineering, Asia University, No. 500, Lioufeng
Rd. Wufeng District, Taichung 41354, Taiwan.
4 Department of Medical Research, China Medical University Hospital, China Medical University,
Taichung, Taiwan.
5 Department of Life Science, Tunghai University. No.1727, Sec.4, Taiwan Boulevard, Xitun
District, Taichung 40704, Taiwan R.O.C.
† Co-first author
Abstract
We developed a novel BLAST-Based Relative Distance (BBRD) method by Pearson's correlation coefficient to avoid the problems of tedious multiple sequence alignment and complicated outgroup selection. We showed its application on reconstructing reliable phylogeny for nucleotide and protein sequences as exemplified by the fmr-1 gene and dihydrolipoamide dehydrogenase, respectively. We then used BBRD to resolve 124 protein arginine methyltransferases (PRMTs) that are homologues of nine mammalian PRMTs. The tree placed the uncharacterized PRMT9 with PRMT7 in the same clade, outside of all the Type I PRMTs including PRMT1 and its vertebrate paralogue PRMT8, PRMT3, PRMT6, PRMT2 and PRMT4. The PRMT7/9 branch then connects with the type II PRMT5. Some non-vertebrates contain different PRMTs without high sequence homology with the mammalian PRMTs. For example, in the case of Drosophila arginine methyltransferase (DART) and
Trypanosoma brucei methyltransferases (TbPRMTs) in the analyses, the BBRD program grouped
them with specific clades and thus suggested their evolutionary relationships.The BBRD method thus provided a great tool to construct a reliable tree for members of protein families through evolution.
Keywords: BLAST; Pearson's correlation coefficient; evolutionary relationship
1. Introduction
1.1. Motivation of developing the BBRD method
With the vast number of sequences from widely diverse species in the databases, it is feasible for scientists to trace the molecular evolution of their interested targets. Numerous phylogenetic methods, mostly character-based or distance-based, have been developed to reconstruct the
phylogeny and greatly enhanced our analyzing power of the molecular data. However, there are still some limitations or drawbacks that may hinder their application.
statistical techniques for inferring probability distributions to assign probabilities to particular possible phylogenetic trees. Identification of the potential phylogenetic tree requires the smallest total number of evolutionary events to explain the sequence data (Felsenstein, 1973). Other character-based Bayesian methods implement Markov chain Monte Carlo algorithms to recover a tree that represents the most likely clades (Yang and Rannala, 1997; Mau et al., 1999). However, these analyses all involve many computational steps and thus require strong computing power if a large number of sequences are to be analyzed.
The distance-based methods are generally straightforward and can be easily conducted in molecular biology laboratories. Most of the methods require a multiple sequence alignment (MSA) in their initial step (Blair et al., 2010) and a guide tree must be constructed based on the distance scores derived from those sequences. However, manual adjustment of the multiple sequence alignment can be time-consuming as identification of the common conserved region for all of
sequences in comparison might need exhaustive browsing and inspection of the MSA results (Goertzen et al., 2003). It is even difficult to conduct the analyses with
sequences that are very diverse or contain more than one common conserved region. Furthermore, the order of sequence inclusion may affect the result significantly
(Thompson et al., 1994). To avoid the complexity of multiple sequence alignment, many distance-based phylogenetic methods use pairwise alignment methods such as the basic local alignment search tool (BLAST) (Altschul et al., 1990) and its derivatives gapped BLAST and PSI BLAST (Altschul et al., 1997). Other methods evaluate the similarity between sequences, such as Scoredist based on the logarithmic correction of observed divergence among others (Sonnhammer and Hollich, 2005), and the ones based on movements of segments (Varr et al., 1999) using Lempel-Ziv complexity for the distance of sequences (Otu and Sayood, 2003). Kelil et al. (2007) developed a similarity measure called substitution matching similarity (SMS) and derived an alignment-free method CLUSS for protein clustering. However, those alignment-dependent distance measurement
methods are either inefficient to reveal the subtle differences among similar proteins or dependent on the quality of the alignments (Kelil et al., 2007). Additionally, almost all distance-based and most character-based molecular phylogenetic analysis programs require an outgroup (or outgroups) for reference. Appropriate selection of the outgroup requires a sequence that is moderately, but not too closely or distantly related to the sequences of interest (Mount, 2004). Different outgroups may affect the phylogenetic tree markedly (de la Torre-Bárcena et al., 2009, Kirchberger et al., 2014). In this study we showed our development of a BLAST-Based Relative Distance (BBRD) method by Pearson's correlation coefficient to avoid the problems of MSA adjustment, input order, and outgroup selection. The method simply combines the basic local alignment search tool (BLAST) (Altschul et al., 1997) for
sequence comparison, calculates Pearson's correlation coefficient for relative distance, and performed hierarchical clustering for tree construction. In this method we evaluated the distance between two sequences not only based on the direct (absolute) distance between them, but also considered the distances of the two sequences to other input (reference) sequences. The proposed
method can eliminate the requirement of an outgroup sequence and the
phylogenetic tree constructed is unaffected by the input sequence order. After validating the feasibility and reliability of the method for constructing
phylogenetic trees for both nucleotide and protein sequences, we used it to analyze our interested targets, protein arginine methyltransferases (PRMTs, Table 1).
1.2. Protein arginine methyltransferases
PRMTs catalyze the transfer of methyl groups from the methyl group donor S-adenosylmethionine (AdoMet) to specific guanidino nitrogen atoms of arginine and can be divided by the ways the
methyl groups are attached. Type I, type II and type III PRMT catalyzes the formation of asymmetric -NG, NG dimethylarginine (aDMA), symmetric -NG, NG’ dimethylarginine (sDMA), and- NG monomethylarginine (MMA) respectively. The type IV activity that catalyzes the formation of - NG methylarginine has only been reported for yeast RMT2 (Bedford and Clarke, 2009; Wang and Li, 2012). After the identification of PRMT1 (Lin et al., 1996), the PRMT genes were designated by sequence homology and numbered according to the identification order. PRMT1, 2, 3, 4, 6 and 8 belong to type I and PRMT5 belongs to type II PRMT (Wang and Li, 2012). Recently PRMT7 has been shown to be a type III enzyme (Zurita-Lopez et al., 2012; Feng et al., 2013).
We have analyzed homologous genes for PRMT1–8 identified in humans and fish (puffer fish,
Fugue rubripes, and zebrafish, Danio rerio) and have shown their conserved amino acid sequences
and gene structures (Hung and Li, 2004). We reviewed the studies of PRMTs in non-mammalian systems and also used nine PRMTs identified in mammals (human) as the templates to survey homologous PRMTs in ten non-mammalian animal species including vertebrates, invertebrate chordates, echinoderms, arthropods, nematodes and cnidarians that have a completed genomic sequence (Wang and Li 2012). As more species have been sequenced and more sequence data are available, we would like to construct a more detailed and thorough phylogenetic tree of PRMTs. In this study we analyzed 124 PRMT sequence entries collected from 22 different species by the newly developed BLAST-based relative distance (BBRD) method to construct the tree.
2. Materials and methods
2.1. Methods used in validation
The methods, DNA_ML, DNA_Pars, Pro_ML, and Prodist_Fitch, used to verify the feasibility and reliability of our method are programs from the PHYLIP program package (Felsenstein, 1989).
2.2. Procedures of the BBRD method
downloaded at ftp://ftp.ncbi.nlm.nih.gov/blast/executables/blast+/LATEST/. The relationship of sequences was then constructed by 5 steps:
1. A self pairwise alignment of sequence dataset was performed with BLAST.
2. The BLAST total score matrix (BTSM) was constructed from the BLAST results. BTSM(Pi, Pj) denotes the value of the entry in the ith row and jth column of the BTSM. It refers to the summation of the scores of all high-scoring segment pairs (HSPs) of sequence Pi to another sequence Pj.
3. The BLAST total score matrix was converted to a sequences relative distance matrix (SRDM). The relative distance of Pi and Pj was determined by the Pearson's correlation coefficient (Bulmer, 1979) between the series of total scores of Pi related to the other sequences and that of Pj related to the others. Let Series(Pi) denote a series of values in the ith row of the BTSM matrix.
Intuitively, the values within the Series(Pi) represent the similarities of Pi in relation to other sequences, respectively. The series of Series(Pi) is similar to that of Series(Pj) if Pi is similar to the Pj. The similarities between the two series of Series(Pi) and Series(Pj) were evaluated by defining and computing the relative distance of two sequences. Basically, sequence relative distance matrix (SRDM) denotes the matrix containing the relative distances of any two sequences. The value of the SRDM(Pi; Pj) was defined as
SRDM(Pi; Pj) = (1−PCCM(Series(Pi); Series(Pj)).
The PCCM(Series(Pi); Series(Pj)) is the matrix of Pearson's Correlation Coefficient of the two series, Series(Pi) and Series(Pj). Notably, the value of SRDM(Pi; Pj) was between 0 and 2. 4. Sequences relationships were constructed via SRDM. The relationship diagram of selected
sequences was constructed based on the single-linkage algorithm (Han et al., 2006). It is one of the hierarchical clustering methods that repeatedly merges two groups with the smallest relative distance until only one group is left. The elements in matrix SRDM were sorted based on their values in an increasing order list. One SRDM(Pi; Pj) (1 ≤ i; j ≤ n) with the smallest values was then extracted from the sorted list, as mentioned above. Next, whether two groups, containing Pi
and Pj respectively, were the same or not was verified. The two groups were merged if Pi and Pj were not in the same group, followed by recording the value of SRDM(Pi; Pj) as the relative distance of those two groups. The steps were repeated until all sequence groups were merged into one or the distance between two nearest remaining groups was larger than a given threshold. 5. Sequences relationship diagrams were constructed. Dendroscope version 3.2.10 built 19 (Huson
and Scornavacca, 2012) was used to present and adjust the sequence relationship.
2.3. Domain Structure comparison
Human PRMT5, PRMT7, and PRMT9 domain structures were depicted from GenPept records and aligned together according to the AdoMet_MTase region.
3. Results
3.1. Developing of the BBRD method
At the initial stage of developing the BBRD method, we selected the highest high-scoring segment pair (HSP) of each sequence pair to calculate the sequence relative distance matrix (SRDM). Yet, the tree constructed with the matrix was not satisfactory. We then took all HSPs of a given sequence pair into account to build the BLAST total score matrix (BTSM) and transformed BTSM to SRDM. Utilizing the BLAST total score overcame the limitations of low sensitivity for high similarity sequences, especially those with tandem domains, inverted repeats (e.g., regulatory elements in DNA), domain swaps or scattered conservative short motifs. The influence (false positive hits) of short tandem repeats or low complexity sequences was eliminated by employing the "low complexity filter" or "repeat mask" in BLAST parameter settings. BLAST total score calculation increased the scoring range of compared sequences, thus raising the resolution power for evolutionarily closely related (high similarity) sequences. Consequently, modification of the scoring scheme greatly improved the output tree.
The BBRD tools can be downloaded at http://tm.asia.edu.tw/tools/. The hardware requirement for installing the program is low (memory more than 4 GB is recommended). BBRD can be run in
Linux, Mac OS or Windows system.
3.2. Validation of the BBRD method using cDNA Sequences
To evaluate whether the BBRD method could efficiently construct a reasonable phylogenetic tree, we first conducted a tree construction with nucleotide sequences. The selected nucleotide sequence was the cDNA sequence of fragile X mental retardation 1 (fmr-1) gene that widely exists in
vertebrates. Its protein product fragile X mental retardation protein (FMRP) is responsible for nucleocytoplasmic shuttling of mRNA, dendritic mRNA localization, synaptic protein synthesis (Antar et al., 2005), and synaptic plasticity (Huber et al., 2002). We used human FMR-1 as the template to identify its homologues in eighteen vertebrate species that have diverged approximately 340 million years ago (Supplementary Table 1).
Even though the evolutionary tree of a specific gene at the DNA or protein level may not be consistent with that of the species due to horizontal gene transfer, genetic recombination or even convergent evolution, a taxonomy common tree of the species would still be a good indication for the evolutionary relationships of the sequences. We thus used the NCBI taxonomy common tree (species tree) as the reference for both DNA and protein data validation. It is apparent that the taxa grouping and the tree topology of BBRD tree for fmr-1 correlate well with that of the NCBI taxonomy common tree (Fig. 1a, b).
In addition, we performed the analyses with two commonly used methods, maximum likelihood method (DNA_ML) and maximum parsimony method (DNA_Pars). We used two character-based methods for comparison because the frequently used distance-based method DNAdist_NJ of the PHYLIP package was not able to complete the analyses with the default settings due to the large sequence differences. Topologies of the DNA_ML tree (Fig. 1c) and DNA_Pars tree (Fig. 1d) closely resembled each other, yet differed from the taxonomy common tree and BBRD tree markedly.
3.3. Validation of the BBRD method using Protein Sequences
We then assessed whether the BBRD method could also construct reliable trees from protein sequences. Dihydrolipoamide dehydrogenases, a common component of dehydrogenase complexes highly conserved from prokaryotes to eukaryotes, were selected to evaluate the feasibility of our method. We used the human sequence as the query to search against the protein sequence database. Twenty five sequences belonging to different eukaryotic species that have diverged approximately 760–1060 million years ago (Lucking R et al., 2009) (Supplementary Table 2) were subjected to BBRD and two commonly used methods, Pro_ML (character-based) and Prodist_Fitch (distance-based). The taxa clustering and topology of the BBRD tree are very similar to those of the NCBI common tree (Fig. 2a, b), whereas those of the Pro_ML and Prodist_Fitch trees were apparently different (Fig. 2c, d).
3.4. Phylogenetic tree of PRMTs
We used nine human PRMTs as the templates to search for homologues in different species
belonging to different phyla/classes. One hundred and twenty four PRMT proteins from twenty two representative species were included. The entries used in this study are summarized in Table 1. We then constructed the overall PRMT tree. Our method successfully separated one PRMT from other PRMTs with no exception (Supplementary Fig. 1; Supplementary file Fig. S1.nexml). To illustrate the results concisely, we showed an outline tree in Fig. 3a. PRMT1 and its vertebrate paralogue PRMT8 grouped together clearly. This clade then connects with PRMT3 (Fig. 3b). The method then put other type I PRMT 2 and 6, then 4 into one subdivision (Fig. 3c). The other subdivision contains PRMT7 and 9, and then 5 (Fig. 3d). The tree is very similar to the tree we constructed previously (Hung and Li, 2004), with the addition of PRMT9 (PRMT9 4q31, previously designated as
PRMT10). Even though PRMT9 has been identified and suggested as a PRMT for a few years, no further analyses have been conducted on this gene and no catalytic activity of this PRMT has been
suggested. As shown in Fig. 3, PRMT9 is subgrouped with PRMT7, outside all of the type I PRMTs. Even though type II activity was suggested for PRMT7 in early studies, recent investigations provide strong evidence for the type III activity of PRMT7 (Zurita-Lopez et al., 2012; Feng et al., 2013). PRMT5 is present in a different branch with all other PRMTs, indicating its specific type II activity. In addition to our method, two other methods were also performed to analyze the PRMT families. The popular traditional methods DNA(Pro)_ML, DNA_Pars, and Prodist_Fitch used in the previous BBRD method validation stage did not generate a tree with satisfactory evolutionary relatedness. We thus chose two other methods that were developed more recently. One of these methods is a
distance-based CLUSS program (web service:
http://prospectus.usherbrooke.ca/CLUSS/Server/Index.html). The Supplementary Fig. 2 shows that the CLUSS tree has a "binary clustering" property. The clustering of families is similar to our tree but with some taxa placed in different PRMT groups. The clearest example is that PRMT6 of
Strongylocentrotus purpuratus is grouped with PRMT2, and PRMT3 of Drosophila malanogaster is
outside the PRMT1/8-3-6-2 branch. Another method performed is a character-based Mr. Bayes program (download site: http://mrbayes.sourceforge.net/download.php), a very popular Bayesian method. The major differences between Bayes tree and our tree are the family relationship and multi-furcating root in the Bayes tree (Supplementary Fig. 3). A minor difference is that the Bayes tree placed a PRMT9 from Ciona into the PRMT7 family.
Interestingly, PRMT9 of C. elegans and A. suum tend to be placed outside the PRMT9 group by these two methods but not BBRD. The major difference of the trees is their placement of PRMT5, 7, and 9. CLUSS places PRMT7 with other type I PRMTs, then PRMT9, then PRMT5. Mr. Bayes places PRMT5 with other type I PRMTs first and then the branch of PRMT7 with PRMT9.
3.5. Determination of the evolutionary relationship of PRMTs outside of the vertebrate systems It is known that some eukaryotes that are evolutionarily distant from mammals contain different PRMTs that do not show high sequence homology with the
mammalian PRMTs. The protein arginine methyltransferases in Drosophila melanogaster (designated as DARTs) have been described by Boulanger et al., 2004. There are nine DARTs and four of them, DART1, 4, 5 and 7 share high sequence homologies with the mammalian PRMTs with the same numeral. Other DARTs were reported to share highest similarity with PRMT1. In this analysis we re-examined the phylogenetic relationships of these DARTs. DART3 appeared to be closely related with other PRMT3s in Fig. 1. We then included the Drosophila DART2, 6, 8, and 9 for the phylogenetic analyses (Supplementary Table 3). DART 2, 6, 9 are restricted in Drosophila species while DART 8 appears to be present broadly in insects. To avoid the bias of a single sequence presentation, we included DART 2, 6, 8, 9 from five different Drosophila species, and DART8 from six more insect species.
As outlined in Fig. 4a and detailed in Supplementary Fig. 4 (Supplementary file Fig. S4.nexml), we found that DART2s are most closely related to the PRMT1/3 cluster and are located between all other PRMT3s and the PRMT3 of S. pombe. DART6s are located between the PRMT1/3 cluster and PRMT6. DART8s are widely distributed in insects and are between PRMT6 and PRMT2. DART9 is outside of other type I PRMTs and is between the putative type I/non-type I (PRMT7, 9 and 5) branches.
PRMTs and protein arginine methylation have been intensely investigated as an early branching eukaryoteTrypanosoma brucei, the etiologicalparasitic protozoanthat causesAfrican sleeping sickness (Pasternack et al., 2007; Fisk et al., 2009; Fisk et al., 2010; Fisk and Read, 2011; Lott et al., 2013; Lott et al., 2014). Five PRMT sequences of Trypanosoma brucei gambiense DAL 972
(TbPRMT1, 3, 5, 6, and 7; Supplementary Table 4) were obtained by BLAST search from a protein database with Trypanosoma brucei brucei TREU927 queries. As the outlined tree shows in Fig. 4b and the detailed tree shows in Supplementary Fig. 5 (Supplementary file Fig. 5S.nexml), TbPRMT1, TbPRMT5, and TbPRMT7 cluster with the PRMT cladeswith the same numeralas the most outside one of each clade. TbPRMT3 and TbPRMT6 are at the outmost of thePRMT1/8-3-6-2 branchand
are placed between that branch and the PRMT4 clade.
4. Discussion
In this study we introduced the novel BBRD method to reconstruct reliable phylogenies. We used the NCBI taxonomy common tree (species tree) as the reference for both DNA and protein data
validation. The DNA/protein tree of specific genes determined by BBRD may not be completely consistent with the species tree, but the variation is limited and small and might be explained by varying evolutionary rates of the genes among the species. However, the tree determined by some popular traditional methods showed some significant deviation from the species tree. We thus are confident that BBRD can analyze both nucleotide and protein sequences with superior tree construction.
The two critical steps of the BBRD method are calculation of the total score of a given sequence pair using BLAST, and then determination of the relative distance of two sequences by Pearson's
correlation coefficient. The advantage of employing Pearson's correlation coefficient to construct the relative distance is that the correlation coefficient of a given sequence set is determined by the sequences within the set, that is, the outgroup is not needed. If two sequences have no homology or the homology is low enough, the BLAST total score will be zero, and then the relative distance of these two sequences will not be evaluated by each other. In this way we can reduce the potential problem of Pearson's correlation coefficient that might distort the results due to inappropriate data (outliers) in the dataset. Theoretically, more homologous entries in the dataset will have more accurately clustering output. However, from the preliminary analysis of PRMT sequences we found that partial sequences affect the clustering result. Therefore, we carefully examined the PRMT sequences and all partial PRMT sequences were excluded from this study.
When inspecting each PRMT family grouping by BBRD and Mr. Bayes trees (Supplementary Fig. 1 and Supplementary Fig. 3), both trees have their specific strong points in taxa clustering. For
other PRMTs without confusion. However, compared to the Mr. Bayes method that requires a two-week calculation period using personal computer analyses, BBRD only used less than 5 minutes to complete the tree construction. Therefore, the BBRD method we developed is an efficient method in both time consumption and tree accuracy.
In addition, the phylogenetic analyses of the PRMT family members revealed the strength of BBRD in resolving related protein sequences. As indicated previously, homologues of the nine mammalian PRMT genes were distributed differently in eukaryotes and probably are evolved from different times with different rates (Wang and Li, 2012). With the broad selection of PRMTs from
representative species, in this study we showed that for the type I enzymes, PRMT1associates with its vertebrate paralogue PRMT8, and then groups with PRMT3. They then connect with PRMT2, PRMT6 and finally PRMT4 (CARM1). The order is the same as determined by CLUSS, but deviates from that by Mr. Bayes, which place PRMT6 as the most outside group of the type I PRMTs.
Over all the major difference of the three methods is their placement of PRMT5, 7, and 9. BBRD puts PRMT9 with PRMT7 in one division, outside all of the type I PRMTs, and then connects with the type II PRMT5. In this way PRMT5 is present in a different branch with all other PRMTs, indicating a specific type II activity. Mr. Bayes also placed PRMT7 with PRMT9 in one cluster as BBRD. However, it puts PRMT5 with all type I PRMTs and then the whole branch connects with the PRMT7/9 cluster. CLUSS groups PRMT7 with other type I PRMTs, then PRMT9, then the type II PRMT5.
In principle, the BLAST total score is positively correlated with the sequence length for homologous sequences. It thus raised the possibility that the clustering of PRMT9 and PRMT7 are both much longer (about 700~850 amino acid residues) than other PRMTs (about 300~500 amino acid
residues). However, the length would not affect our clustering result because the relative distance of a given sequence pair calculated by Pearson's correlation coefficient is determined by the rest of the sequences in the dataset (see 2.2. Procedures of BBRD method, step 3). Thus, PRMT9 clustered with
PRMT7 is not due to the long protein sequence.
The activity of PRMT9 has not been biochemically characterized. Recent investigations showed that PRMT7 is most likely to be a type III enzyme that catalyzes the formation of monomethylarginines but not dimethylarginines (Zurita-Lopez et al., 2012; Feng et al., 2013). Structural analyses showed that the tandem PRMT core domain in PRMT7 can form a homodimer-like structure (Hasegawa et al., 2014), which is similar to the dimers of other PRMTs that are required for their methyltransferase activities. However, only the N-terminal but not the degenerate C-terminal core of PRMT7 can bind to AdoMet and catalyze methylarginine formation (Hasegawa et al., 2014). Recent annotation of human PRTM9 (gi: 74758248) shows that it also contains a PRMT domain with an AdoMet binding motif in the N-terminal half and another PRMT domain without the binding motif in the C-terminal half. We carefully examined the sequences and the alignment of the designated domain structures of PRMT5, PRMT7 together with PRMT9. The results, illustrated in Fig.5,show that PRMT9 and PRMT7 both contain a C-terminal degenerate PRMT domain with a degenerate AdoMet binding motif. We thus consider the phylogenetic relationship with PRMT9 to becloser to PRMT7 than to PRMT5. As BBRD groups PRMT9 with PRMT7 in one cluster and separates the cluster with both type I and type II PRMTs, we suspect that PRMT9 might also be a type III enzyme. However, the classification requires further experimental validation.
We have also used BBRD to analyze the PRMT genes that are not orthologues of the mammalian PRMTs, such as the Drosophila-specific PRMTs DART 2, 6, 8 and 9. We showed that BBRD can quickly demonstrate the phylogenetic relationships of these PRMTs. Similarly, we revealed that two Trypanosome type I PRMTsTbPRMT3 and TbPRMT6 are placed between the PRMT2 and PRMT4 clades but not clustered with the PRMT3 or PRMT6 clades.The method thus should be a powerful tool to trace the PRMT modification system in different species.
Posttranslational modification (PTM) can exert its function through the network of the writes (enzymes that add the modification), erasers (enzymes that remove the modification) and readers
(factors that can bind to the modification). Compared with other posttranslational modification systems, the writers (PRMTs) of protein arginine methylation are best studied. Putative demethylase erasers such as peptidylarginine deiminases (PADIs) that may convert MMA residues into citrullines (Cuthbert et al., 2004; Wang et al., 2004) or JMJD6 that is likely to remove one methyl group from DMAs (Chang et al., 2007) have been reported. However, there were few follow-up studies and the reaction catalyzed by PADI4, the only PADI that can convert MMA, is deimination but not
demethylation. Moreover, besides demethylation, JMJD6 appears to catalyze lysyl-hydroxylation reactions (Webby et al., 2009). Unlike many reader domains identified for methyllysines, the only well studied methylarginine reader is the Tudor domain (Gayatri et al., 2014; Chen et al., 2011; Côté et al., 2005). However, only a subset of Tudor domains with narrower aromatic cages binds to methylarginine rather than methyllysines.
5. Conclusions
In this study we traced the evolutionary relationship of PRMTs by the BBRD method that we
developed; similar studies can be conducted for the putative protein arginine methylation erasers and readers to have a better view on the modification network. We expect that the BBRD method will contribute to this kind of study.
Acknowledgements
This work was partially supported by the grants NSC 101-2320-B-040-004 from National Science Council, Taiwan and CSMU-INT-102-10 from Chung Shan Medical University to Chuan Li and 102-asia-38 of Asia University, Taiwan to Jing-Doo Wang.
References
Altschul, S.F., Gish, W., Miller, W., Myers, E.W., Lipman, D.J., 1990. Basic local alignment search tool. J. Mol. Biol. 215, 403–410.
Altschul, S.F., Madden, T.L., Schffer, A.A., Zhang, J., Zhang, Z., Miller, W., Lipman, D.J., 1997. Gapped BLAST and PSI BLAST: a new generation of protein database search programs. Nuc. Acids Res. 25, 3389–3402.
Antar, L.N., Dictenberg, J.B., Plociniak, M., Afroz, R., Bassell, G.J., 2005. Localization of FMRP-associated mRNA granules and requirement of microtubules for activity-dependent trafficking in hippocampal neurons. Genes, Brain and Behavior 4, 350–359.
Bedford, M.T., Clarke, S.G., 2009. Protein arginine methylation in mammals: who, what, and why. Mol. Cell 33, 1–13.
Blair, C., Murphy, R.W., 2010. Recent trends in molecular phylogenetic analysis: Where to next? J. of Heredity 102, 130–138.
Boulanger, M.C., Miranda, T.B., Clarke, S., Di Fruscio, M., Suter, B., Lasko, P., Richard, S., 2004. Characterization of the Drosophila protein arginine methyltransferases DART1 and DART4. Biochem. J. 379, 283–289.
Bulmer, J., 1979. Principles of Statistics, 2nd ed. Dover Publications Inc., New York.
Chang, B., Chen, Y., Zhao, Y., Bruick, R.K., 2007. JMJD6 is a histone arginine demethylase. Science 318, 444–447.
Chen, C., Nott, T.J., Jin, J., Pawson, T., 2011. Deciphering arginine methylation: Tudor tells the tale. Nat. Rev. Mol. Cell Biol. 12, 629–42.
Côté, J., Richard, S., 2005. Tudor domains bind symmetrical dimethylated arginines. J. Biol. Chem. 280, 28476–83.
Cuthbert, G.L., Daujat, S., Snowden, A.W., Erdjument-Bromage, H., Hagiwara, T., Yamada, M., Schneider, R., Gregory, P.D., Tempst, P., Bannister, A.J., Kouzarides, T., 2004. Histone deimination antagonizes arginine methylation. Cell 118, 545–553.
de la Torre-Bárcena, J.E., Kolokotronis, S.-O., Lee, E.K., Stevenson, D.W., Brenner, E.D., 2009. The Impact of Outgroup Choice and Missing Data on Major Seed Plant Phylogenetics Using Genome-Wide EST Data. PLoS ONE 4(6): e5764. doi:10.1371/journal.pone.0005764.
Felsenstein, J., 1973. Maximum likelihood and minimum-steps methods for estimating evolutionary trees from data on discrete characters. Systematic Zoology 22, 240–249.
Felsenstein, J., 1989. PHYLIP - phylogeny inference package (version 3.2). Cladistics 5, 164–166. Feng, Y., Maity, R., Whitelegge, J.P., Hadjikyriacou, A., Li, Z., Zurita-Lopez, C., Al-Hadid, Q., Clark, A.T., Bedford, M.T., Masson, J.-V., Clarke, S.G., 2013. Mammalian Protein Arginine
Methyltransferase 7 (PRMT7) Specifically Targets RXR Sites in Lysine- and Arginine-rich Regions. J. Biol. Chem. 288, 37010–37025.
Fisk, J.C., Sayegh, J., Zurita-Lopez, C., Menon, S., Presnyak, V., Clarke, S.G., Read, L.K., 2009. A type III protein arginine methyltransferase from the protozoan parasite Trypanosoma brucei. J. Biol. Chem. 284, 11590–11600.
Fisk, J.C., Zurita-Lopez, C., Sayegh, J., Tomasello, D.L., Clarke, S.G., Read, L.K., 2010. TbPRMT6 Is a Type I Protein Arginine Methyltransferase That Contributes to Cytokinesis in Trypanosoma brucei. Eukaryotic Cell 9, 866–877.
Fisk, J.C., Read, L.K., 2011. Protein Arginine Methylation in Parasitic Protozoa. Eukaryot Cell 10, 1013–1022.
Gayatri, S., Bedford, M.T., 2014. Readers of histone methylarginine marks. Biochim. Biophys. Acta. 1839, 702–710.
Goertzen, L.R., Cannone, J.J., Gutell, R.R., Jansen, R.K., 2003. ITS secondary structure derived from comparative analysis: implications for sequence
alignment and phylogeny of the Asteraceae. Mol. Phylogenet. Evol. 29, 216–234. Han, J., Kamber, M., Pei, J., 2006. Data Mining: Concepts and Techniques, 2nd ed. (The Morgan Kaufmann Series in Data Management Systems). Morgan Kaufmann, Burlington.
methyltransferase 7 has a novel homodimer-like structure formed by tandem repeats. FEBS Letts 588, 1942–1948.
Huber, K.M., Gallagher, S.M., Warren, S.T., Bear, M.F., 2002. Altered synaptic plasticity in a mouse model of fragile X mental retardation. Proceedings of the National Academy of Sciences 99, 7746– 7750.
Hung, C.M., Li, C., 2004. Identification and phylogenetic analyses of the protein arginine methyltransferase gene family in fish and ascidians. Gene 340, 179–187.
Huson, D.H., Scornavacca, C., 2012. Dendroscope 3: An interactive tool for rooted phylogenetic trees and networks. Syst. Biol. 61, 1061–1067.
Kelil, A., Wang, S., Brzezinski, R., Fleury, A., 2007. Cluss: Clustering of protein sequences based on a new similarity measure. BMC Bioinformatics 8, 286–305.
Kirchberger, P.C., Sefc, K.M., Sturmbauer, C., Koblmüller, S., 2014. Outgroup effects on root position and tree topology in the AFLP phylogeny of a rapidly radiating lineage of cichlid fish. Mol. Phylogenet. Evol. 70, 57–62.
Kolaczkowski, B., Thornton, J.W., 2009. Long-Branch Attraction Bias and Inconsistency in Bayesian Phylogenetics. PLoS ONE 4(12): e7891.
Larget, B., 2013. The Estimation of Tree Posterior Probabilities Using Conditional Clade Probability Distributions. Systematic Biology 62, 501–511.
Lin, W.J., Gary, J.D., Yang, M.C., Clarke, S., Herschman, H.R., 1996. The mammalian immediate-early TIS21 protein and the leukemia-associated BTG1 protein interact with a protein-arginine N-methyltransferase. J. Biol. Chem. 271, 15034–15044.
Liu, K., Raghavan, S., Nelesen, S., Linder, C.R., Warnow, T., 2009. Rapid and accurate large-scale coestimation of sequence alignments and phylogenetic trees. Science 324, 1561–1564.
Lott, K., Li, J., Fisk, J.C., Wang, H., Aletta, J.M., Qu, J., Read, L.K., 2013. Global proteomic analysis in trypanosomes reveals unique proteins and conserved cellular processes impacted by arginine methylation. J. Proteomics 91, 210–225.
Lott, K., Zhu, L., Fisk, J.C., Tomasello, D.L., Read, L.K., 2014. Functional interplay between protein arginine methyltransferases in Trypanosoma brucei. Microbiologyopen 3, 595–609.
Lucking, R., Huhndorf, S., Pfister, D., Plata, E.R., Lumbsch, H., 2009. Fungi evolved right on track. Mycologia 101, 810–822.
Lunter, G., Miklós, I., Drummond, A., Jensen, J.L., Hein, J., 2005. Bayesian coestimation of phylogeny and sequence alignment. BMC Bioinformatics 6, 83–93.
Löytynoja, A., Goldman, N., 2009. Uniting alignments and trees. Science 324, 1528–1529.
Mau, B., Newton, M.A., Larget, B., 1999. Bayesian phylogenetic inference via Markov chain Monte Carlo methods. Biometrics 55, 1–12.
Mount, D.M., 2004. Bioinformatics: Sequence and Genome Analysis 2nd ed. Cold Spring Harbor Laboratory Press, New York.
Otu, H.H., Sayood, V., 2003. A new sequence distance measure for phylogenetic tree construction. Bioinformatics 19, 2122–2130.
Pasternack, D.A., Sayegh, J., Clarke, S., Read, L.K., 2007. Evolutionarily divergent type II protein arginine methyltransferase in Trypanosoma brucei. Eukaryot Cell 6, 1665–1681.
Sankoff, D., Morel, C., Cedergren, R., 1973. Evolution of 5s rna and the non-randomness of base replacement. Nat. New Biol. 245, 232–234.
Sonnhammer, E.L.L., Hollich, V., 2005. Scoredist: a simple and robust protein sequence distance estimator. BMC Bioinformatics 6, 108–116.
Thompson, J., Higgins, D., Gibson, T., 1994. CLUSTAL W: improving the sensitivity of progressive multiple sequence alignment through sequence weighting, position-specific gap penalties and weight matrix choice. Nuc. Acids Res. 22, 4673–4680.
Varr, J.-S., Delahaye, J.-P., Rivals, E., 1999. Transformation distances: a family of dissimilarity measures based on movements of segments. Bioinformatics 15, 194–202.
Wang, Y., Wysocka, J., Sayegh, J., Lee, Y.H., Perlin, J.R., Leonelli, L., Sonbuchner, L.S., McDonald, C.H., Cook, R.G., Dou, Y., Roeder, R.G., Clarke, S., Stallcup, M.R., Allis, C.D.,
Coonrod, S.A., 2004. Human PAD4 regulates histone arginine methylation levels via demethylimination. Science 306, 279–283.
Wang, Y.-C., Li, C., 2012. Evolutionarily conserved protein arginine methyltransferases in non-mammalian animal systems. FEBS 279, 932–945.
Webby, C.J., Wolf, A., Gromak, N., Drege,r M., Kramer, H., Kessler, B., Nielsen, M.L., Schmitz, C., Butler, D.S., Yates, J.R. 3rd, Delahunty, C.M., Hahn, P., Lengeling, A., Mann, M., Proudfoot, N.J., Schofield, C.J., Bottger, A., 2009. Jmjd6 catalyses lysyl-hydroxylation of U2AF65, a protein associated with RNA splicing. Science 325, 90–93.
Yang, Z., Rannala, B., 1997. Bayesian phylogenetic inference using DNA sequences: a Markov Chain Monte Carlo Method. Molecular Biology and Evolution 14, 717–724.
Zurita-Lopez, C.I., Sandberg, T., Kelly, R., Clarke, S.G., 2012. Human Protein Arginine Methyltransferase 7 (PRMT7) Is a Type III Enzyme Forming ω-NG-Monomethylated Arginine
Figure legends
Fig. 1. Trees of fmr-1 cDNAs. (a) BBRD tree. (b) NCBI taxonomy common tree. (c) DNA_ML tree. (d) DNA_Pars tree. The NCBI taxonomy common tree is for reference. The Western clawed frog is most distant in evolution from other species in this analysis, and thus was dedicated as the outgroup for DNA_ML and DNA_Pars.
Fig. 2. Trees of dihydrolipoamide dehydrogenases. (a) BBRD tree. (b) NCBI taxonomy common tree. (c) Pro_ML tree. (d) Prodist_Fitch tree. The NCBI taxonomy common tree is for reference. The sequence of the most distant Schizosaccharomyces pombe was dedicated as the outgroup.
Fig. 3. Phylogenetic tree of PRMTs. (a) The summary of the relationships of 9 different PRMTs. (b) Sub-tree of PRMT1, PRMT8, and PRMT3. (c) Sub-tree of PRMT6, PRMT2, and PRMT4. (d). Sub-tree of PRMT7, PRMT9, and PRMT5.
Fig. 4. Phylogenetic tree of DARTs and TbPRMTs. (a) Different PRMTs are outlined with DARTs shown in detail. (b) Different PRMTs are outlined with TbPRMTs shown in detail.
Fig. 5. Alignment of domain structure of human PRMT5, PRMT7, and PRMT9. We obtained GenPept records for PRMT5 (gi: 32171585), PRMT7 (gi: 20137529) and PRMT9 (gi: 74758248) and aligned sequences. The "PRMT domains" in purple are the regions that can align with human PRMT1 and are consistent with the regions designated as the "SAM-dependent MTase PRMT domain" (ECO:0000255|PROSITE-ProRule:PRU01015) in the annotation. The "degenerate PRMT domains" in the C-termini of PRMT7 and 9 only partially align with PRMT1 but can fully align with their N-terminal PRMT domains. The "AdoMet binding motifs" shown in green are according to the alignment with that in PRMT1and are consistent with the "S-adenosylmethionine binding site" and "SAM-dependent MTase" features in the annotation. The "degenerate AdoMet binding motif" indicates the region that can be aligned with low similarity but are not functional in AdoMet binding. The "double E loop" and the "THW loop" that are critical for PRMT activity have also been
illustrated. The amino acid sequences corresponding to the typical "THW" residues in the PRMTs are shown. TRP motifs (tetratricopeptide repeat domain) are only present in the N-terminus of PRMT9.
Supplementary Fig. 2. CLUSS tree of PRMT1 to PRMT9. Supplementary Fig. 3. Mr. Bayes tree of PRMT1 to PRMT9.
Supplementary Fig. 4. Complete BBRD tree of PRMT1 to PRMT9 with DART2, 6, 8, and DART9. Supplementary Fig. 5. Complete BBRD tree of PRMT1 to PRMT9 with five TbPRMTs.
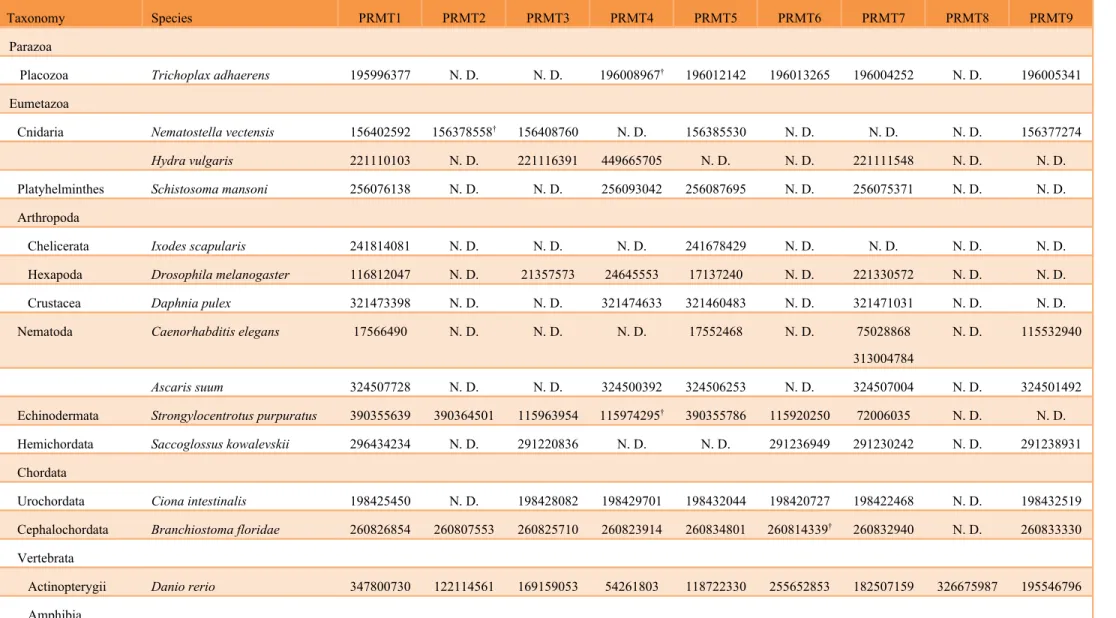
Table 1 PRMTs collected by using blastp with human PRMT queries.
Taxonomy Species PRMT1 PRMT2 PRMT3 PRMT4 PRMT5 PRMT6 PRMT7 PRMT8 PRMT9
Parazoa
Placozoa Trichoplax adhaerens 195996377 N. D. N. D. 196008967† 196012142 196013265 196004252 N. D. 196005341 Eumetazoa
Cnidaria Nematostella vectensis 156402592 156378558† 156408760 N. D. 156385530 N. D. N. D. N. D. 156377274
Hydra vulgaris 221110103 N. D. 221116391 449665705 N. D. N. D. 221111548 N. D. N. D.
Platyhelminthes Schistosoma mansoni 256076138 N. D. N. D. 256093042 256087695 N. D. 256075371 N. D. N. D. Arthropoda
Chelicerata Ixodes scapularis 241814081 N. D. N. D. N. D. 241678429 N. D. N. D. N. D. N. D. Hexapoda Drosophila melanogaster 116812047 N. D. 21357573 24645553 17137240 N. D. 221330572 N. D. N. D. Crustacea Daphnia pulex 321473398 N. D. N. D. 321474633 321460483 N. D. 321471031 N. D. N. D. Nematoda Caenorhabditis elegans 17566490 N. D. N. D. N. D. 17552468 N. D. 75028868
313004784
N. D. 115532940
Ascaris suum 324507728 N. D. N. D. 324500392 324506253 N. D. 324507004 N. D. 324501492
Echinodermata Strongylocentrotus purpuratus 390355639 390364501 115963954 115974295† 390355786 115920250 72006035 N. D. N. D. Hemichordata Saccoglossus kowalevskii 296434234 N. D. 291220836 N. D. N. D. 291236949 291230242 N. D. 291238931 Chordata
Urochordata Ciona intestinalis 198425450 N. D. 198428082 198429701 198432044 198420727 198422468 N. D. 198432519 Cephalochordata Branchiostoma floridae 260826854 260807553 260825710 260823914 260834801 260814339† 260832940 N. D. 260833330 Vertebrata
Actinopterygii Danio rerio 347800730 122114561 169159053 54261803 118722330 255652853 182507159 326675987 195546796 Amphibia
Lissamphibia Xenopus (Silurana) tropicalis 123892812 322518398 45360587 301627458 171847328 187607708 62859951 301618678 213982995 Reptilia Anolis carolinensis 327281163 N. D. 327259799 327264171 327289321 N. D. 327276497 327273289 327274011 Neognathae Gallus gallus N. D. N. D. 313747440 N. D. 53132882 N. D. 57524811 363728290 50746307 Mammalia Homo sapiens 154759421 46255047 44771198 40288288 19684070 49522881 12652789 74099699 40538772
Mus musculus 9790109 117938280 29789323 50511310 188528624 126432554 21703808 357527369 124486973
Bos taurus 528992278 528938233 156120799 528907143† 296483630 62460618 296477955 332308961 149642603
Fungi
Ascomycota Schizosaccharomyces pombe 295443078 N. D. 74626597 N. D. 1706961 N. D. N. D. N. D. N. D.
Saccharomyces cerevisiae 6319508 N. D. N. D. N. D. 323349738 N. D. N. D. N. D. N. D.
N.D.: not detected
Supplementary Table 1. fmr-1 cDNA sequences used in this study.
gi number Species Common name
29658 7
Homo sapiens human
19710 2197
Pongo abelii Sumatran orangutan
29730 4932
Macaca mulatta rhesus monkey
30176 6716
Ailuropoda melanoleuca giant panda
29140 8561
Oryctolagus cuniculus rabbit
30794 227
Rattus norvegicus Norway rat
35448 5792
Cricetulus griseus Chinese hamster
36373 2912
Gallus gallus chicken
32692 4657
Meleagris gallopavo turkey
41005 7072
Pan troglodytes chimpanzee
40291 1662
Papio anubis olive baboon
30079 8635
Bos taurus cattle
39585 9574
Otolemur garnettii small-eared galago
51036 612
Mus musculus house mouse
39554 5958
Sarcophilus harrisii Tasmanian devil
34530 6646
Ornithorhynchus anatinus platypus
20991 5622
53749 721
Supplementary Table 2. Dihydrolipoamide dehydrogenase (E3) sequences used in this study.
gi Number Species Common name
1339989 Homo sapiens Human
326911238 Meleagris gallopavo Turkey
27882508 Danio rerio Zebra fish
229291927 Branchiostoma floridae Florida lancelet
291240754 Saccoglossus kowalevskii Acorn worm
24817518 Caenorhabditis elegans Nematode
321469305 Daphnia pulex Water flea
307209020 Harpegnathos saltator Jerdon's jumping ant
399108168 Tribolium castaneum Red flour beetle
71897021 Gallus gallus Chicken
148236207 Xenopus laevis African clawed frog
47209763 Tetraodon nigroviridis Puffer fish
198423786 Ciona intestinalis Sea squirt
115752588 Strongylocentrotus purpuratus Purple sea urchin
4836454 Ascaris suum Large roundworm of pigs
322790475 Solenopsis invicta Red imported fire ant
66526646 Apis mellifera Western honey bee
167867657 Culex quinquefasciatus Southern house mosquito
157114623 Aedes aegypti Yellow fever mosquito
7293932 Drosophila melanogaster Fruit fly
353231245 Schistosoma mansoni Trematodes
221116615 Hydra magnipapillata Hydra
156228862 Nematostella vectensis Starlet sea anemone
171390 Saccharomyces cerevisiae Budding yeast
Supplementary Table 3. DARTs collected by using blastp with Drosophila melanogaster DART queries.
Classification Species DART2 DART6 DART8 DART9
Hexapoda Insecta Drosophila melanogaster 24581602 7299824 24583607 7299823 Drosophila sechellia 195342423 195329128 195340029 195329132 Drosophila simulans 195576487 195571037 195578413 195571039 Drosophila erecta 194855986 194901322 194861897 194901324 Drosophila yakuba 195471228 195500943 195472058 195500941 Solenopsis invicta N.D. N.D. 322795848 N.D. Harpegnathos saltator N.D. N.D. 307195304 N.D. Tribolium castaneum N.D. N.D. 91085911 N.D. Culex quinquefasciatu N.D. N.D. 170049565 N.D. Aedes aegypti N.D. N.D. 157136843 N.D. Acyrthosiphon pisum N.D. N.D. 193713732 N.D. N.D.: not detected
Supplementary Table 4. Five PRMTs identified in Trypanosoma brucei gambiense DAL972.
Classification Species gi number Protein name
Euglenozoa
Kinetoplastea Trypanosoma brucei gambiense DAL972 261326330 PRMT1
261332363 PRMT3
261331991 PRMT5
261328430 PRMT6