Removal of copper (II) by manganese-coated sand
in a liquid fluidized-bed reactor
Chia-I Lee
a,∗, Wan-Fa Yang
a, Cheng-I Hsieh
baGraduate Institute of Environmental Engineering, National Taiwan University, Taipei 10673, Taiwan bDepartment of Bioenvironmental Systems Engineering, National Taiwan University, Taipei 10673, Taiwan
Received 23 February 2004; received in revised form 5 May 2004; accepted 21 June 2004 Available online 27 September 2004
Abstract
This study was performed in a fluidized-bed reactor (FBR) filled with manganese-coated sand (MCS) to treat copper-contaminated wastew-ater. The adsorption characteristics of MCS, the adsorption equilibrium of MCS, and the copper removal capacity by MCS in FBR were investigated. In terms of the adsorption characteristics of MCS, the surface of MCS was evaluated using a scanning electron microscope (SEM). Energy dispersive analysis (EDS) of X-rays indicated the composition of MCS, and the quantity of manganese on MCS was deter-mined by means of acid digestion analysis. The experimental results indicated that copper was removed by both sorption (ion exchange and adsorption) and coprecipitation on the surface of MCS in FBR. Copper removal efficiency was highly dependent on the pH and increased with increasing pH from pH 2 to 8. After the copper adsorption by MCS, the pH in solution was decreased. When the MCS concentration was greater than 10 g/l, the copper adsorptivities obtained by FBR were almost the same as that from the shaker and when the MCS concentration reached 40 g/l, the copper adsorptivity in FBR was greater than that from the shaker. The adsorption sites of MCS could be used efficiently by the FBR. A Langmuir adsorption isotherm equation fit the measured adsorption data from the batch equilibrium adsorption test better than the Freundlich adsorption isotherm equation did. In addition, the adsorption rate increased when the influent wastewater was aerated. © 2004 Elsevier B.V. All rights reserved.
Keywords: Fluidized-bed reactor; Copper removal; Manganese-coated sand; Adsorption; Coprecipitation
1. Introduction
Heavy metal contamination exists in natural water, drink-ing water and waste streams of many industries. The primary sources of copper discharge from industries include printed circuit boards, metal surface treatments and mining opera-tions. Heavy metals are not biodegradable and tend to accu-mulate in living organisms. Copper can cause stomach and intestinal distress, liver and kidney damage, and anemia[1]. Removing copper ions from water bodies is, then, an impor-tant process.
Conventional methods for treating metal-bearing water that contains copper ions employ the alkaline precipitation process. In this process, copper generally forms hydroxide ∗Corresponding author. Tel.: +886 937162892; fax: +886 223626373.
E-mail address: d91541004@ntu.edu.tw (C.-I. Lee).
precipitate, to which caustic is added to adjust the wastewater to an alkaline pH, followed by precipitate forming and set-ting. This process usually generates huge amounts of water-rich sludge, which has to be disposed of continuously. In addition, the precipitation process can only reduce the dis-solved metal concentration to the solubility product level, which often cannot meet the discharge permit standard, thus necessitating further polishing stages. Cost-effective alterna-tive techniques or materials for the removal of copper ions from diluted solutions are, hence, needed[2].
Adsorption processes for the treatment of metal-bearing drinking water or wastewater are becoming attractive. The adsorption of heavy metal cations/anions onto synthetic oxides/oxyhydroxides of Mn, Fe, Al, etc., has been studied extensively[3–8]. These multivalent hydrous oxides are am-photeric, and the charge of the hydrous oxide depends on the pH of the medium. MnO2is one kind of surface acidic oxides,
0304-3894/$ – see front matter © 2004 Elsevier B.V. All rights reserved. doi:10.1016/j.jhazmat.2004.06.033
tap water or wastewater. However, most metal oxides are available only as fine powders or are generated in aqueous suspension as hydroxide floc or gel. In such forms, these ox-ides retain adsorptive properties for heavy metals, but a sed-imentation basin or filtration unit is needed for solid/liquid separation.
In recent years, the fluidized-bed reactor (FBR) technique process has been used as an alternative treatment method for heavy metal removal [10–15]. The process of crystallizing CaCO3in an FBR was applied in the softening of drinking water[10]. Nielsen et al.[12]tested the fluidized-bed tech-nique at a coal-fired power station with wastewater from a flue gas desulphurisation unit for the removal of heavy met-als from wastewater. In this technique, manganese or ferrous ions and an oxidation agent (e.g., O2, H2O2, KMnO4) are continuously added to the wastewater. An adsorptive granule of either FeOOH (ferric oxyhydroxide) or manganese dioxide is generated as a coating on the surface of the carrier material. Furthermore, heavy metal removal[13–15]by means of the crystallization of carbonate in an FBR is employed to reduce the disposal of hydroxide sludge and reduce the cost of the metal involved.
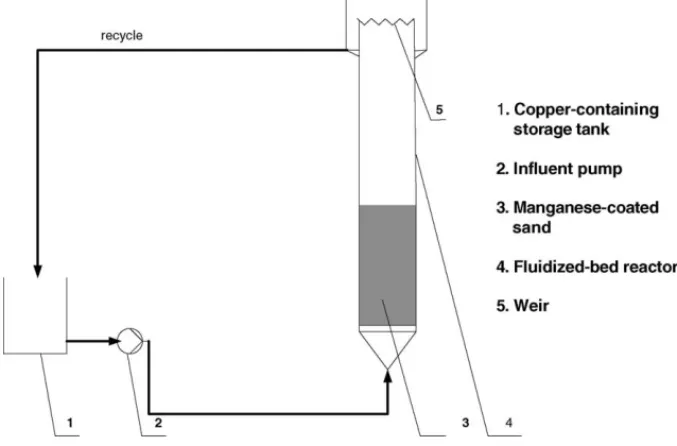
In order to solve the solid/liquid separation problem and apply the above adsorption technology in practice, a cheap carrier material of manganese-coated sand (MCS) and an FBR are used. This study intended to remove copper ions from synthetic wastewater by using an FBR filled with MCS as a heavy metal stripper. During operation, the copper-contaminated wastewater was only subjected to pH value adjustment and was pumped vertically upward through the fluidized bed. The copper ions were removed by means of adsorption and coprecipitation on the surface of MCS in the
Fig. 1. Schematic drawing of the FBR.
2. Materials and methods
2.1. Material
MCS (obtained from the Yow Shiuan Mining Co., Tai-wan) was used as a carrier material (or absorbent), and the average diameter of the MCS was 1.0± 0.1 mm. The syn-thetic wastewater was prepared by dissolving CuCl2·H2O (the Merck Co., Analytical Reagent Chemicals) in deionized water.
2.2. Methods
The experimental set-up is shown inFig. 1. The FBR had an inner diameter of 0.03 m and a height of 1.5 m with a larger cross-sectional area of weir, and it was filled with a fixed amount of MCS. The experiment was begun with a 5 l solution containing a fixed concentration of copper, and the solution pH was adjusted to a desired value using 0.1N NaOH or 0.1N HNO3.
The copper solution was pumped into the reactor vertically and fluidized the manganese sand bed at a flow rate of 10 m/h with the temperature keep at room temperature, that is, about 25◦C. For measurement of the copper concentration, samples were taken from the influent and effluent of the FBR. After a specified period of time, the effluent solution was taken.
The adsorption isotherms of MCS for copper were carried out in 250 ml high-density polyethylene (HDPE) bottle. A total amount of 100 ml solution containing a fix concentration of copper was introduced into each bottle and a fixed amount
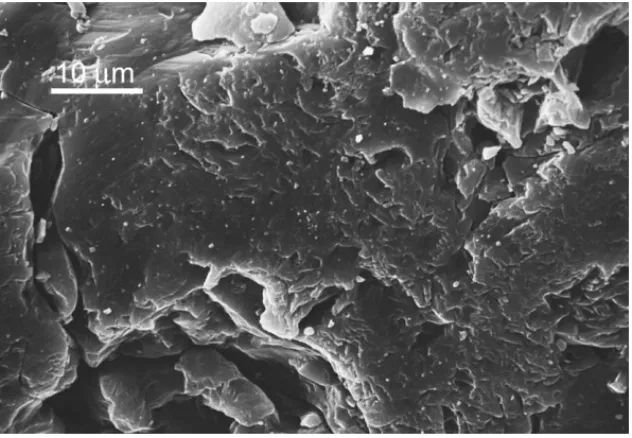
Fig. 2. SEM image of MCS.
of MCS was added. The solution pH was adjusted to 5.0 with HNO3 and NaOH. The bottles were shaken (DENG YNG, Taiwan, ModelDKW-40L) at 25◦C, immersed in a water bath for 24 h to attain an equilibrium state, and the oscillatory velocity was 100 rpm.
The taken solution was filtered through Whatman 42 fil-ter paper, filtrates were acidified using HNO3 and stored in a refrigerator at 4◦C. The copper concentration in the filtrate was analysed using a flameless atomic absorption spectrometry spectrophotometer (Perkin-Elmer AAnalyst 800). The amount of copper removed was calculated in-directly based on the difference between the influent and effluent concentrations of the solutions. The pH of the
Fig. 3. EDS spectrum of MCS.
solutions at the beginning and end of experiments was measured.
2.3. Analysis of the surface characteristics of MCS
The specific surface area of MCS was tested using the nitrogen adsorption method, and the BET adsorption model was used in the calculation. The surface shape and the com-position of MCS were analysed using a scanning electron mi-croscope with energy dispersive X-ray spectrum (SEM-EDS, PHILIPS). MCS samples for EDS analysis were coated with a thin carbon film to avoid the influence of any charge during the EDS operation.
The MCS samples had common features, including sil-ica sand and a brown color. The specific surface area was 9.03 m2/g obtained using the nitrogen adsorption method and the BET adsorption model. An SEM imagine of MCS is shown inFig. 2. This figure reveals the common features of the MCS surface, which is a porous and irregular surface with aggregated particles.
The spectrum of MCS obtained through SEM-EDS ele-mental analysis is shown inFig. 3, which indicates that be-sides manganese, the elements in MCS, including Si, Al, Fe and Ti, have the potential for copper adsorption. The amount of manganese on the surface of the MCS, measured through acid digestion analysis, was approximately 8.03 mg Mn/g-MCS.
3.2. Effect of the MCS concentration on copper removal
The effects of the MCS concentration on the adsorption amount of Cu2+adsorbed in the FBR and thermostated shaker are shown inFig. 4. During each operation, the test was con-ducted for 24 h.
In a shaker, the adsorption amount of copper, adsorbed decreased rapidly as the MCS concentration increased from 1 to 3 g/l and remained constant above 15 g/l. In the FBR, the amount of copper adsorbed decreased slowly as the MCS concentration increased from 6 to 20 g/l. In this case, when the MCS concentration was larger than 10 g/l, the copper adsorp-tivity obtained in the FBR was almost the same as that from the shaker. However, when the MCS concentration was larger than 40 g/l, the FBR copper adsorptivity was greater than that from the shaker. When the MCS concentration was 40 g/l, the copper adsorptivity in the FBR and shaker were 0.816 and 0.773 mg/g, respectively. These results demonstrate that
Fig. 4. Variation of the copper adsorption amount with the variation of the MCS concentration in the FBR and shaker (pH = 6, C0= 30 Cu2+mg/l).
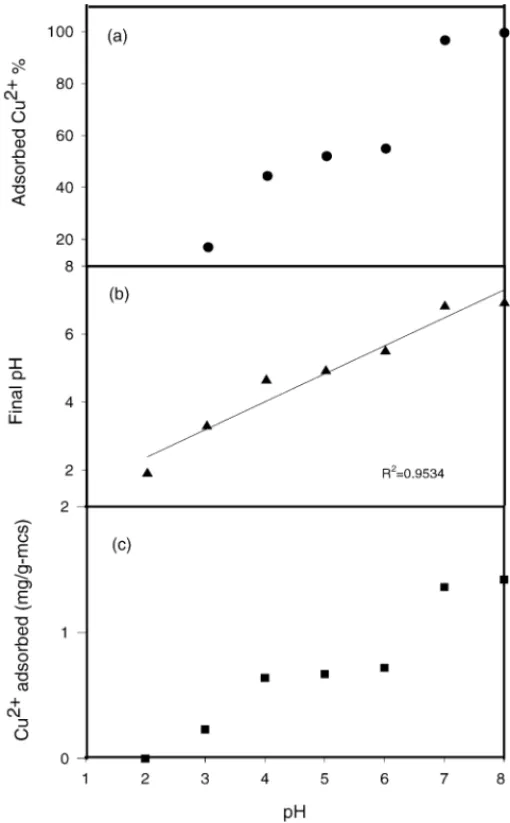
Fig. 5. Variation of pH and the adsorption of copper on MCS: (a) adsorbed Cu2+% at pH = 2.0–8.0 and C0= 30 Cu2+mg/l. (b) The relationship between initial and final pHs, MCS concentration of 20 g/l; experiment duration of 1 h and C0= 30 Cu2+mg/l. (c) The adsorption of copper on MCS as a function of the pH value: C0= 30 Cu2+mg/l.
the adsorption sites of MCS could be used efficiently by the FBR.
3.3. Effect of the pH and the change of pH value during Cu2+adsorption on MCS
Fig. 5(a) shows the adsorption of copper onto MCS over a pH range of 2.0–8.0. The pH value was an important parame-ter controlling the adsorption of Cu2+onto the surface of the MCS. The percentage of Cu2+adsorbed increased as the pH value increased from pH 2 to 6, and at pH 6, the percentage of adsorbed Cu2+was 55%.
The species distribution of copper in aqueous phase can be calculated using the formation constant Ki.Table 1lists the related values of log Kiat 25◦C and zero ionic strength
[16].
Theoretical calculation shows that at an initial copper con-centration of 30 mg/l, free ions of Cu2+ are the dominant
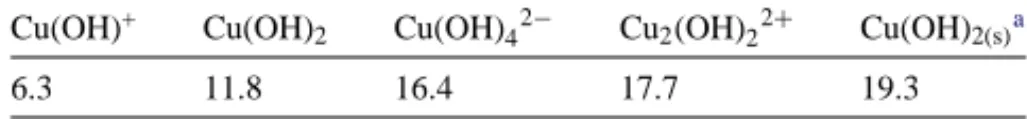
Table 1
The formation constants of copper and hydroxide (log Ki) in water at 25◦C
and zero ionic strength[16]
Cu(OH)+ Cu(OH)2 Cu(OH)42− Cu2(OH)22+ Cu(OH)2(s)a
6.3 11.8 16.4 17.7 19.3
aSolid or precipitate.
species when pH < 6.01. On the other hand, the precipitate Cu(OH)2(s)forms when pH > 6.01. In the result of copper removed, the initial pH was 7.0 and after a period of 1 h op-eration time, the residual copper concentration for total and soluble concentration was 9.25 and 0.95 mg/l, respectively. The results indicated the greater part of copper were in the form of Cu(OH)2(s), and coated on the surface of MCS. In this situation, Cu2+and Cu(OH)+are the major components in the solution when the pH value is less than 6.01. The pHzpcvalue of the MCS was found previously to be 2.0. This result indi-cates that when 2≤ pH ≤ 6, the MCS is negatively charged, and that the species of copper are Cu2+ and Cu(OH)+. Un-der such conditions, copper adsorption occurs by means of electrostatic attraction. At low pH, the small amount copper adsorbed at low pH is probably due to competitive adsorption of H+with copper ions.
In addition, to understand the adsorption mechanism, the variation of pH in a solution and the copper adsorbed on MCS during adsorption were measured, and the results are shown inFig. 5(b) and (c). The relationship between the initial pH range of 2.0–8.0 and the final pH values during Cu2+ adsorption on MCS was linear, and the R2value was 0.9534. The pH of the solution was observed to be decreased after adsorption by MCS. During the adsorption experiment, the pH value of the solution changed from 2 to 1.9, from 6 to 5.5, and from 8 to 6.9. These results indicated that the mechanism by means of which copper was adsorbed onto MCS perhaps involved an exchange reaction of Cu2+with H+on the surface and surface complex formation.
Based on the principle of ion-exchange, the more cop-per that is adsorbed onto MCS, the more hydrogen ions are released; thus the pH value was decreased. The complex reac-tions of Cu2+with hydrous manganese oxide may be written as follows:
Mn OH+ Cu2+↔ Mn O-Cu2++ H+, (1)
Mn O-+ Cu2+↔ Mn O-Cu2+, (2)
2( Mn OH)+ Cu2+↔ ( Mn O-)2Cu2++ 2H+, (3) 2( Mn O-)+ Cu2+↔ ( Mn O-)2Cu2+. (4) Eqs. (1)–(4) show the hydrogen ion concentration increased with an increasing amount of copper ion adsorbed on the MCS surface. FromFig. 5(c), the adsorption of copper on MCS was highly dependent on the pH. As the pH increased, the OH-increased, and the surface activity of the MCS in-creased simultaneously. Besides, inFig. 5(c), the adsorption curve of Cu2+ displayed three pH patterns. The adsorption amount increased rapidly with increasing pH from 2 to 4 and
Fig. 6. The adsorption rate of MCS for Cu2+in the FBR (pH = 6, C0= 28 Cu2+mg/l).
increased slowly with increasing pH from 4 to 6. When pH was over 7, the precipitation of Cu(OH)2 occurred, and it coated the sand surfaces.
3.4. Adsorption equilibrium of MCS
This test of the adsorption equilibrium for MCS included an experiment on the adsorption rate of MCS in the FBR and an adsorption isotherm test using a thermostated shaker.
Fig. 6shows the copper adsorption rate on MCS in the FBR at an MCS concentration of 20 g/l. The adsorption amount increased rapidly from 0.39 to 0.7 Cu2+mg/g-MCS with an increase in the effluent time from 3 to 30 min, and increased slowly from 0.77 to 0.91 Cu2+mg/g-MCS as the effluent time increased from 60 to 180 min. When the effluent time ex-ceeded 360 min, the adsorbed Cu2+reached 0.97 Cu2+ mg/g-MCS, the copper adsorbed was 68% and was 96.5% of the equilibrium adsorbed amount.
The amount of copper adsorbed by MCS versus the equi-librium concentration of copper ions is further calculated based on the Langmuir and Freundlich adsorption models. Both the Langmuir and Freundlich adsorption isotherms were determined when the equilibrium state was reached. The Langmuir adsorption isotherm at pH 5 was calculated and is shown inFig. 7. The Langmuir model is expressed as: qe= Q0bC
1+ bC, (5)
where qeand Q0are the observed and ultimate capacity for equilibrium adsorption (mg/g), C the residual concentration of copper in the solutions (mg/l), and b the model constant. From the fitting results of the Langmuir model, the coefficient
Q0was 1.025, the constant b was 0.538 and R2was 0.982.
Fig. 8 shows the Freundlich adsorption isotherm at pH 5.The Freundlich adsorption isotherm was determined as:
Fig. 7. Langmuir adsorption isotherms of Cu2+on MCS (pH = 5, C0 = 50 Cu2+mg/l).
where qe is the amount of copper ions adsorbed on MCS of unit weight (mg/g), and Ce the residual concentration of copper in the solutions (mg/l), which have been removed partially under an equilibrium state. InFig. 8, R2is 0.9654.
3.5. Effect of aeration on copper removal
The effect of aeration in the copper-contaminated wastew-ater was also investigated. In this experiment, an air bubble aerator was used, and the flow rate was 5.0 l/min.Fig. 9shows the variation of the effluent copper concentration with aera-tion in the influent wastewater. With or without aeraaera-tion, the effluent copper concentration increased as the effluent time (as soon as the solution effluent from the FBR, the effluent time was 0) increased from 0 to 60 min, decreased slowly as the effluent time increased from 60 to 960 min, and then re-mained constant when the effluent time exceeded 960 min. In the absence of aeration, the effluent copper concentration was 12.55 mg/l at 30 min, 8.40 mg/l at 960 min, and 8.32 mg/l at 1440 min (24 h). With aeration, the effluent copper
concen-Fig. 8. Freundlich adsorption isotherms of Cu2+on MCS (pH = 5, C0= 50 Cu2+mg/l).
Fig. 9. Variation of the effluent Cu2+concentration with and without aeration (pH = 6, MCS concentration = 20 g/l, influent Cu2+= 30 mg/l).
tration was 8.65 mg/l at 30 min, 6.10 mg/l at 960 min, and 5.65 mg/l at 1440 min (24 h). The effluent copper concentra-tion in the presence of aeraconcentra-tion was lower than that with-out aeration. The adsorption amount at 24 h was 1.09 and 0.95 mg/g-MCS with and without aeration, respectively.
The results indicate that aeration was conducive for cop-per adsorption onto the MCS. In this case, when pH was 6, under a weak acid solution a little manganese on MCS was dissolved and increased the concentration of Mn2+in the so-lution. Aeration oxidized Mn2+to MnO2(s)and coated on the surface of MCS. Comparing with the situation which with-out aeration, the coated MnO2(s)would increase the number of adsorption sites on MCS and increase copper adsorbed amount.
4. Conclusions
Based on the findings of this study, the following conclu-sions can be made:
(1) The total amount of attached manganese was about 8.03 mg manganese/g-MCS, from the digestion test. The MCS had a large specific surface area, and the SEM result indicated a porous and irregular surface with aggregated particles.
(2) The primary mechanism of copper removal by MCS in-cluded electrostatic attraction and surface complex for-mation. In addition, the precipitation of copper hydroxide potentially led to higher removal efficiency when the ini-tial copper concentration was 30 mg/l and the pH value was greater than 6.1.
(3) In the adsorption isotherm test on copper in MCS, the Langmuir adsorption isotherm was more suitable than the Freundlich isotherm. The type of copper adsorption on MCS is probably a monolayer adsorption.
(4) The copper adsorption amount was increased by aeration because aeration could oxidize Mn2+, producing a solid form of MnO2, and increase the number of adsorption sites on the surface of the MCS.
Acknowledgements
The authors express their gratitude to the Ministry of Eco-nomic affairs of the Republic of China (Contract No.: 91-EC-17-A-10-S1-0007) for its financial support.
References
[1] J.L. Gardea-Torresdey, L. Tang, J.M. Salvador, Copper adsorption by esterified and unesterified fractions of Sphagnum peat moss and its different humic substances, J. Hazard. Mater. 48 (1996) 191–206. [2] S.E. Bailey, T.J. Olin, R.M. Bricka, D.D. Adrian, A review of po-tentially low-cost sorbents for heavy metals, Water Res. 33 (1999) 2469–2479.
[3] R. Rao Gadde, A. Herbert, Laitinen, Studies of heavy metal adsorp-tion by hydrous iron and manganese oxides, Anal. Chem. 46 (13) (1974) 2022–2026.
[4] R.P. Bailey, T. Bennett, M.M. Benjamin, Sorption onto and recovery of Cr(VI) using iron-oxide-coated sand, Water Sci. Technol. 26 (5/6) (1992) 1239–1244.
[5] S.L. Lo, H.T. Jeng, C.H. Lai, Characteristics and adsorption proper-ties of iron-coated sand, Water Sci. Technol. 35 (7) (1997) 63–70.
[6] C.H. Lai, C.Y. Chen, B.L. Wei, S.H. Yeh, Cadmium adsorption on the goethite-coated sand in the presence of humic acid, Water Res. 36 (2002) 4943–4950.
[7] G. Horanyi, P. Joo, Comparative radiotracer study of the adsorption of sulfate and pertechnetate ions on␥-Al2O3, J. Colloid Interf. Sci. 243 (2001) 46–51.
[8] Tao Zuyi, Li Weijuan, Z. Fuming, D. Youqian, Yu Zhen, Am(III) adsorption on oxides of aluminium and silicon: effects of humic substances, pH, and ionic strength, J. Colloid Interf. Sci. 265 (2003) 221–226.
[9] S.B. Kanungo, K.M. Paroda, Interfacial behavior of some synthetic MnO2 samples during their adsorption of Cu2+ and Ba2+ from aqueous solution at 300 K, J. Colloid Interf. Sci. 98 (1984) 252– 260.
[10] W.D. Harms, R.B. Robinson, Softening by fluidized-bed crystallizers, J. Environ. Eng., ASCE 118 (1992) 513–529.
[11] H. Aktor, Continuous high-rate removal of chromate in a fluidized bed without sludge generation, Water Sci. Technol. 30 (7) (1994) 31–40.
[12] P.B. Nielsen, T.C. Christensen, M. Vendrup, Continuous removal of heavy metals from FGD wastewater in a fluidized bed with-out sludge generation, Water Sci. Technol. 36 (2/3) (1997) 391– 397.
[13] M. Scholler, J. Dijk, D. Wilms, Recovery of heavy metals by crys-tallization, Metal Finish. 85 (11) (1987) 31–34.
[14] M. Scholler, J. Dijk, D. Wilms, Fluidized bed pellet reactor to re-covery metals or anions, Metal Finish. 89 (11) (1991) 46–50. [15] D.A. Wilms, K. Vercamst, J.C. Dijk, Recovery of silver by
crystal-lization of silver carbonate in a fluidized-bed reactor, Water Res. 26 (1992) 235–239.
[16] F.M.M. Morel, J.G. Hering, Principles and Applications of Aquatic Chemistry, Wiley, New York, 1993.