African Journal of Business Management Vol.5 (17), pp. 7410-7419, 4 September, 2011 Available online at http://www.academicjournals.org/AJBM
DOI: 10.5897/AJBM11.174
ISSN 1993-8233 ©2011 Academic Journals
Full Length Research Paper
A (data envelopment analysis) DEA-based systematic
approach for selection of strategic alliance candidates:
Case by the biotechnology industry
Chia-Nan Wang
1* and Chih-Hong Wang
21
National Kaohsiung University of Applied Sciences, Taiwan.
2
National Chengchi University, Taiwan. Accepted February, 2011
Enterprises become more and more difficult to maintain success in the highly competitive environment. This is the reason why many enterprises start searching for strategic alliance partners to strengthen their competitive advantage. However, facing a future of uncertainty, choosing the suitable partner of strategic alliance has become a difficult task. Based on data envelopment analysis and heuristic techniques, this study proposes a new systematic approach, which calls alliance candidate selection. The objective of alliance candidate selection is to assist biotech companies to evaluate the operation efficiency and find the best candidate of strategic alliance. Realistic data are collected from biotechnology businesses of Taiwan published stock market. Target company and 19 biotechnology companies for decision making units were collected. This research tries to help target company to find the right alliance partners for future integration. By analysis of alliance candidate selection, the results show that, the predicted benefits of 3 candidates as first priority 4 ones suggested and 10 of the ones not recommended. The results are sound for enterprises to find the future candidates of strategic alliance by many industry peoples. Alliance candidate selection can effectively provide all the essential analysis and recommendations to enterprises, for finding the right candidate of strategic alliance. Key words: Strategic alliance, data envelopment analysis, biotechnology, efficiency.
INTRODUCTION
The technology policy of many countries chooses biotech- nology for full support and development. Biotechnology industry becomes one of the most past booming industries in the world. No doubt, this is a new industry and people still try to find a way up. Nevertheless, with rapid growth of the global competition, enterprises strongly feel that their advantage is not easy to continue longer in the market, especial the competence strategy of this new industry. This is the reason why many enterprises start searching for strategic alliance partners in order to strengthen their competitive advantage for the ultimate success in the market. However, facing a future of uncertainty, choosing the suitable partner of “strategic alliance” has become a difficult task. The objective of this
*Corresponding author. E-mail: cn.wang@cc.kuas.edu.tw. Tel: 886-7-3814526 ext. 7109. Fax: 886-7-3837251.
paper is to develop an effective method to assist biotech companies to evaluate the operation efficiency and find the best candidate of strategic alliance. Based on the methodology of data envelopment analysis (DEA) and heuristic techniques, this research develops an evaluation method which calls alliance candidate selection (ACS). ACS will be a very effective tool by using evaluation models to provide top managers with an effective method to find the best partner of strategic alliance under some certain control factors; because the merge and alliance has been a very common strategy for business to have more choices and fast expansion. Besides, mutual learning is another advantage.
Most of DEA applications focused on performance evaluation, some are in the area of mergers and acquisitions (Sufian and Habibullah, 2009). The research of Bhattacharyya et al. (1997) shows that, government owned banks possess more operational efficiency than privately owned banks, but less efficiency than foreign
banks. Camanho and Dyson (2005) enhance cost efficiency measurement methods. The results obtained in the case study show that, the DEA models can provide robust estimates of cost efficiency even in situations of price uncertainty. Lee et al. (2005) discuss a description of a DEA model for analysis of the control performance for a specific context for electronic data interchange (EDI) in the context of finance and trade. Homburg (2001) investi- gates the use of DEA for activity-based management and pros and cons of DEA as applied to benchmark activities. Mota et al. (1999) provide a quantitative model for activity-based management (ABM). A real case study of a drill factory is used to illustrate the application of the model. Co and Chew (1997) use DEA to analyze the performance and R&D expenditures in American and Japanese manufacturing firms. An approach based on DEA is proposed by Chang and Lo (2005) for measuring the relative efficiency of an ISO 9000 certified firm's ability to achieve organizational benefits. Luo and Donthu (2005) use DEA and Stochastic Frontier (SF) to show that, top 100 marketers’ advertising spending in print, broadcast, and outdoor media are not efficient and could bring in 20% more sales. Cook and Zhu (2003) use DEA for productivity measurement of highway maintenance crews as maximum achievable by reduction in resources without impacting the outputs from the process. Durand and Vargas (2003) analyze the ownership, organization, and private firms' efficient by DEA. Forker et al. (1997) combine nonlinear DEA and linear regression analyses, and then demonstrate that Total Quality Management (TQM) practices are related to performance. However, DEA cannot only be used in performance evaluation and can be extended more.
Some researches extend DMU combination in DEA to study strategy. Some other researcher such as Shaffer (1993) suggests that, mergers have the potential to produce efficiencies. Worthington (2004) uses DEA and the multinomial logic model to evaluate the determinants of merger and acquisition (M&A) activity in Australian credit unions. The results indicate that, asset size and quality, management ability, earnings and liquidity impose significant influences on the level of M&A. Lubatkin and Srinivasan (1997) update the list of large mergers from 1948 through 1988 and calculate three capital market measures of value creation. They facilitate “mergers for efficiency,” rather than “merger for diversity.” Wang and Wang (2005) provide an application model for merger evaluation in high-tech business. Their study tries to build a model to find the best merger candidate. Delmas and Tokat (2005) use DEA to analyze how the process of retail deregulation affects the comparative efficiency of governance structures, which range on a continuum from fully vertically integrated structures to market trans- actions.
Talluri and Baker (1996) propose a two-phase mathematical programming approach for effective partner selection in designing a venture capital (VC) by combining
Wang and Wang 7411
the DEA and technique with an integer programming model. Shao and Lin (2002) develop an approach to investigate the effects of Information Technology (IT) on the technical efficiency in a firm’s production process. DEA and Tobit models are used to measure the efficiency scores upon the corresponding IT investments of the firms. To our best knowledge, there are no researches reported, that use DEA to select strategic alliance candidates in technology oriented business. The remaining of this paper is organized as follows; two DEA models are reviewed followed by the development of the DEA-based heuristic method for strategic alliance candidate selection (ACS). Case study and the analysis are then demonstrated followed by the conclusion.
CONCEPT OF THE DEA METHODOLOGY
DEA was first proposed by Charnes et al. (1978) (CCR). Its original idea comes from the measurement model of production efficiency proposed by Farrell (1957). DEA itself is a non-parametric method for assessing the relative efficiency of decision making units (DMUs) based upon multiple inputs and outputs. The primitive DEA model adopts the concept of production in microeco- nomics: efficiency = output / input. Banker et al. (1984) (BCC) developed a new model from the CCR model to understand the problems of pure technical efficiency (PTE) and scale efficiency (SE). Both of the CCR and BCC models are summarized as follows.
CCR model
The CCR model intends to maximize the ratio of weighted outputs against weighted inputs. It reduces multiple outputs to a single “virtual” output, and multiple inputs to a single “virtual” input for each DMU. CCR is good at analyzing the relative efficiency without setting the weights in prior, which makes the CCR model more objective. Assume that there are n DMU. Each DMU has m inputs and s outputs. Let
x
ij represent the ith input andrj
y represent the rth output of DMU j, respectively. Let ur and
v
i represent the virtual variables of rth output andith input, respectively. Let h represent the relative j
efficiency of DMU j. Where
ε
is a relatively small positive number (normally set at 10-6). The relative efficiency of each DMU can be calculated by solving the following mathematical programming problems:Max
∑
∑
= = = m i ij i s r rj r j x v y u h 1 1 (1) Subjected to 1 1 1 ≤ ∑ ∑ = = m i ij i s r rj r x v y u (2)7412 Afr. J. Bus. Manage. ε ≥ r u >
0
(3) ε ≥ i v >0 (4) r =1,2,3,….,s; i =1,2,3,…..,m; j =1,2,3,…..,nThe CCR input model can suggest improvement directions and the values of both outputs and inputs in order to achieve the desired efficiency value of 1, which can be done by calculating the following equations:
* * − − = i ij j ij h x s x , i =1,…,m (5) * * + + = r rj rj y s y , r =1,…,s (6) Where − i
s
represents the lacking quantity (slack) of the output and
+
r
s
represents the redundant quantity (surplus) of the input.x
ij* ,
y
rj * , * + rs
ands
i−*represent the optimal values of
x
ij ,y
rj ,+
r
s
and, respectively. Note that when the value of objective function h =1, j+
r
s
=0 and −i
s
=0 (for all r and i). That is,DMU j achieves its optimal efficiency. Note that, CCR is the most popular DEA model for evaluation of the total operational efficiency.
BCC model
The difference between the CCR and BCC models is the use of returns-to-scale. For each DMU, BCC allows variable returns-to-scale, while CCR is characterized by constant returns-to-scale. The BCC model has an additional convexity condition. The input–oriented BCC model can be written as:
Max
∑
∑
= = − = m i ij i s r rj r j x v u y u h 1 1 0 (7) Subjected to 1 1 1 0 ≤ −∑
∑
= = m i ij i s r rj r x v u y u (8)ε
≥
ru
>0
(9)ε
≥
iv
>0 (10) r =1,2,3,…,s; i =1,2,3,…,m; j =1,2,3,…,n 0u
is a real number to indicate the intercept of the production frontier. When
u
0>0, the production frontier for this DMU is decreasing returns-to-scale (DRS). When0
u
=0, the production frontier for this DMU is constant returns-to-scale (CRS). When
u
0 <0, the production frontier for this DMU is increasing returns–to-scale (IRS). In addition, the suggested improvement directions of the BCC input model are the same as the CCR input model.ALLIANCE CANDIDATE SELECTION (ACS) METHODOLOGY
Based on the DEA method, this paper proposes a heuristic method to select strategic alliance candidates’ efficiency in biotechnology industry. This paper uses the CCR model for the calculation of strategic alliance. The ACS methodology can be divided into four stages; these are data collection, variables setting, calculation, and analysis, as shown in Figure 1. Details are described as follows.
Data collection
There are five steps in the data collection stage, whose output is the DMU data table for the calculation of Part C. Step A-1: DMU Selection
Select DMU companies which have at least one of the following features related to our target company:
1. Business connection or potential connection with our target company;
2. Competitors;
3. Upstream or downstream of the industry. Step A-2: Input/Output factors setting
Find the dominating input resources which dominate the performance. Determine the major performance indica- tors. The selection of input resources and performance indicators can be from the following ways:
1. Industrial forum 2. Survey
3. Brainstorming of industrial managers
ACS can remove the redundant items, so there are no constraints on the amount of inputs and outputs (I/O). Anything important or potentially important can be included. The characteristics of I/O items can be multilateral. The items can have different units.
Step A-3: Original raw data collection
7418 Afr. J. Bus. Manage.
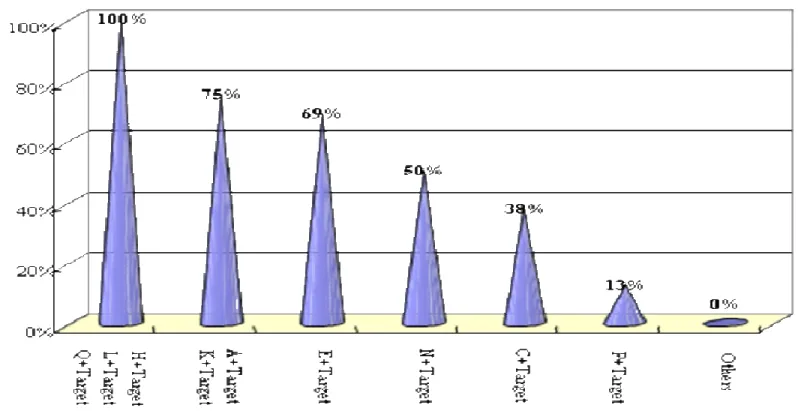
Figure 2. Successful chance.
always suitable for an alliance. Through calculation by ACS, a wrong combination alliance will be easy to distinguish. The method of ACS and the analysis are both discussed in a forum with several industrial managers (including the managers from target company) and their feedback was sound. Target company is planning to use ACS for their evaluation tool for partner selection of strategic alliance.
ACS is recognized to effectively provide all essential analysis and recommendations to enterprises for strategic alliance.
CONCLUSIONS
Biotechnology is the star industry of coming era. Strategic alliances have become a popular strategy for many biotech companies to extend their business roadmap. The objective of this paper is to develop an effective method to assist biotech companies in evaluating operation efficiency and finding the best candidate for a strategic alliance in complicated technology conditions. Its focus is on the realization of strategic plans and efficiency. According to ACS, candidates will be easy to separate into different priorities. This application design might help top management in their decision making process for business extension.
The results are sound for enterprises to find future candidates for a strategic alliance. Besides, academic researchers also can fully use this model to extend the
applications of DEA for more diversities. Furthermore, selection of inputs and outputs are also more alternatives for study, such as research and development expenses, research and development manpower, etc. Future direction should be in the consideration of the involvement with intangible resources, for input factors or output factors, and analysis among different industries. Moreover, the trend of inputs and outputs could be discussed as well.
REFERENCES
Banker RD, Chanes A, Cooper WW (1984). Some models for estimating technical and scale inefficiencies in data envelopment analysis. Manage. Sci., 30: 1078-1092.
Bhattacharyya A, Lovell CAK, Sahay P (1997). The impact of liberalization on the productive difference of Indian commercial banks. Euro. J. Operat. Res., 98: 332-345.
Camanho AS, Dyson RG (2005). Cost efficiency measurement with price uncertainty: a DEA application to bank branch assessments. Euro. J. Operat. Res., 161: 432-446.
Chang DS, Lo LK (2005). Measuring the relative efficiency of a firm's ability to achieve organizational benefits after ISO certification. Total Qual. Manage. Bus. Excell., 16(1): 57-69.
Charnes A, Cooper WW, Rhodes E (1978). Measuring the efficiency of decision making units. European J. Operat. Res., 2(6): 429-444. Cho G, Soh S (2010). Optimal decision-making for supplier-buyer’s
maximum profit in a two echelon supply chain. Afric. J. Bus. Manage., 4(5): 687-694.
Co HC, Chew KS (1997). Performance and R&D expenditures in American and Japanese manufacturing firms. Int. J. Product. Res., 35(12): 3333 -3348.
Cook WD, Zhu J (2003). Output deterioration with input reduction in data envelopment analysis. IIE Transac., 35(3): 309-320.
Delmas M, Toka Y (2005). Deregulation, governance structures, and efficiency: the U.S. electric utility sector. Strat. Manage. J., 26(5): 441-460.
Durand R, Vargas V (2003). Ownership, organization, and private firms' efficient use of resources. Strat. Manage. J., 24(7): 667– 675. Farrell MJ (1957). The measurement of productive efficiency. Journal of
the Royal Statistical Society. Series A, General, 120: 253-281. Forker LB, Mendez D, Hershauer JC (1997) Total quality management
in the supply chain: what is its impact on performance?, Int. J. Product. Res., 35(6): 1681 – 1702.
Homburg C (2001). Using data envelopment analysis to benchmark activities. Int. J. Product. Econ., 73(1): 51-58.
Lee S, Lee K, Kang I (2005). Efficiency analysis of controls in EDI applications. Inform. Manage., 42(3): 425-439.
Lubatkin M, Srinivasan N (1997). Merger Strategies and Shareholder Value during Times of Relaxed Antitrust Enforcement: The Case of Large Mergers during the 1980s. J. Manage., 23(1): 59-81.
Luo X, Donthu N (2005). Assessing advertising media spending inefficiencies in generating sales. J. Bus. Res., 58: 28–36.
Mota S, Benzecry JH, Qassim RY (1999). A model for the application of data envelopment analysis (DEA) in activity-based management (ABM). Int. J. Techno. Manage., 17: 861–868.
Wang and Wang 7419
Norman M, Stocker B (1991). Data Envelopment Analysis–The Assessment of Performance. John Wiley & Sons, Inc.
Shaffer S (1993). Can Megamergers Improve Bank Efficiency? J. Bank. Finan., 17: 423–436.
Shao BBM, Lin WT (2002). Technical efficiency analysis of information technology investments: a two-stage empirical investigation. Inform. Manage., 39(5): 391-401.
Sufian F, Habibullah MS (2009). Do mergers and acquisitions leads to a higher technical and scale efficiency? A counter evidence from Malaysia. Afric. J. Bus. Manage., 3(8): 340-349.
Taiwan Stock Exchange, Market Observation Post System, (2010). Available: http://mops.tse.com.tw/.
Talluri S, Baker RC (1996). A quantitative framework for designing efficient business process alliances. Proceed. Int. Conference Eng. Manage., pp. 656-661.
Wang CN, Wang CH (2005). A DEA application model for merger and acquisition in high-tech business. Proceed. Int. Conference Eng. Manage., pp. 43-47.
Worthington AC (2004). Determinants of Merger and Acquisition Activity in Australian Cooperative Deposit-taking Institutions. J. Bus. Res., 57(1): 47-57.