國
立
交
通
大
學
資訊科學與工程研究所
碩 士 論 文
透過 KINECT 影像做視訊監控應用上的立體環
境建模與監視
3D Environment Modeling and Monitoring via KINECT Images
for Video Surveillance Applications
研 究 生:馬秉辰
指導教授:蔡文祥 教授
透過 KINECT 影像做視訊監控應用上的立體環境建模與監視
3D Environment Modeling and Monitoring via KINECT Images
for Video Surveillance Applications
研 究 生:馬秉辰 Student:Bing-Chen Ma
指導教授:蔡文祥 Advisor:Wen-Hsiang Tsai
國 立 交 通 大 學
資 訊 科 學 與工 程 研 究 所
碩 士 論 文
A ThesisSubmitted to Institute of Computer Science and Engineering College of Computer Science
National Chiao Tung University in partial Fulfillment of the Requirements
for the Degree of Master
in
Computer Science
June 2013
Hsinchu, Taiwan, Republic of China
i
3D Environment Modeling and Monitoring via
KINECT Images for Video Surveillance Applications
Student: Bing-Chen Ma
Advisor: Wen-Hsiang Tsai
Institute of Computer Science and Engineering
National Chiao Tung University
ABSTRACT
In this study, several methods and strategies are proposed for 3D environment modeling and monitoring using an octagonal-shaped 9-KINECT imaging device for video surveillance.
Firstly, an environment modeling method is proposed which, based on the pinhole camera model, converts KINECT images into 3D images. In the method, at first a new technique is employed to correct geometrically the bending phenomenon existing in constructed 3D images. The technique is based on the use of an MMSE paraboloid approximation scheme and a data interpolation scheme. Also, a technique is proposed to calibrate spatial relations between KINECT devices by the ICP algorithm. Finally, a technique using the calibration result and the constructed 3D images as inputs is proposed to construct the indoor environment model.
Secondly, a human tracking method is proposed, by which human activities can be detected and tracked using the 9-KINECT imaging device. Specifically, a human detection process is conducted first, which includes the operations of background subtraction, mathematical morphology, and region growing. Then, during the human tracking process, the tilting devices of the KINECTs are used dynamically to track a
ii
human. The problem of handoff between KINECT devices, which occurs during the human tracking process, is also solved in this study.
Finally, to extract the features of tracked humans for use in security monitoring, a human modeling method is proposed, in which sequences of 3D images constructed from KINECT images are integrated, using the distance-weighted correlation (DWC) measure and the K-d tree structure, to form a human model. From the model, human features like body height, width, and thickness may be extracted for use in security monitoring and off-line video search.
Good experimental results are also shown, which prove the feasibility of the proposed methods for real applications.
iii
透過 KINECT 影像做視訊監控應用上的立體環境
建模與監視
研究生:馬秉辰
指導教授:蔡文祥 博士
國立交通大學資訊科學與工程研究所
摘要
本研究設計一新的八角形 9-KINECT 視訊裝置,並提出一系列相關策略和方 法,進行視訊監控上立體環境之建模及人物活動之追蹤。 首先,對於環境模型之建立,使用針孔成像原理將 KINECT 影像轉換成立體 影像,進而使用幾何修正的方式,利用最小平方差橢圓曲面內差近似法,去修正 立體影像的彎曲現象。接著,使用遞迴最近點(iterative closest point, ICP)演算法 校正 KINECT 裝置間之空間相對關係。最後,使用校正出來的結果和立體影像, 建立出室內環境的模型。 在使用八角形 9-KINECT 視訊裝置做人物追蹤方面,本研究首先進行人物偵 測,使用的方法包括深度影像背景相減法、數學形態學操作和區域增長等技術。 偵測到人物之後、進行人物活動追蹤時,會動態去改變 KINECT 裝置的仰角及 處理 KINECT 之間的換手問題。 最後是建立人物之模型並擷取人物之特徵,應用於安全監視。對此,本研究 藉由立體影像之序列,搭配距離權重相關係數(distance-weighted correlation, DWC) 以及 k 維樹(k-d tree)之結構,建構出單一人物之立體模型,並從模型中擷取出人 物特徵,如身高、體寬以及身體厚度,做為安全監視和事後觀看之用。 上述諸方法的實驗結果良好,證明在實際應用上該等方法確實可行。iv
ACKNOWLEDGEMENTS
The author is in hearty appreciation of the continuous guidance, discussions, and support from his advisor, Dr. Wen-Hsiang Tsai, not only in the development of this thesis, but also in every aspect of his personal growth.
Appreciation is also given to the colleagues of the Computer Vision Laboratory in the Institute of Computer Science and Engineering at National Chiao Tung University for their suggestions and help during his thesis study.
Finally, the author also extends his profound thanks to his dear mom and dad for their lasting love, care, and encouragement.
v
CONTENTS
ABSTRACT (in English) ... i
ABSTRACT (in Chinese) ... iii
ACKNOWLEDGEMENTS ... iv
CONTENTS ... v
LIST OF FIGURES ... viii
LIST OF TABLES ... xi
Chapter 1
Introduction ... 1
1.1 Background and Motivation ... 1
1.2 Review of Related Works ... 2
1.3 Overview of Proposed Methods ... 3
1.4 Contributions ... 6
1.5 Thesis Organization ... 6
Chapter 2
Ideas of Proposed Methods and System Design ... 8
2.1 Ideas of System Design ... 8
2.2 System Configuration ... 9
2.2.1 Hardware Configuration ... 9
2.2.2 Software Configuration ... 11
2.3 System Processes ... 12
Chapter 3
Design of Proposed Octagonal 9-KINECT Imaging
Device ... 17
3.1 Introduction to KINECT Device ... 17
3.2 Ideas of Proposed Design ... 19
3.3 Details of Design ... 20
3.3.1 Interchangeable Bases for KINECT Devices ... 21
3.3.2 Container... 21
3.3.3 Top Part ... 23
3.4 Analysis of Device Performance ... 24
3.4.1 Coverage of Views ... 25
3.4.2 Imaging Sequence and Speed ... 27
Chapter 4
Construction of 3D Images from KINECT Images ... 29
4.1 Introduction ... 29
4.2 Review of KINECT Image Structures ... 29
vi
4.3.1 Review of Pinhole Camera Model ... 30
4.3.2 Idea of 3D Image Construction and Coordinate Conversion .... 33
4.3.3 Construction Algorithm ... 34
4.4 Geometric Correction of 3D Images ... 36
4.4.1 Need of Correction ... 36
4.4.2 Proposed Correction Technique by Interpolation ... 36
4.4.3 Correction Algorithm... 37
4.5 Experimental Results ... 41
4.5.1 Results of 3D Image Construction ... 41
4.5.2 Results of 3D Image Correction ... 42
Chapter 5
Construction of 3D Indoor Environment Model from
Multiple KINECT Images ... 44
5.1 Introduction ... 44
5.2 Calibration of KINECT Devices ... 44
5.2.1 Review of Iterative Closest Point (ICP) Algorithm ... 45
5.2.2 Calibration of Spatial Relation between KINECT Devices ... 46
5.2.3 Algorithm for KINECT Device Calibration ... 48
5.3 Environment Model Construction ... 49
5.3.1 Idea of Construction ... 49
5.3.2 Merge of Multiple 3D Images ... 49
5.4 Experimental Results ... 50
Chapter 6
Human Tracking by Tilting KINECT Devices ... 52
6.1 Introduction ... 52
6.1.1 Review of Background Subtraction ... 53
6.1.2 Review of Noise Reduction Method... 54
6.2 Human Detection ... 56
6.2.1 Background Learning ... 56
6.2.2 Human Detection by Depth Image ... 59
6.2.3 Detection Algorithm ... 61
6.3 Human tracking ... 62
6.3.1 Human Tracking with Single KINECT Device ... 62
6.3.2 Handoff between KINECT Devices ... 62
6.3.3 Tracking Algorithm ... 63
6.4 Experimental Results ... 64
Chapter 7
Human Modeling and Display of Human Activities... 67
vii
7.2 Human Modeling from Single KINECT Device ... 68
7.2.1 Review of Distance-weighted Correlation (DWC)... 68
7.2.2 Review of K-d Tree ... 69
7.2.3 Modeling by Speeded-up DWC Using K-d Tree ... 69
7.2.4 Modeling Algorithm ... 71
7.3 Merging Human Models from Multiple KINECT Devices ... 72
7.3.1 Calibration of Models from Multiple KINECT Devices ... 72
7.3.2 Merge of Models by Speeded-up DWC Using K-d Tree ... 73
7.3.3 Merging Algorithm ... 74
7.4 Display of Human Activities ... 76
7.4.1 Display of Merged Results ... 76
7.4.2 Merge of Human Model and 3D Background ... 79
7.4.3 Extraction of Human Features from Human Model ... 80
Chapter 8
Conclusions and Suggestions for Future Works ... 82
8.1 Conclusions ... 82
8.2 Suggestions for Future Works ... 83
viii
LIST OF FIGURES
Figure 1.1 A picture of the proposed octagonal 9-KINECT imaging device. ... 4 Figure 2.1 The KINECT device used in this study. ... 10 Figure 2.2The Aguila SU16T Base is on the top of PCI Express x16 and the Aguila SU16T Expansion is at the bottom. ... 11 Figure 2.3The model construction process of the indoor environment ... 13 Figure 2.4 The process of tracking human activities. ... 14 Figure 2.5 The process of constructing human model and displaying human activities.
... 16 Figure 3.1 The Structure specifications for each part of the KINECT device. (a) The height of the KINECT device. (b) The width of the main part of the KINECT device. (c) The thickness of the main part of the KINECT device. (d) The area of the basement of the KINECT device. ... 18 Figure 3.2 The basic placement idea of the proposed octagonal 9-KINECT imaging device. The central KINECT device looks downward and the others senses outward. ... 20 Figure 3.3 The octagonal 9-KINECT imaging device. ... 20 Figure 3.4 The interchangeable base. ... 21 Figure 3.5 The octagonal container. (a) The whole appearance of the octagonal container. (b) The side of the octagonal container. (c) The bottom of the octagonal container. (d) The cap of the octagonal container. ... 22 Figure 3.6 The top part. (a) The whole appearance of the top part. (b) The circular plate of the top part. (c) The hollow cylinder of the top part. (d) The crossed plate of the top part. ... 24 Figure 3.7 The maximum sensing range from the side view. ... 26 Figure 3.8 The maximum sensing range from the side view. ... 26 Figure 3.9 The coverage of views of 9 KINECT devices from top view. The blue region is the view of the outer 8 KINECT devices. The red is the view of the inner KINECT device. The yellow circle represents the coverage of views of the 9 KINECT devices. ... 27 Figure 3.10 The coverage of the views by the depth image from side view. ... 27 Figure 4.1 An example of a KINECT image pair. (a) The color image. (b) The depth image. ... 30 Figure 4.2 An illustration of the pinhole camera model. ... 31 Figure 4.3 The geometry of a pinhole camera model. (a) Seen from a 3D point. (b) Seen from the X2-axis... 32
ix
Figure 4.4 The flowchart of the 3D image construction algorithm. ... 35
Figure 4.5 The 3D image of a plane (a wall). ... 36
Figure 4.6 The paraboloid equation. ... 37
Figure 4.7 A flowchart of the correction algorithm. ... 40
Figure 4.8 An example of construction of 3D images. (a) The color image of the KINECT image. (b) The depth image of the KINECT image. (c) The 3D image seen from the top. (d) The 3D image seen from a side. ... 41
Figure 4.9Results of geometric correction. (a) Original data seen from the top before correction. (b) Data seen from the top after correction. (c) Original data seen from the side before correction. (d) Data seen from the side after correction. ... 42
Figure 4.10 Results of geometric correction. (a) Original data seen from the top before correction. (b) Data seen from the top after correction. (c) Original data seen from the front before correction. (d) Data seen from the front after correction. ... 43
Figure 5.1 Some calibration targets used in this study. (a) A couch. (b) A clapboard. (c) A chair and a table. (d) A box with a suitable height. ... 47
Figure 5.2 The constructed indoor environment model. (a) The indoor environment model seen from the top. (b) and (c) The indoor environment model seen from different views. ... 51
Figure 6.1 An example for the background subtraction. (a) The background image. (b) An image with moving objects. (c) The image of the difference between (a) and (b) with some noise. (d) The resulting image of background subtraction. ... 53
Figure 6.2 An example for erosion results. (a) The original image. (b) The image after erosion. ... 54
Figure 6.3 An example for dilation operator. (a) The original image. (b) The image after dilation operator. ... 55
Figure 6.4 An example of human detection results. (a) The background depth image. (b) The depth image with human activities. (c) The subtracted depth image with many fragments and the human shape. (d) The depth image with the human shape and big fragments after doing erosion and dilation. (e) The final human depth image after applying the region growing scheme with a suitable threshold. ... 60
Figure 6.5 The red arrow indicates the path of the human activities. ... 65
Figure 6.6 The 3D image sequences of tracking human activities. In the 3D image sequence from (a) to (f), we applied the tracking algorithm with the nine KINECT devices of the octagonal 9-KINECT imaging device. ... 65
x
Figure 7.1 A sequence of 3D human images. In (g), the sequence from (a) to (f) is displayed in the meantime. ... 76 Figure 7.2 A human model constructed from a sequence of 3D human images seen from a side view. ... 78 Figure 7.3 Two pivot images of two models. In (c), we display the two pivot images in (a) and (c) at the same time. ... 78 Figure 7.4 Applying the calibration result to the two pivot images. ... 79 Figure 7.5 Merging result of the two pivot images. ... 79 Figure 7.6 An example of human model and background merging result. (a) The human model. (b) The background model. (c) The merge result. ... 80 Figure 7.7 An example of human feature extraction from the human model. The red frame can be used to compute the approximate human features like height, body width and body thickness. ... 81
xi
LIST OF TABLES
Table 4.1 Results of paraboloid coefficient estimations using different sets of 3D data of the 3D image with the different distances between the KINECT device and planes... 39
1
Chapter 1
Introduction
1.1 Background and Motivation
With the advance of technology, there are more and more vision-based devices in our daily life for different applications. Some of them are used to monitor events in environments or track objects dynamically. Others are used as event recorders, and the recorded data are used for event analysis or other applications.
In recent years, Microsoft releases a new type of sensing device KINECT. It can capture not only RGB color images and audio data but also depth information as well as the data of the human skeleton at the same time. With the depth information, we can translate it into 3D information. It is beneficial to researches of 3D object detection and modeling.
So, in this study it is desired to design a 3D video surveillance system using multiple KINECT devices and implement some applications described as follows. 1. Monitoring an indoor environment and displaying the captured images of the
environment in 3D manners for users to inspect the recorded environment data from different viewpoints.
2. Using the depth information provided by KINECT devices to detect and track human activities and providing changes of viewpoints from different KINECT devices.
3. Creating human models when users browse the records acquired by the KINECT devices, and providing the features of the humans such as height, body width, body thickness, etc.
2
1.2 Review of Related Works
In this section, we conduct a survey of related works about the construction of the 3D video surveillance system, including 3D environment modeling and motion object detection and tracking.
Many modeling techniques have been proposed for object or environment modeling using data acquired with the KINECT device. Zollhöfer [1] proposed a simple algorithm which uses robust non-rigid registration and merging of the deformation face model to simulate a high-quality virtual interactive 3D face. The data used in the modeling work were captured with the KINECT device. This technique can be applied to computer animation. Shahram [2] proposed a technique, called KinectFusion, which uses the depth information acquired by moving the KINECT device to build up a high-quality and geometrically-precise 3D model quickly. In the operation of his system, a user takes a KINECT device and moves around the indoor environment, and the system will scan and model the entire environment in a short time. The precision of the model can also be adjusted by changing the distance from the target to the KINECT device.
Henry [3] proposed a 3D mapping system which uses visual features and a shape-joint optimization algorithm with RGB color images and depth information acquired with KINECT devices as inputs. In a cooperative project conducted by the MIT, the University of Washington, and Intel Lab. [4], the researchers put the KINECT device on a small airplane to acquire data and built a full view of the 3D environment using the features extracted from the acquired data and an RGBD-SLAM algorithm.
Many algorithms were proposed for motion detection and tracking. Chaiyawatana [5] constructed an automatic system for vehicle detection by a frame subtraction
3
technique. The algorithm adopts a suitable threshold and subtracts each frame from its previous one. The results are analyzed by some process units to detect motion objects using the threshold value. Tian [6] used pixels from continuous video frames and a Gaussian distribution to build up and adjust a background model. By this way, noise coming from light changing, leaf swaying from the background, and so on, in each frame can be avoided when the human detection work is conducted by background subtraction. Xia [7] used the depth information from the KINECT device to do 2D chamfer matching and adopted some human features to figure out human shapes to conduct human activity tracking. Meltem [8] proposed a standard video tracking and person classification system. When a human is tracked under multiple video devices, the system puts the faces and the soft biometric features into the feature domain to develop an algorithm of feature extraction. This algorithm can acquire the features of the human sex, the human race, and other soft biometric features in the low-resolution video or in the unknown illumination video. It also solves the handoff problem between multiple video devices. Pantrigo [9] considered, in a video processing system, the descriptions of human activities under different situations such as sport technique analysis and video surveillance. A highly efficient system was proposed for multiple-object tracking, which can not only merge particle filtering and the memetic algorithm correctly but also track multiple targets precisely in image sequences and classify the extracted human beings if needed.
1.3 Overview of Proposed Methods
To reach the goal of this study mentioned above, at first we should construct a device for use as a 3D video surveillance system. The device is constructed in this study by use of multiple (nine) KINECT devices and all of them are placed in the
4
device at fixed positions. The device will be called an octagonal 9-KINECT imaging
device in the sequel of this thesis. More than one octagonal 9-KINECT imaging
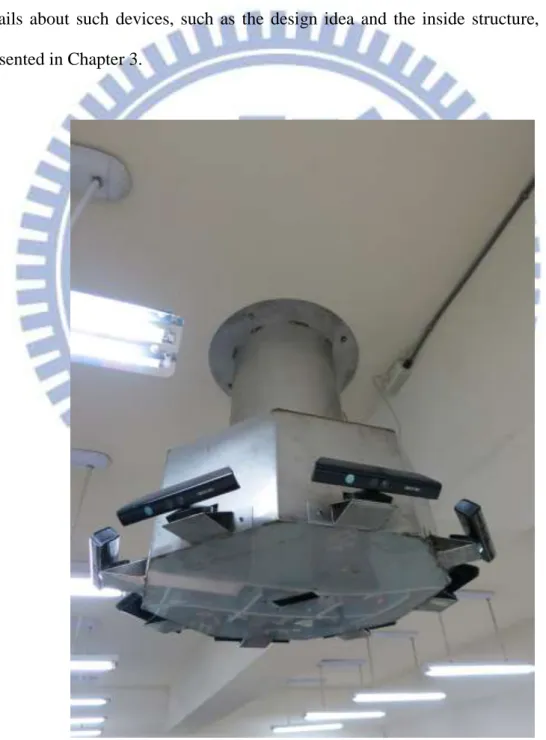
device have been produced in this study. A picture of one of such devices is shown Fig. 1.1. Each of them is then fixed on the ceiling of our experimental environment with a suitable height, and the KINECT devices in it may be used to acquire images of the environment around from top to bottom from the full view of 360o. More details about such devices, such as the design idea and the inside structure, will be presented in Chapter 3.
5
The next major task in the proposed system is integration of the data acquired with the octagonal 9-KINECT imaging device. Because the depth information acquired with each KINECT device is not 3D in nature, we convert the depth information acquired by the device into 3D data form. The detail about the data structure and the proposed method for such conversions will be introduced in Chapter 4. Some definitions will also be given in that chapter.
With the 3D data, we can calibrate the spatial relations between the KINECT devices before modeling the indoor environment. Because all of the KINECT devices are placed at fixed positions, it is easier to use a calibration target to conduct the calibration work. The details of the proposed calibration technique will be explained in Chapter 5.
After getting the results from the calibration process, we use them next to construct the indoor environment model. More specifically, we shift the 3D data for each KINECT device to a proper position for registering the data acquired by the neighboring device so that we can build up a complete indoor environment model. The details of the proposed shifting method and the modeling construction process will be described in Chapter 5.
After building up the environment model, we start to detect and track humans and associated activities. For this, we make two assumptions as follows.
1. The indoor environment is unchangeable all the time.
2. The detected motion objects are humans for security surveillance.
These assumptions are helpful for designing schemes to detect human activities, which will be presented in Chapter 6.
As for the purpose of tracking human activities, because the KINECT device can be tilted in space, we use this function to track human activities dynamically. Besides, because we use multiple KINECT devices, device handoff problems will occur in our
6
system, which will affect the ways of displaying the recorded data. We will explain our human tracking strategy and the proposed solution to the handoff problem in Chapter 6 as well.
Finally, when users browse the records of indoor monitoring, the proposed system will access the saved 3D data which have been recorded by the 9-KINECT imaging devices, and converted them to model any detected human. From the model, the system will also extract the features of the human, such as his/her height, body width, body thickness, etc. The details of the modeling algorithm and the feature extraction process are introduced in Chapter 7.
1.4 Contributions
Some contributions of this study are listed in the following.
1. Designing a 3D video surveillance system using multiple KINECT devices and integrating all the data acquired by different KINECT devices.
2. Displaying in 3D ways of the monitored environment after integrating all the view images acquired by the KINECT devices and providing different viewpoints for convenient browsing by the user.
3. Fully using the capabilities of KINECT devices by tilting the devices to track human activities dynamically.
4. Extracting more features from the human model than from 2D images such as height, body width and body thickness.
1.5 Thesis Organization
7
the configuration of the proposed system and the system process in detail. In Chapter 3, we introduce the design of the hardware device of the 3D video surveillance system in detail, and analyze its performance. In Chapter 4, we describe the proposed schemes for conversion of KINECT data into 3D image data, and correction of the conversion result. In Chapter 5, we describe the proposed methods to calibrate the KINECT devices and to model the indoor environment. In Chapter 6, we introduce the proposed human detection and tracking method. In Chapter 7, we introduce the proposed human modeling method and the 3D way we use for displaying the result. In Chapter 8, we will show some experimental results of the entire system process. At last, conclusions and some suggestions for future works are given in Chapter 9.
8
Chapter 2
Ideas of Proposed Methods and
System Design
2.1 Ideas of System Design
To complete the construction of the proposed 3D video surveillance system, it is important to design an appropriate structure of the video acquisition device for the system. The field of view of a single KINECT device is not wide enough, so we construct an octagonal 9-KINECT imaging device using multiple KINECT devices to extend the view of field. It not only can monitor an indoor environment which is large enough as a whole, but also can fully use the tilting mechanism in the KINECT device for dynamic human activity tracking. The detail of the octagonal 9-KINECT image device will be introduced in Chapter 3.
After constructing the octagonal 9-KINECT imaging device, we affix it on the ceiling of our experimental environment at a suitable height, and the KINECT devices in it are used to acquire image data of the around environment by tilting them from top to bottom for a full view of 360o. Because the KINECT devices in the octagonal 9-KINECT imaging device work individually and the computer controller acquires images sequentially, we set an image acquisition order for the KINECT devices. When acquiring the data from KINECT devices, we will sort the data by this order of KINECT devices.
Finally, we design several software process units to analyze the data acquired from the KINECT devices and display the result. More details about the hardware
9
devices which we use in this study and the software for processing image data and displaying the processing result will be described in Section 2.2. The system processes are introduced in Section 2.3.
2.2 System Configuration
In this section, we introduce the configuration of the proposed 3D video surveillance system. The hardware of the proposed system includes the KINECT devices we use in this study widely and the necessary devices for acquiring data from multiple KINECT devices. It will be introduced in detail in Section 2.2.1. In Section 2.2.2, we will describe the software development environment for processing data and displaying results.
2.2.1 Hardware Configuration
The sensor we use in this study widely is the KINECT device which is made by Microsoft. It consists of one RGB camera, a couple of 3D depth sensors, a set of multi-array microphone, and one motorized tilt. Its appearance is shown in Figure 2.1. Its vertical and horizontal viewing angles are 43 o and 57 o, respectively. Its vertical tilt angles range from 27 o to 27 o. Its sensing distances for the color image, the depth image, or the skeleton tracking ranges from 1.2 meters to 3.6 meters, but the actual sensing distance used in this study will be larger and will be discussed in Section 2.2.2. The maximum resolution of the color image and the depth image captured from the KINECT device is up to 1280960 pixels with a lower frame rate. For performance efficiency, we usually use the resolution of 640480 pixels and 320240 pixels in our system, and the frame rate is kept 30 fps. Its audio format is 16-kHz and 24-bit mono pulse code modulation (PCM). Its audio unit has a four-microphone
10
array with a 24-bit analog-to-digital converter (ADC), and a Kinect-resident signal processing unit with the functions of acoustic echo cancellation and noise suppression. In this study, we won’t use the audio device and the skeleton tracking function.
Figure 2.1 The KINECT device used in this study.
A single KINECT device uses a USB to deliver its data to the data-processing device (a computer), so the data-processing device should prepare more USB ports for multiple KINECT devices. Furthermore, the data volume delivered by a single KINECT device is too huge, so we can’t use a general USB port extension without adding a USB controller to the data-processing device. In this case, the KINECT device relies on more USB controllers than USB ports, so we should prepare more USB controllers instead of more USB ports for the data-processing device. As previously mentioned, we install the Aguila SU16T Base and the Aguila SU16T Expansion to our data-processing device to extend USB ports and controllers. The Aguila SU16T Base and the Aguila SU16T Expansion are shown in Figure 2.2. The
11
Aguila SU16T Base is installed on the mother board by PCI Express with 16 ports, and the Aguila SU16T Expansion is installed on the Aguila SU16T Base. The Aguila SU16T Base and the Aguila SU16T Expansion provide 8 USB controllers and each USB controller has 2 USB ports.
Figure 2.2The Aguila SU16T Base is on the top of PCI Express x16 and the Aguila SU16T Expansion is at the bottom.
2.2.2 Software Configuration
After the hardware of the 3D video surveillance system is constructed, we build up a data-processing system to implement the desired functions of the 3D video surveillance system. The system is written in the C++ programming language using the Microsoft Visual Studio 2010 development environment, and run under the Windows 7 operating system. The system initializes the KINECT device and acquires
12
the image data from the KINECT devices through the Kinect-for-Windows SDK, which is provided by Microsoft. By the way, the maximum sensing distance is 4 meters by using the Kinect-for-Windows SDK, because Microsoft considers that distances smaller than 4 meters is more precise than those larger than 4 meters. The system also uses open sources such as the Open Source Computer Vision (OpenCV) and the Open Graphics Library (OpenGL) to assist data processing. By using the OpenCV application programming interface (API), the system can process the image data easily, and display the result in 3D manners by the OpenGL API.
2.3 System Processes
With the hardware and software configuration completed, we will introduce the whole process of the proposed processing system in detail in this section. For this, we separate the system process into four parts.
The first part is a data conversion process. Because the depth information acquired from the KINECT devices is not 3D in nature, we should convert it to 3D data and the converted data can also be used for other processes. The detail of the conversion scheme will be described in Chapter 4.
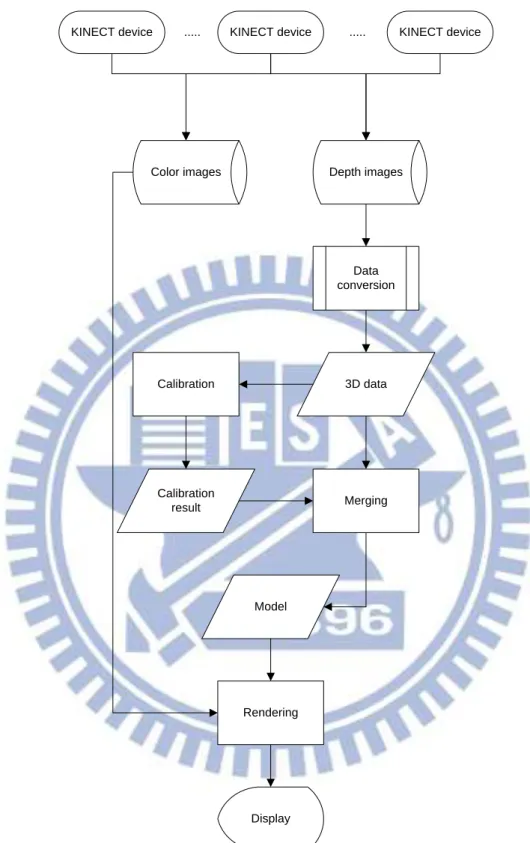
The second part is a model construction process of the indoor environment. First, we use the 3D data, which are obtained from the data conversion process just mentioned, from each KINECT devices to calibrate the spatial relation between KINECT devices. Afterwards, we use the calibration result to merge the 3D data and construct an indoor environment model. Finally, we show the model with color images in 3D manners. The flow of the process is shown in Figure 2.3, and the details of the calibration strategy, the merging algorithm, and the model display scheme will be introduced in Chapter 5.
13 KINECT device Calibration 3D data Calibration result Merging Model Rendering Display
KINECT device ... ... KINECT device
Data conversion
Color images Depth images
Figure 2.3The model construction process of the indoor environment
The third part is a process of human activity tracking. First, we use depth images to detect human activities. By the detection strategy used in this study, we conduct
14
background learning and noise elimination. The detail of human detection will be described in Section 6.2. Next, we use the result of detection to track human activities. When tracking human activities, we will adjust the tilter of the KINECT device dynamically. Furthermore, we will also change the viewpoint by the in-time handoff between KINECT devices and display the result with color images in 3D manners. The flow of the whole process is shown in Figure 2.4. The details of the tracking algorithm will be introduced in Section 6.3, and some experimental results will be shown in Section 6.4. KINECT devices Color Images Depth Images Which one detect? Do detect Learned background Detection process Noise elimination Tracking process Change tilting? Handoff display Rendering Tilting change process Handoff process Someone detect No one detect Detection part N o N o Yes Yes Tracking part
15
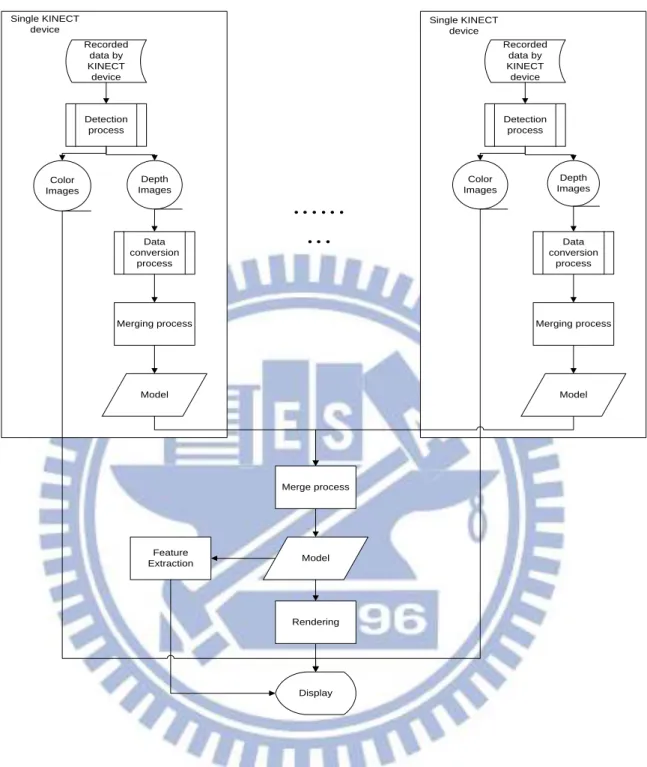
The forth part is a process of human model construction and human activity display. We will convert the 3D data, which are recorded by the KINECT devices, by a data conversion process proposed in this study to build up the human model. For this, at first we segment the human activity in each frame out from individual KINECT devices by using the detection method described in Section 6.2. Next, we merge the 3D data obtained for the individual KINECT devices. Then, we use the merging results of individual KINECT devices to merge again to build up a finer human model. Finally, we display the human model and show the human features extracted from the model. The whole process is shown in Figure 2.5, and the detail of the process will be introduced in Chapter 7.
16
……
…
Recorded data by KINECT device Merging process Model Depth Images Color Images Detection process Data conversion process Single KINECT device Recorded data by KINECT device Merging process Model Depth Images Color Images Detection process Data conversion process Single KINECT device Merge process Model Rendering Display Feature Extraction17
Chapter 3
Design of Proposed Octagonal
9-KINECT Imaging Device
3.1 Introduction to KINECT Device
In this study, we have designed an octagonal 9-KINECT imaging device for environment monitoring. About the basic unit of the imaging device, namely, the KINECT device, we have presented some of its basic specifications in Section 2.2.1, but we would like to introduce the structure of the KINECT device in detail in this section.
The height of the whole KINECT device is 70 millimeters, the width of the main part of the KINECT device is 283 millimeters, and the thickness of the main part of the KINECT device is 60 millimeters. The area of the basement of the KINECT device is 9072 square millimeters. The structure specifications are shown in Figure 3.1.
The KINECT device can also change its panning angle by manual adjustment, but we won’t use the panning angle in this study because the constructed 9-KINECT imaging device is hung high up on the ceiling for monitoring the environment from a higher position. The KINECT device contains a gravity sensor which can detect the tilting angle between the device and the ground. We will use this tilting function to monitor wider areas of the environment.
18
(a)
(b)
(c)
(d)
Figure 3.1 The Structure specifications for each part of the KINECT device. (a) The height of the KINECT device. (b) The width of the main part of the KINECT device. (c) The thickness of the main part of the KINECT device. (d) The area of the basement of the KINECT device.
19
3.2 Ideas of Proposed Design
In this study, we want to use multiple KINECT devices for the proposed 3D video surveillance system, but we can’t directly use multiple KINECT devices without being organized. So we propose the octagonal 9-KINECT imaging device to organize multiple KINECT devices. The idea of the design of this system is described in this section.
Firstly, we have to know how many KINECT devices we should use. As we mention in the previous sections, the horizontal viewing angles of a single KINECT device is 57o, so we should use at least 7 KINECT devices for a full view of 360o. In our design, we would like to use 8 KINECT devices to cover the full view with a certain degree of overlapping. But when we use the 8 KINECT devices to sense outward for a full view of 360o, there is a missing field of view which appears in the combination of the 8 views given by the 8 KINECT devices, namely, the middle part. So, we add an additional downward-looking KINECT device to make up the missing field of view. So, totally 9 KINECT devices are used to establish the system. The basic placement idea of the 9 KINECT devices is illustrated in Figure 3.2.
With the basic placement idea, we can make a container for the 9 KINECT devices as shown in Figure 3.3 which is a copy of Figure 1.1. We also consider the utility of the tilting device within each KINECT device, so we place the 8 KINECT devices, which are sensing outward for a full view of 360o, on their individual bases outside the container as shown in Figure 3.3.
20
Figure 3.2 The basic placement idea of the proposed octagonal 9-KINECT imaging device. The central KINECT device looks downward and the others senses outward.
3.3 Details of Design
With the design idea as described above, we will now introduce the design specification of the proposed octagonal 9-KINECT imaging device in detail. We will separate the design specification into three main parts: interchangeable bases for KINECT devices, the container, and the top part. The whole appearance of the octagonal 9-KINECT imaging device is already shown in Figure 3.3.
21
3.3.1 Interchangeable Bases for KINECT Devices
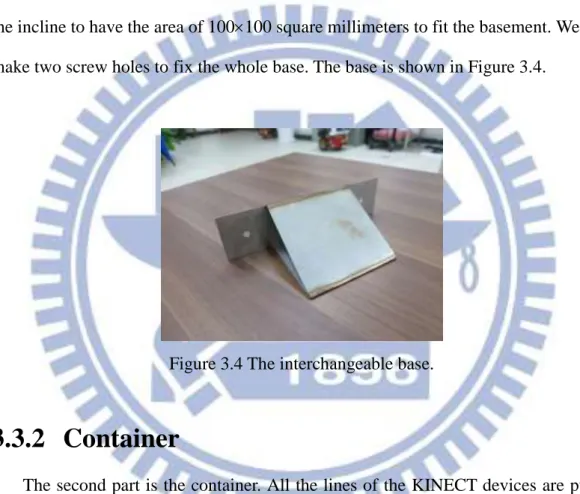
The first part is interchangeable bases for the outer 8 KINECT devices. We want to use the outer 8 KINECT devices to sense more information above the ground when the outer 8 KINECT devices are placed on the bases with a suitable height. Therefore, we designed an incline for every base. The tilt angle of the incline is 30o. Because the area of the basement of the KINECT device is 9072 square millimeters, we design the incline to have the area of 100100 square millimeters to fit the basement. We also make two screw holes to fix the whole base. The base is shown in Figure 3.4.
Figure 3.4 The interchangeable base.
3.3.2 Container
The second part is the container. All the lines of the KINECT devices are put in the container. We design the container in an octagon shape for the outer 8 KINECT devices. Because the width of the main part of the KINECT device is 283 millimeters and we don’t want to make collisions when changing the tilting angles of the KINECT devices, we designed each of the edges of the octagon to be 320 millimeters. The height of the octagonal container is 300 millimeters.
Then, on each side of the octagonal container, we make one square hole and two screw holes. The size of the square hole on the side of the octagonal container is
22
2525 square millimeters. For the each KINECT devices on the interchangeable base outside the octagonal container, we can put the transmission line and power line of the KINECT device into the container through the square hole. We also used the two screw holes to fix the interchangeable base.
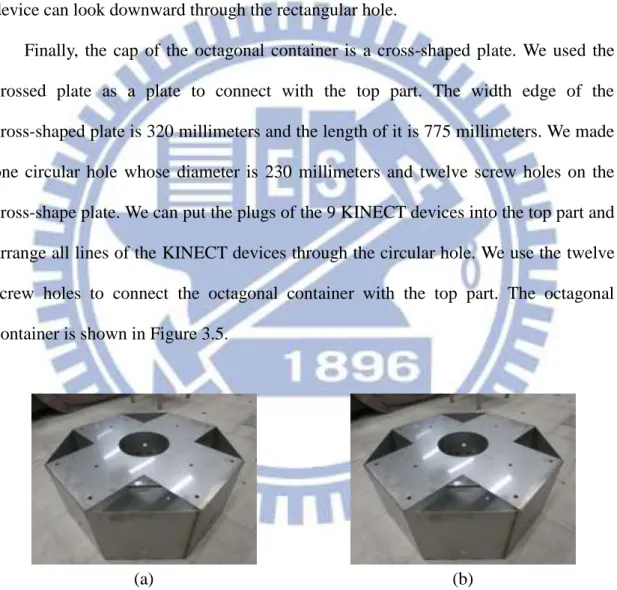
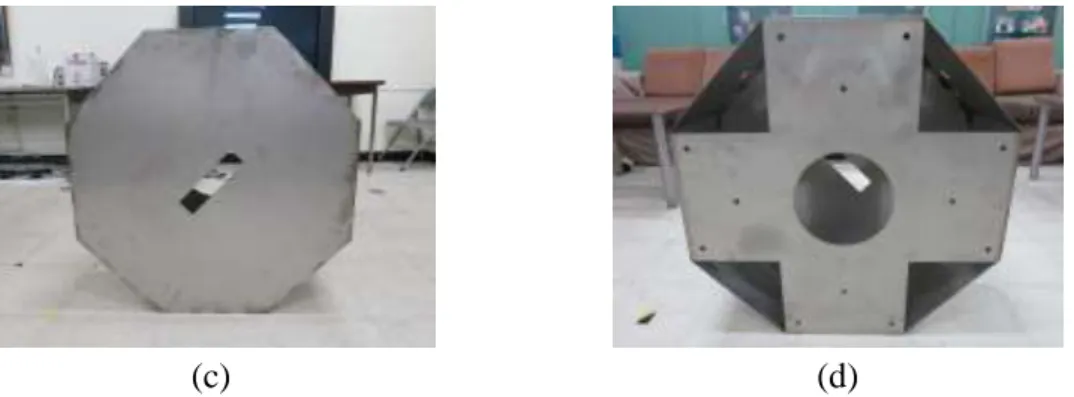
Furthermore, we made a rectangular hole whose size is 70150 square millimeters on the center of the bottom of the octagonal container. The inner KINECT device can look downward through the rectangular hole.
Finally, the cap of the octagonal container is a cross-shaped plate. We used the crossed plate as a plate to connect with the top part. The width edge of the cross-shaped plate is 320 millimeters and the length of it is 775 millimeters. We made one circular hole whose diameter is 230 millimeters and twelve screw holes on the cross-shape plate. We can put the plugs of the 9 KINECT devices into the top part and arrange all lines of the KINECT devices through the circular hole. We use the twelve screw holes to connect the octagonal container with the top part. The octagonal container is shown in Figure 3.5.
(a) (b)
Figure 3.5 The octagonal container. (a) The whole appearance of the octagonal container. (b) The side of the octagonal container. (c) The bottom of the octagonal container. (d) The cap of the octagonal container.
23
(c) (d)
Figure 3.5 The octagonal container. (a) The whole appearance of the octagonal container. (b) The side of the octagonal container. (c) The bottom of the octagonal container. (d) The cap of the octagonal container (cont’d).
3.3.3 Top Part
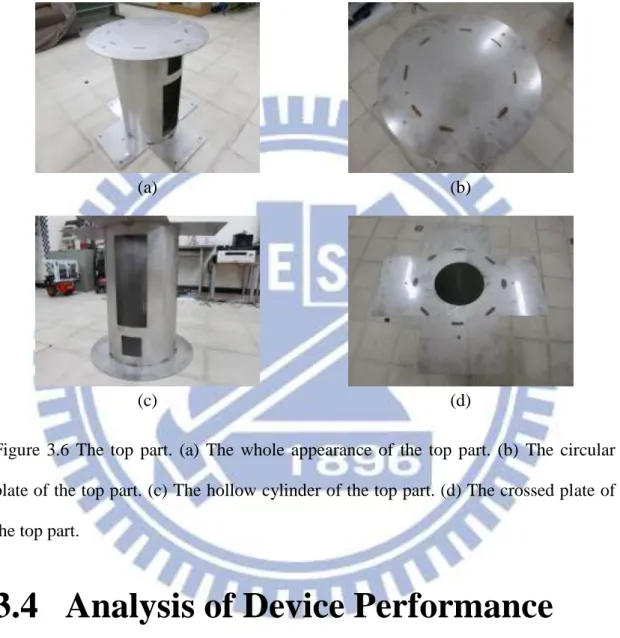
The third part is the top part. We separate the top in three parts. The first part of the top part is a circular plate. The diameter of the circular plate is 600 millimeters. There are four screw holes on the plate. We use the four screw holes to fix the whole octagonal 9-KINECT imaging device on the ceiling.
The second part of the top part is a hollow cylinder. We set two sockets of power extension cords in the hollow cylinder. The two sockets of power extension cords are used to extend the power lines of the 9 KINECT devices. The diameter of the hollow cylinder is 400 millimeters and its height is 650 millimeters. We make one square hole and one rectangular hole on the surface of the hollow cylinder. The size of the square hole is 100100 square millimeters. We put two plugs of the socket of the power extension cords into the outer socket through the square hole. The size of the rectangle hole is 400150 square millimeters. A user can put their hands into the octagonal 9-KINECT imaging device through the rectangular hole.
The third part of the top part is another cross-shaped plate. The design specification is the same as the cross-shaped plate of the octagonal container. A user
24
can arrange all lines of the 9 KINECT devices through the circular hole. We connect the top part and the octagonal container with the twelve screw holes. Finally, we welded the three parts of the top together. The top part is shown in Figure 3.6.
(a) (b)
(c) (d)
Figure 3.6 The top part. (a) The whole appearance of the top part. (b) The circular plate of the top part. (c) The hollow cylinder of the top part. (d) The crossed plate of the top part.
3.4 Analysis of Device Performance
In this study, we think the suitable height from the bottom of the octagonal 9-KINECT imaging device to the ground is 3,000 millimeters. If the suitable height is not 3,000 millimeters, we can change the hollow cylinder of the top part. The vertical tilt angle of the outer 8 KINECT devices on the interchangeable bases ranges from 3o to 57o. We can change the range of the vertical tilt angle by changing the
25
interchangeable base with the different tilt angle of the incline. But it should be noticed that the tilting device of the KINECT device won’t work, when the vertical tilt angle of the KINECT device is smaller than 60o, because of the gravity sensor on the KINECT device. We would like to use the range of the vertical tilt angle from to
3.4.1 Coverage of Views
With the height from the bottom of the octagonal 9-KINECT imaging device to the ground and the range of the vertical tilt angle, we can analyze the coverage of views of the octagonal 9-KINECT imaging device. We separate the analysis of the coverage of views into the color image side and the depth image side.
On the color image side, we use a single KINECT device to analyze the maximum and minimum sensing ranges of the field of view. The maximum sensing range is approximate 45,000 millimeters with a vertical tilt angle of the KINECT device. A diagram illustrating this case is shown in Figure 3.7. The minimum sensing range is approximate 2,350 millimeters with the vertical tilt angle of the KINECT device and an illustration diagram is shown in Figure 3.8.
We now analyze the coverage of views when all of the 9 KINECT devices are used. Because we want to have more overlapping views between the 9 KINECT devices to facilitate human model construction, we use the minimum sensing range. Also, we can use a circle whose diameter is approximate 6,730 millimeters to represent the coverage of views of the 9 KINECT devices from the top view, as can be figured out from the illustration diagram shown in Figure 3.9, in which the blue region is the view of the outer 8 KINECT devices, the red is the view of the inner KINECT device, and the yellow circle represents the coverage of views of the 9 KINECT devices.
26
On the depth images side, as we mentioned in the previous sections, the maximum sensing distance is 4 meters which is decided by the Kinect-for-Windows SDK provided by Microsoft. So the sensing range of the depth images is smaller than that of the color image, and an illustrative diagram is shown in Figure 3.10.
Figure 3.7 The maximum sensing range from the side view.
27
Figure 3.9 The coverage of views of 9 KINECT devices from top view. The blue region is the view of the outer 8 KINECT devices. The red is the view of the inner KINECT device. The yellow circle represents the coverage of views of the 9 KINECT devices.
Figure 3.10 The coverage of the views by the depth image from side view.
3.4.2 Imaging Sequence and Speed
As we mentioned in the previous sections, we acquire the data from the 9 KINECT devices sequentially. When we take a frame consisting of a color image and
28
a depth image from a single KINECT device, the frame rate of the device is 30 fps. In other words, we take a frame from a single KINECT device in 33 milliseconds. Then, when we use the 9 KINECT devices to take 9 frames sequentially, on the whole the imaging speed is 33 9 = 297 milliseconds, so the fps is 1/297 3.37. But we assume that the monitored object or human moves not too fast, so it will not be a problem to our processing work.
29
Chapter 4
Construction of 3D Images from
KINECT Images
4.1 Introduction
The data acquired from a KINECT device each time consists of a color image and a depth image. We call them KINECT images. The KINECT images are not 3D in nature and so inconvenient for processing for 3D video surveillance applications. So, we want to construct a corresponding 3D image from each pair of KINECT images. The 3D image contains three kinds of data. One is color data which come from the color image directly. Another is the 3D data which are obtained by converting the depth image into a 3D version. The third is a mapping array, which is obtained by using the Kinect-for-Windows SDK provided by Microsoft and is used as a tool for combining the former two parts, the 3D data and the color data. With the 3D image, we not only can conduct appropriate processing works required by a 3D video surveillance system more conveniently, but also can display results in 3D manners more easily.
4.2 Review of KINECT Image
Structures
In this section, we will introduce the structure of the KINECT images in detail. As we mentioned in the last section, the KINECT images include a color image and a
30
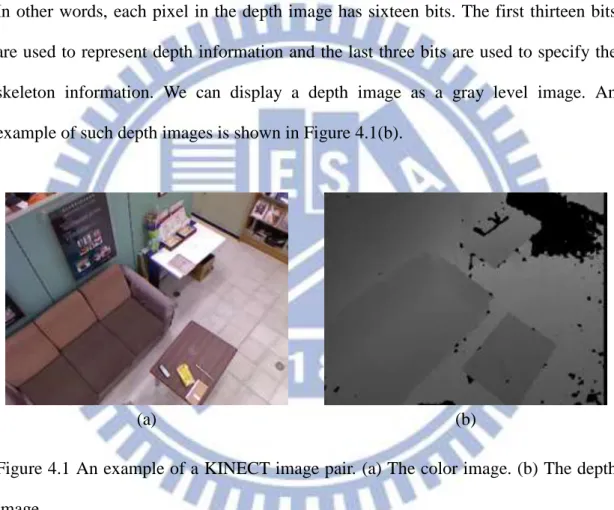
depth image. We use the KINECT device, which yields images with the resolution of 640480 pixels, together with the Kinect-for-Windows SDK to get KINECT images. Each pixel in the color image has four bytes. The first three bytes are used to show the color and the last one is used to show the skeleton information. We can directly display the color image as a picture. An example of such color images is shown in Figure 4.1(a). Each pixel in the depth image has a value of an unsigned short integer. In other words, each pixel in the depth image has sixteen bits. The first thirteen bits are used to represent depth information and the last three bits are used to specify the skeleton information. We can display a depth image as a gray level image. An example of such depth images is shown in Figure 4.1(b).
(a) (b)
Figure 4.1 An example of a KINECT image pair. (a) The color image. (b) The depth image.
4.3 Construction of 3D Images
4.3.1 Review of Pinhole Camera Model
The pinhole camera [10] is a simple camera model. Its structure is an opaque box with an aperture of only the pinhole size on one side. The light reflected from the
31
object and passing through the pinhole produces a projection of the scene in front of the pinhole. In the projection, right and left, and up and down are both reversed. An illustration is shown in Figure 4.2.
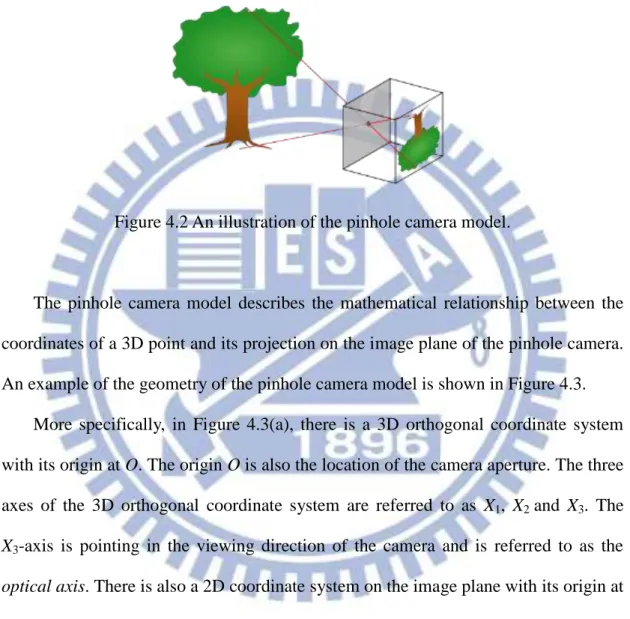
Figure 4.2 An illustration of the pinhole camera model.
The pinhole camera model describes the mathematical relationship between the coordinates of a 3D point and its projection on the image plane of the pinhole camera. An example of the geometry of the pinhole camera model is shown in Figure 4.3.
More specifically, in Figure 4.3(a), there is a 3D orthogonal coordinate system with its origin at O. The origin O is also the location of the camera aperture. The three axes of the 3D orthogonal coordinate system are referred to as X1, X2 and X3. The X3-axis is pointing in the viewing direction of the camera and is referred to as the optical axis. There is also a 2D coordinate system on the image plane with its origin at R. The origin R is at the intersection of the optical axis and is referred to as the image center. The two axes of the 2D coordinate system in the image plane are referred to as Y1 and Y2 which are parallel to the axes of X1 and X2, respectively. The distance from
point O to R is f. The distance f is referred to as the focal length of the pinhole camera. With the basic definitions given above, we can find out the relation between the point P with the 3D coordinates (x , 1 x , 2 x ) and the projection point Q with the 2D 3
32
coordinates (y , 1 y ). When we look in the negative direction of the X2 2-axis from
Figure 4.3(a), we get Figure 4.3(b). From the two similar triangles appearing in Figure 4.3(b), we can derive the following equation according to the similar-triangle principle: 3 1 1 x x f y . (4.1)
When we look in the negative direction of the X1-axis, the following equation can be
derived similarly: 3 2 2 x x f y . (4.2)
Summarizing these two equations, we get the following vector equation: 2 1 3 2 1 x x x f y y (4.3) which describes the relation between point P with the 3D coordinates (x , 1 x , 2 x ) 3
and the projection point Q with 2D coordinates (y , 1 y ). 2
(a) (b)
Figure 4.3 The geometry of a pinhole camera model. (a) Seen from a 3D point. (b) Seen from the X2-axis.
33
4.3.2 Idea of 3D Image Construction and Coordinate
Conversion
With the concept of the pinhole camera model, we can construct the 3D image from the depth image of the KINECT image by coordinate conversion. We will use Figure 4.3 to help us to explain the conversion process. From Equation 4.3, we get:
1 3 1 y f x x ; (4.4) 2 3 2 y f x x ; (4.5) f f x x 3 3 . (4.6)
and from Figure 4.3(a) and by the similar-triangle principle again, we have the equation:
2 2 2 2 1 2 3 2 2 2 1 3 f y y x x x f x (4.7) where 2 2 2 1 2 y y f is the length of the line segment OQ, and 2 2 2
1 2 3
x x x
is the length of the line segment OP which is the depth captured by the KINECT
device and is denoted as d in the sequel. Let R represent the center of the depth image, which is located at coordinates (320, 240) in a depth image of resolution 640480 acquired by the KINECT device. And let Q be a pixel located at image coordinates (x ,p y ), and let p y and 1 y represent the distance to the center R in the vertical and 2
horizontal directions, respectively. The focal length f of the KINECT device is 600. The equations (4.7), (4.4), (4.5) and (4.6) can be rewritten according to the mentioned parameter values to be:
2
2 2 3 600 240 320 p p y x d f x ; (4.8)34
320
600 240 3202 2 2 1 p p p x y x d x ; (4.9)
240
600 240 3202 2 2 2 p p p y y x d x ; (4.10)
600 600 240 3202 2 2 3 p p y x d x . (4.11)The unit of xp and yp is pixel and that of x , 1 x and 2 x is millimeter. With the 3
above equations, we can convert the depth image of the KINECT image into a 3D image. The color data of the 3D image uses the color image acquired from the KINECT device directly. The mapping array can be produced by using the Kinect-for-Windows SDK, provided by Microsoft, with the depth image of the KINECT image.
4.3.3 Construction Algorithm
With the required data for constructing the 3D image ready, we can use the construction algorithm to construct the 3D image. A flowchart of the 3D image construction algorithm is shown in Figure 4.4. The detail of the construction algorithm is as follows.
Algorithm 4.1: 3D image construction.
Input: a depth image Id and a color image Ic acquired from the KINECT device.
Output: a 3D image I3D formed from converted Id and original Ic combined with a
mapping array A.
Steps:
Step 1. Convert the coordinates of the depth image Id into 3D data by the coordinate
35
Step 2. Use the Kinect-for-Windows SDK provided by Microsoft with the converted depth image Id as input to get a mapping array A.
Step 3. Display the 3D image I3D by drawing 3D data in the 3D space with the corresponding color, which is produced by the color image Ic and the mapping array A, by the OpenGL.
Kinect image
Depth Image Color Image
Coordinate Conversion
3D Data
Produce Mapping Array
3D image Renderring
Mapping Array
36
4.4 Geometric Correction of 3D Images
4.4.1 Need of Correction
In our experiments of this study, when we displayed a plane in the 3D image, we discovered that the plane becomes a curved surface rather than a flat one. An example of such a phenomenon is shown in Figure 4.5. The reason why this problem arises is that the infrared light rays sent out by the KINECT device for depth sensing do not go in parallel. It affects the accuracy of the depth because the depth is not a vertical distance anymore. In order to solve this problem, we propose a method for the geometric correction of 3D images.
Figure 4.5 The 3D image of a plane (a wall).
4.4.2 Proposed Correction Technique by
Interpolation
37
approximate the curved surface formed by the 3D data of the 3D image. An illustration is shown in Figure 4.6. When the paraboloid equation is found, we can substitute the values of the coordinates x and y of each pixel of the 3D image into the paraboloid equation to compute the correction distance. Then, we subtract the correction distancefromthe value of the coordinate z of the 3D data of the 3D image, and we get the correction result.
But we discovered that when we use the KINECT device to sense planes with the different distances from the KINECT device, the degrees of the curvature for the curved surfaces formed by the 3D data of the 3D image are also different. So we try to find several paraboloid equations with different sensing distances from the KINECT device. And we use these paraboloid equations according to the value of the coordinate z of the 3D data of the 3D image to find suitable correction distances by the interpolation.
Figure 4.6 The paraboloid equation.
4.4.3 Correction Algorithm
38
and the process of the interpolation mentioned previously. The criterion of minimum sum of squared errors (MSSE) is used to decide the parameters of the approximating shape. That is, we will use the MSSE criterion to approximate the paraboloid. The detail of the process is as follows.
First, let the paraboloid equation be described by:
C y B x A zCorrection 2 2 (4.12) where C is the distance between the KINECT device and the apex of the paraboloid, as shown in Figure 4.6. The equation for computing the value SSE of the SSE is:
2 640 480 2 2 0 i i i i SSE z A x B y C (4.13) where x , i y and i z are the coordinates of a set of sample 3D data of the curved isurface. To find the coefficients A, B, and C which minimize the SSE value, we compute the partial derivatives of Equation (4.13) with respect to variables A, B, and
C, respectively, to produce the following equations:
640 480 2 2 2 0 2 i i i i 0 i z A x B y C x ; (4.14)
640 480 2 2 2 0 2 i i i i 0 i z A x B y C y ; (4.15)
640 480 2 2 0 2 i i i 1 0 i z A x B y C . (4.16)The values of A, B, and C are computed by solving the simultaneous equations (4.14), (4.15) and (4.16). For this, we substitute all the known values ofx , i y and i z into i
the simultaneous equations (4.14), (4.15) and (4.16) to get three three-variable linear equations. We use the substitution and elimination method to solve three three-variable linear equations. After solving these three independent equations, we can get the values of A, B, and C.
But, as mentioned we need more solutions of the values A, B, and C by using different sets of 3D data of the 3D image with different distances between the
39
KINECT device and the planes, and the results are shown in Table 4.1.
Table 4.1 Results of paraboloid coefficient estimations using different sets of 3D data of the 3D image with the different distances between the KINECT device and planes.
coefficient distance A B C 1003.62 (mm) 0.000495949 0.000499793 -1003.62 1535.92 (mm) 0.000323624 0.000380348 -1535.92 2120.88 (mm) 0.000232773 0.000281706 -2120.88 2560.30 (mm) 0.000188799 0.000248159 -2560.30 3111.78 (mm) 0.000155055 0.000205877 -3111.78
With Table 4.1, we can use it to decide which equations we will use to do interpolation by the value of the coordinate z of the 3D data of the 3D image. When the equations are found, we subtract the value of C of the equations themself from the equations to get correction equations. Then, we substitute the values of the coordinates x and y of the 3D data of the 3D image into the correction equations
to get correction distances. We use the correction distances and the values of the coordinates z of the 3D data of the 3D image to do the interpolation by the proration principle and get the result of the interpolation. Finally, we subtract the result of the interpolation from the value of the coordinate z of the 3D data of the 3D image to get the correction result. A flowchart of the correction algorithm is shown in Figure 4.7 and the detail of the correction algorithm is as follows.
Algorithm 4.2: correction algorithm.
40
Output: the correction value zCorrected.
Steps:
Step 1. Use the values of the coordinate z to find the paraboloid equations PEs. Step 2. Subtract the values of C from the paraboloid equations PEs themselves and
get correction equations CEs.
Step 3. Substitute the values of the coordinates x and y into the correction equations CEs to get the solutions zCorrections.
Step 4. Use the solutions zCorrections and the values of the coordinate z to do
interpolation and get the result zInterpolation.
Step 5. Subtract the result zInterpolation from the values of the coordinate z and get
final corrected value zCorrected.
3D Data Value of Coordinate x Value of Coordinate y Value of Coordinate z Find equations Equations Compute Result from Solving Equation Interpolation Result from Interpolation Subtraction Result of Correction
41
4.5 Experimental Results
4.5.1 Results of 3D Image Construction
We use the KINECT image to construct 3D images and display them by the OpenGL. An example of the results of 3D image construction is shown in Figure 4.8.
(a) (b)
(c) (d)
Figure 4.8 An example of construction of 3D images. (a) The color image of the KINECT image. (b) The depth image of the KINECT image. (c) The 3D image seen from the top. (d) The 3D image seen from a side.
42
4.5.2 Results of 3D Image Correction
We use the correction algorithm to correct the 3D data of the constructed 3D image and display the result by the OpenGL. But there is still a problem. That is, the corners of the 3D image are still curved irregularly. For this, on solution is to avoid the use of the 3D data of the corners of the 3D image. An example of the results of such geometric corrections for planes is shown in Figure 4.9. Another example of the results of such geometric corrections for an indoor environment is shown in Figure 4.10.
(a) (b)
(c) (d)
Figure 4.9 Results of geometric correction. (a) Original data seen from the top before correction. (b) Data seen from the top after correction. (c) Original data seen from the side before correction. (d) Data seen from the side after correction.
43
(a) (b)
(c) (d)
Figure 4.10 Results of geometric correction. (a) Original data seen from the top before correction. (b) Data seen from the top after correction. (c) Original data seen from the front before correction. (d) Data seen from the front after correction.
44
Chapter 5
Construction of 3D Indoor
Environment Model from Multiple
KINECT Images
5.1 Introduction
In this chapter, we describe how we construct the indoor environment model for 3D video surveillance using images acquired by the octagonal 9-KINECT imaging device. More specifically, we use the nine KINECT devices to get nine sets of KINECT images and convert them into nine 3D images individually. Then, we merge the nine 3D images to build up an indoor environment model. But, before doing so, we should calibrate the spatial relation between the nine KINECT devices in advance. The detail of the proposed calibration technique will be described in Section 5.2. After the calibration work, we use the results to merge the nine 3D images by shifting, rotating, and merging them to build up the indoor environment model. Finally, we display the model in 3D manners. The details of data merging and model displaying will be shown in Sections 5.3 and 5.4, respectively.