行政院國家科學委員會專題研究計畫 成果報告
內孤立波在一海底變化地形上的傳遞(3/3)
計畫類別: 個別型計畫 計畫編號: NSC93-2611-M-110-001- 執行期間: 93 年 08 月 01 日至 94 年 07 月 31 日 執行單位: 國立中山大學海洋環境及工程學系(所) 計畫主持人: 許榮中 共同主持人: 劉祖乾 計畫參與人員: 陳震遠 鄭明宏 報告類型: 完整報告 報告附件: 出席國際會議研究心得報告及發表論文 處理方式: 本計畫可公開查詢中 華 民 國 94 年 8 月 18 日
行政院國家科學委員會補助專題研究計畫期末報告
※※※※※※※※※※※※※※※※※※※※※※※※※※
※ ※
※
弧立內波在一海底變化地形上的傳遞(3/3) ※
※ Propagation
of Internal Solitary Wave
※
※
on a Variable Seabed Topography
※
※ ※
※※※※※※※※※※※※※※※※※※※※※※※※※※
計畫類別:x 個別型計畫 □整合型計畫
計畫編號:NSC 93-2611-M-110-001
執行期間:93 年 08 月 01 日 至 94 年 07 月 31 日
計 畫 主 持 人:許榮中
*
(國立中山大學海洋環境及工程學系)
計畫參與人員:陳震遠 (國立中山大學海洋環境及工程學系 研究生)
鄭明宏 (國立中山大學海洋環境及工程學系 研究生)
*
E-Mail : [email protected]
本成果報告包括以下應繳交之附件:
□赴國外出差或研習心得報告一份
□赴大陸地區出差或研習心得報告一份
□出席國際學術會議心得報告及發表之論文各一份
□國際合作研究計畫國外研究報告書一份
執行單位: 國立中山大學
中 華 民 國
94 年 08 月 15 日
行政院國家科學委員會專題研究計畫期末報告
弧立內波在一海底變化地形上的傳遞(3/3)
Propagation of Internal Solitary Wave on a Variable Seabed Topography
計畫編號:NSC 93-2611-M-110-001
執行期限:93 年 08 月 01 日至 94 年 07 月 31 日 主持人:許榮中 (國立中山大學海洋環境及工程學系) Laboratory experiments on internal
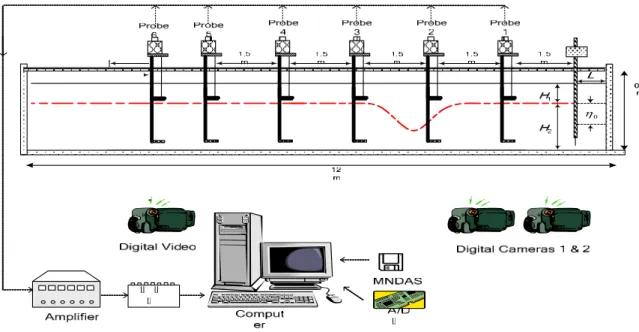
wave propagation were conducted using a two-layer fresh/brine stratified fluid system in a steel-framed wave tank of 12 m long, with cross section of 0.7m high by 0.5m wide. The experimental apparatus, including five ultrasonic gauges and other recording devices, are given in Fig. 1. A removable
sluice gate for generating internal waves was mounted on the right hand side in the tank, with a uniform slope made of rigid steel panel at other end. The toe of each test slope was located at between 8.18 m to 8.95 m from the gate, depending upon the slope used. Wave absorber was not installed at the downstream in the tank; thus allowing incidental waves to reflect back freely from the slope to the main test section in the tank.
Over all, a total of 69 runs were performed on uniform slopes and 124 runs for variable topography (including bottom obstacles in triangular and semicircular shapes).
Wave generation
Internal waves were generated by a “collapse mechanism”, resulting from a potential difference between the interface levels on either side of the gate. The number of internal solitary waves so produced was pre-evaluated by an equation given in Kao
et al. (1985) which was expressed as a
function of the upper and lower layer fluid thickness (H1 and H2, respectively), step length L (width of the small compartment on the RHS of Fig. 1) and step depth ηo (i.e. the difference between the interface levels). The total number of test runs performed for this
project is summarized, showing also the conditions of various physical parameters used in the experiments for tests on wave reflection from a uniform slope and over bottom obstacles in triangular or circular shape.
As in Fig. 2, a controlled condition of
h1 > H1 (h1 is the fluid thickness of the upper layer in the small compartment) provided fresh water with a positive elevation head to develop a clockwise overturning motion, thus causing an internal solitary wave of depression type. Alternatively, the condition of h2 > H2, a high brine water head in the small compartment, would develop an internal solitary wave of elevation type. Both of these had stable wave form. On the other hand, as in parts c and d in Fig. 2, an initially unstable internal solitary wave had to be inverted later to become a stable form. Wave propagation
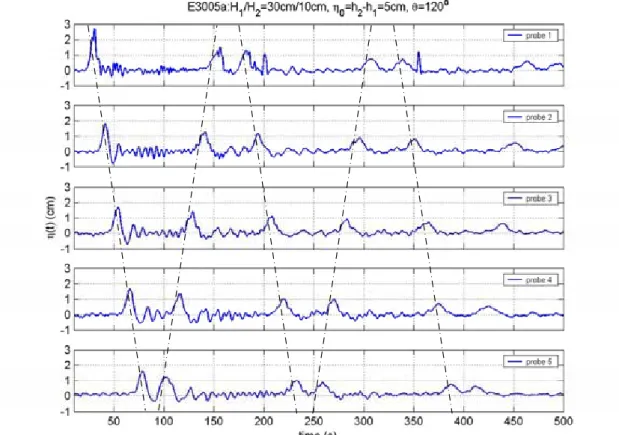
Once in a stable form after a sufficient distance from the sluice gate, an internal wave would propagate down the main compartment in the tank. The variations in amplitude were recorded by five ultrasonic probes placed at fixed positions with equal intervals along the tank (seen in Fig. 1). An example showing the time series of wave amplitudes at the positions of these five probes is illustrated in Fig. 3. In this
example, the initial peak at probe P1 was approximately 22 mm high, eventually reduced to about 17 mm while propagating down to probe P5 position. Upon encountering the uniform slope later, wave height collapsed slightly accompanying by a
widening of its peak and with some energy losses (in the last sub-graph in Fig. 3). However, the reflected peak remained approximately 11 mm high after returning to probe P1 position (the top sub-graph in Fig. 3). The dashed lines mark the propagation route of a soliton from P1 to P5 and then back to P1 upon first reflection from the slope and subsequent reflection from the sluice gate, and so on in the tank. The gradients of the first two dashed lines indicated wave speed about 123 mm/s for incident wave and 116 mm/s for reflected wave during its fist journey back to P1 position.
Wave breaking on a uniform slope
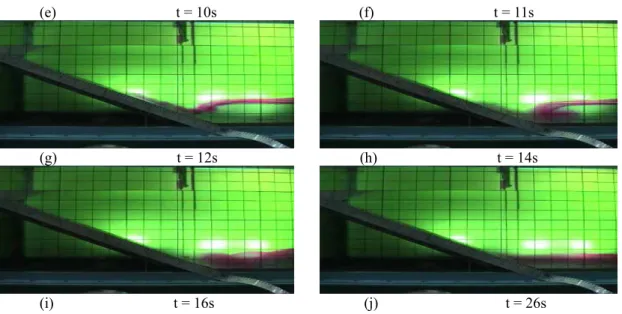
The evolution of an internal wave breaking on a slope was also studied. Fig. 4
demonstrates the events of interfacial oscillations over a complete cycle of incidence and reflection from a uniform slope. A shoaling internal wave on a slope was first affected by strong bottom shear and subsequent breaking. The breaking was responsible for high rates of energy dissipation and mixing in the post-breaking process. The instability criterion for internal waves on a slope ranging from 0o to 180o is suggested in Fig. 5, showing various
mechanisms likely for energy dissipation.
Interaction with a uniform slope
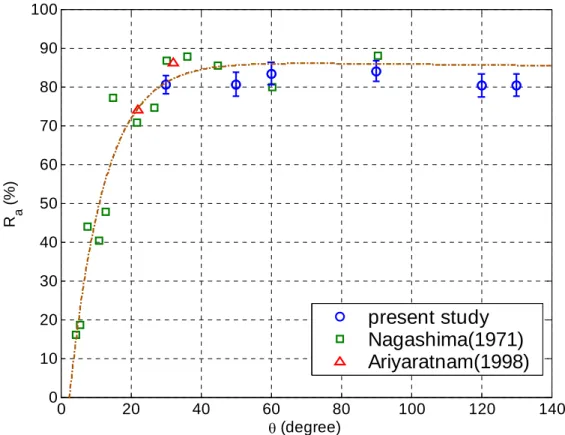
Experiments on wave reflection of internal waves from a uniform slope in a two-layer fluid were also conducted. Wave amplitudes were first recorded, from which reflection coefficients were calculated. The results for the present study, as seen in Fig. 6, agree well with that by Nagashima (1971)
and Ariyaratnam (1998) over the range of slope tested. Of particular, the present results offer a favorable extension of reflection coefficient on uniform slopes beyond that used previously by Nagashima (1971). The Ra values seemed to reach an asymptote for slopes equal and greater than 60o. However, data available exhibit a slight reduction in reflection coefficient for
inverse slopes greater than 90o, such as 120o and 130o tested in the present study.
Despite reflection coefficient might reach a constant value for large and steep slopes, including inverse slopes, it would be interest to see how these values may behave when the amplitude of incident wave increases or decreases, or when energy of an incident wave changes. The relationships among these physical parameters are illustrated in Fig.s 7 and 8, respectively.
In these graphs, regression analysis was applied to establish a best-fit curve, and the results suggest that the optimum reflection coefficient was around 0.85 for wave amplitude about 70 mm tested (Fig. 7), but decreased as amplitude increased beyond this optimum value. Similarly, the optimum reflection coefficient based on incident wave energy reached 0.77 as wave energy increased, then decreased as energy increased. It is sought that the decrease in reflection coefficients may be linked to energy losses through breaking.
Interaction with isolated obstacle
Tests on wave transmission over a bottom obstacle (sill) in triangular and semicircular shape were also conducted in the present project. Once a triangular obstacle was placed at the bottom inside the wave tank, internal wave was generated from which recording of the incident, reflected and transmitted waves over the sill were then performed. Preliminary results for these tests are summarized in Fig.s 9 to 11,
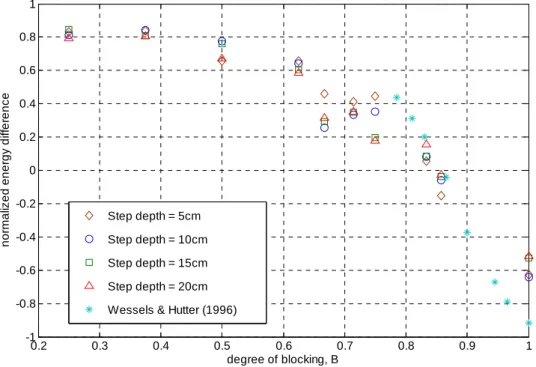
in a form similar to that in Fig.s 7 and 8. Blocking coefficient B is defined as the ratio of the sill height against the total depth of the bottom layer (hs/h2) in a two-layered fluid system. Thus, Fig.s 9 and 10 show the reflection and transmission coefficients against the incident wave height and wave energy, respectively, for various thickness ratios (hs and h2) and blocking coefficient (B). For small obstructions, the degree of blocking B<0.5, the normalized wave energy difference appears constant ∆E=0.8. This result is similar to the reflection coefficient of an ISW from steep uniform slopes. The wave energy dissipation results
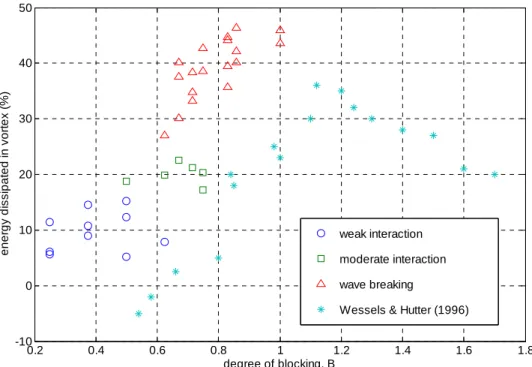
form viscous effect, and there is no any dissipation generated in vortex. For increasing degrees of blocking B>0.6, energy damping efficiently occurs and trends to a linear decay between B and ∆E until the limitation of B=1. A measure of energy loss in turbulence, which is the sum of the energies of transmitted and reflected waves, against the degree of blocking is shown in Fig. 10. In addition the degree of
wave-obstacle encounter is classified with scatterplot in Fig. 10, which shows energy dissipation in vortex is not only dependent on the degree of blocking but the incident wave amplitude. Therefore, wave amplitude and topographic effect might be combined into a parameter to investigate the deep relationship between these three factors. An additional parameter, blockage parameter ζ (= (a+H1)/(H-hs)) was efficient. According to the illustration in Fig. 11, the energy
dissipation is about 5% in minimum and 50% in maximum.
Acknowledgments
The authors are grateful for the National Science Council for financial supports under NSC 92-2611-M-110-001. References
1. Ariyaratnam, J. (1998). Investigation of slope stability under internal wave action. B. Eng. (Honours) thesis, Dept. of Environmental Engineering, The University of Western Australia, 121 pp. 2. Kao, T.W., Pan, F.S. and Renouard, D.
(1985). Internal solitons on the pycnocline: generation, propagation, shoaling and breaking over a slope. J.
Fluid Mech., 159: 19-53.
3. Nagashima, H. (1971). Reflection and breaking of internal waves on a sloping beach. J. Oceanographical Society of
Japan, 27 (1): 1-6.
4. Wessels, F. and Hutter, K. (1996) Interaction of internal waves with a topographic sill in a two-layered fluid. J.
Phys. Oceanogr., 26 (1): 5-20.
0
η
Fig. 1 Sketch of experimental set-up, showing a reflective slope in use (top panel), and over
triangular bottom obstacles (middle and bottom panels). Six pairs of ultrasonic probes and capacitance wave gauges were connected to an amplifier unit, then an A/D converter, where the digital signals of the internal waves were processed by “MNDAS” software resided in a personal computer.
1 H 2 H H 1 h 2 h 1 H 2 H H 1 h 2 h 1 H 2 H H 1 h 2 h 1 H 2 H H 2 h 1 h
Fig. 2 Laboratory arrangements for producing stable and unstable wave form of internal
waves in a two-layered fluid system. Four combinations of water levels were arranged for fluid thickness ratio of fresh and brine fluid on either side of a vertically removable gate. The variations in water levels on the LHS are configuration adopted in this study, while the RHS gives waveform development in the main section of the wave tank following the removal of the gate. Configuration in part (a) with h1>H1 and H1<H2 to produce stable solitary wave of depression-type; (b) with h2>H2 and H1>H2 to generate solitary waves of elevation-type; (c) with h1>H1 and H1>H2 to render an unstable form of depression later inverted into a ill-formed internal wave of elevation-type; and (d) with h2>H2 and H1<H2 to produce an unstable internal waves of elevation-type and developed into an ill-formed internal wave of depression.
Fig. 3 Time series of interfacial displacements recorded simultaneously at five locations of
equal distance apart in water of a constant depth. The dashed lines drawn at a negative slant mark the propagation of the internal solitary wave, and a positive dashed line for wave reflection. The slopes of these dashed lines are proportional to wave speed, producing a variation with wave decaying.
(a) t = 0s (b) t = 5s
(e) t = 10s (f) t = 11s
(g) t = 12s (h) t = 14s
(i) t = 16s (j) t = 26s
Fig. 4 Sequence of events showing the shoaling internal waves of elevation type on a steep
slope; the scale of a square is 5×5 cm, and the slope inclination was 30o.
θ
) 180 90 ( o o <θ< ) 90 0 ( o o < <θ ) 90 (θ= o ) 180 (θ= o ) 0 (θ= o ) 90 0 ( o o < <θFig. 5 A schematic diagram illustrating the mirror images of wave evolution for an ISW of
elevation or depression on a normal or inverse slope. The axis of θ=0o and 180o is the mirror which reflects the images. (Note: The regions in light shades represent the cases discussed in sections 3 and 4 of this paper).
0 20 40 60 80 100 120 140 0 10 20 30 40 50 60 70 80 90 100 θ (degree) R a (% ) present study Nagashima(1971) Ariyaratnam(1998)
Fig. 6 Amplitude-based reflection coefficient Ra versus bottom slope θ.
0 2 4 6 8 10 12 0.3 0.4 0.5 0.6 0.7 0.8 0.9 1 ai (cm) Ra θ = 30o θ = 50o θ = 60o θ = 90o θ = 120o θ = 130o
Fig. 7 Amplitude-based reflection coefficient versus incident wave amplitude fitted with a
0 1 2 3 4 5 0.3 0.4 0.5 0.6 0.7 0.8 0.9 1 Ei (J/m) RE θ = 30o θ = 50o θ = 60o θ = 90o θ = 120o θ = 130o
Fig. 8 Energy-based reflection coefficient versus incident wave energy fitted with a regressed
curve for laboratory tests of internal waves on a uniform slope.
0.2 0.3 0.4 0.5 0.6 0.7 0.8 0.9 1 -1 -0.8 -0.6 -0.4 -0.2 0 0.2 0.4 0.6 0.8 1 degree of blocking, B no rm a liz ed e n e rg y di ff er en ce Step depth = 5cm Step depth = 10cm Step depth = 15cm Step depth = 20cm Wessels & Hutter (1996)
Fig. 9 Normalized energy difference ∆Ε against degree of blocking B for different step depths
0.2 0.4 0.6 0.8 1 1.2 1.4 1.6 1.8 -10 0 10 20 30 40 50 degree of blocking, B en er gy di ss ip a te d i n v o rt ex ( % ) weak interaction moderate interaction wave breaking
Wessels & Hutter (1996)
Fig. 10 Normalized energy loss against degree of blocking B in a gyre caused at an isolated
submerged obstacle for different classification of wave-obstacle encounter and the results of Wessels and Hutter (1996).
0.2 0.4 0.6 0.8 1 1.2 0 5 10 15 20 25 30 35 40 45 50 55 (a i+H1)/(H1+H2-hs) E P (% ) weak interaction moderate interaction wave breaking
ζ
Figure 11 The relation between main wave dissipation rateEPand obstacle ratio ζ. c signifies
the weak interaction between obstacle and internal wave; signifies the moderate interaction between obstacles and internal wave; Â signifies wave breaking.