R E S E A R C H A R T I C L E
Open Access
Sex differences in the trajectories of and
factors related to extracurricular sport
participation and exercise: a cohort study
spanning 13 years
Wen-Chi Wu
1, Ling-Yin Chang
2*, Dih-Ling Luh
3, Chi-Chen Wu
4, Fiona Stanaway
5, Lee-Lan Yen
6and
Hsing-Yi Chang
4*Abstract
Background: Extracurricular sport participation and exercise (ESPE) refers to regular exercise/sport participation in addition to the physical education in school among a school-aged population. Rather than general physical activity, ESPE is typically deliberately initiated and presents an efficient target for interventions. However, compared to physical activity, relatively few studies have investigated sex differences in the development of and factors
associated with ESPE using a person-centered approach. This study aimed to examine the latent trajectories of ESPE from childhood to emerging adulthood across sexes, and to identify the associated sex-specific individual (i.e., body mass index, body dissatisfaction, stress, and screen behavior) and parental (i.e., parental exercise and parental screen behavior) factors.
Methods: This study used data from part of the Child and Adolescent Behavior in Long-term Evolution (CABLE) project, which comprised 2072 fourth graders (aged 9 years) in Northern Taiwan followed annually from 2001 to 2013 (13 waves). Repeated-measures latent class analysis was used to identify the trajectories of ESPE for males and females, respectively. Multinomial logistic regression was further used to identify sex-specific factors related to ESPE. Results: Four trajectories of ESPE were identified for males and females. For males, these trajectories were Rarely-to-Never (20%), Often-to-Rarely (32%), Always-to-Rarely-to-Never (21%), and Always (27%). For females, these trajectories were Rarely-to-Never (34%), Rarely (23%), Always-to-Rarely (33%), and Always (10%). We observed that the developmental patterns of ESPE varied by sex such that there was an earlier decline in the trajectories of ESPE in females than in males and that, compared with males, fewer females maintained exercise habits in young adulthood. Furthermore, we found several sex-specific factors related to ESPE, namely, stress, BMI, and parental exercise. Body dissatisfaction and individual screen behavior were associated with trajectories of ESPE for both sexes.
(Continued on next page)
© The Author(s). 2020 Open Access This article is licensed under a Creative Commons Attribution 4.0 International License, which permits use, sharing, adaptation, distribution and reproduction in any medium or format, as long as you give appropriate credit to the original author(s) and the source, provide a link to the Creative Commons licence, and indicate if changes were made. The images or other third party material in this article are included in the article's Creative Commons licence, unless indicated otherwise in a credit line to the material. If material is not included in the article's Creative Commons licence and your intended use is not permitted by statutory regulation or exceeds the permitted use, you will need to obtain permission directly from the copyright holder. To view a copy of this licence, visithttp://creativecommons.org/licenses/by/4.0/. The Creative Commons Public Domain Dedication waiver (http://creativecommons.org/publicdomain/zero/1.0/) applies to the data made available in this article, unless otherwise stated in a credit line to the data.
* Correspondence:lingyin@ntu.edu.tw;hsingyi@nhri.org.tw
2Institute of Health Behaviors and Community Sciences, School of Public
Health, National Taiwan University, No.17, Xuzhou Rd., Zhongzheng Dist, Taipei City 100, Taiwan
4Institute of Population Health Sciences, National Health Research Institutes,
No.35, Keyan Road, Zhunan, Miaoli County 350, Taiwan Full list of author information is available at the end of the article
(Continued from previous page)
Conclusions: We found distinct trajectories of ESPE from childhood to emerging adulthood for both sexes. The trajectories of ESPE for males and females, however, differ in terms of patterns and associated factors. Our findings suggest that efforts to increase ESPE should be initiated early, and may be made more effective by considering sex differences.
Keywords: Extracurricular exercise, Repeated-measures latent class analysis, Childhood, Adolescence, Emerging adulthood
Background
The World Health Organization (WHO) identifies phys-ical inactivity as the fourth leading cause of global mortal-ity [1]. Enhancing physical activity can yield substantial benefits for physical health, mental health, academic achievement, and cognitive outcomes [2–4]. Despite rec-ognition that engagement in regular physical activity should be developed early in life, namely during childhood and adolescence, 81% of adolescents across the world do not meet WHO recommendations regarding physical ac-tivity [5,6]. Instead of targeting physical activity, exercise and sport may be the more efficient areas in which to intervene [7,8]. Exercise is a subcategory of physical activ-ity that is planned, structured, repetitive and purposeful bodily movement in the sense that the improvement or maintenance of one or more components of physical fit-ness is the objective [8–10]. Sports includes all forms of competitive physical activities which are governed by for-mal or inforfor-mal rules [8,11]. In general, sport participa-tion and exercise are the major sources of activities that are of sufficient intensity and duration to yield moderate-to-vigorous energy expenditure for most of the populace [7,8]. Thus, increasing the quantity of sport participation and exercise will inevitably escalate the overall level of physical activity.
Extracurricular sport participation and exercise (ESPE), referring to regular exercise/sport participation in addition to the normal physical education, is a signifi-cant form of health-promoting physical activity [8, 12]. Normal physical education is typically disciplined and ruled by school and government policies. For instance, in Taiwan, every school is required to provide at least 2 h of physical education for each student per week. How-ever, given the tight school schedule, there is typically no other free time in which to exercise. Most students participate in physical education to fulfill school require-ments. However, these requirements may not be suffi-cient to meet the recommendation of at least 60 min of moderate-to-vigorous physical activity (MVPA) each day [4]. According to the information from the 2001 Na-tional Health Interview Survey in Taiwan, only 28.4% of adolescents and 21% of adults met recommended guide-lines [13, 14]. Thus, increasing the level of ESPE is a means to compensate for this deficit.
Although numerous longitudinal studies have identified a declining pattern of exercise/sport and physical activity during adolescence [15–19], not everyone has reduced the frequency with which they exercise. When the develop-mental patterns were retrieved using a person-centered approach, such as group-based trajectory modeling and repeated-measures latent class analysis, some studies found that a group of participants either maintained a high level of activity or delayed the decline in activity [19]. For example, a longitudinal study found that a group of adolescents (21%) maintained a stable higher level of MVPA from age 14 to 18 [20]. Similarly, Kwon and his colleagues identified a group of children (18%) who con-sistently maintained MVPA from age 5 to 19, and they further found that almost half of the children (46%) partic-ipated in organized sports during the follow-up time [21]. In addition, a recent reviewed article found that three out of 11 studies that retrieved trajectories of physical activity or sport participation among young populations discov-ered a highly active pattern of physcial activity [19]. Based on previous findings, it is likely that adolescents may fol-low different developmental patterns of extacurricular ex-ercise/sport, although no studies have specifically focused on this issue.
Sex differences in exercise/sport and physical activity have been well-established by scholars [22]. However, mixed findings in the existing literature suggest that the role of sex in the development of exercise/sport still re-quires further investigation. In terms of the longitudinal patterns of physical activity, Farooq et al. [17] found that while a subgroup of boys (18.8%) maintained a high level of MVPA from the age of 7 to 15 years, the level of MVPA for the remaining boys and all the girls de-creased. Another study found that one third of both the boys and girls continued high-frequency organized phys-ical activity from age 4 to 17 years [23]. There is also a study which found that only 9% of the girls but a third of the boys maintained MVPA [24]. Addtionally, regard-ing the rates of change in vigorous activity, a longitu-dinal study monitoring adolescents from the age of 7 to 11 years found that physical activity among girls de-creased more rapidly than among boys [25], while an-other study found no significant difference in rates of decline between sexes [17]. Moreover, pertaining to the
context of physical activity, a longitudinal study follow-ing a group of American adolescents from the age of 10 to 12 years found that girls increased MVPA during after-school hours, whereas boys maintained MVPA; however, no sex difference was found in school-time MVPA [18]. These inconsistent results substantiate the need to understand the effects of sex differences in the distinct developmental patterns of ESPE and factors that contribute to such disparities.
Regarding factors associated with ESPE, reseach [26–29] has found that children and adolescents’ exercise/sport participation could be influenced by factors of different contexts according to Bandura’s Social Learning/Cognitive Theory [30] and Bronfenbrenner’s bioecological model
[31]. Among many contexts, family is the most important in terms of helping children to develop exercise habits [26]. Specifically, parental modeling and support affect children’s physical activity by the observational learning process and positive outcome expectations [32]. For ex-ample, one study proved that parental organized physical activity increased their children’s extracurricular sport participation [33]. Another study showed that parental sedentary behavior was also associated with children’s physical inactivity [34]. In addition, both theories emphasize the contributions of individual factors on the development of children’s behavior. There is also empir-ical evidence of several individual characteristics that in-fluence sport participation and exercise among children, including physical factors, such as body mass index (BMI) [35], psychological factors, such as body dissatisfaction [36] and stress [37], as well as behavior factors, such as sedentary behavior [38].
There is also evidence of sex differences in the import-ant individual and parental determinimport-ants of exercise/ sport participation. Regarding individual factors, females with a lower BMI were found to have a higher probabil-ity of exercising, whereas body mass had no significant association with exercise in males [39]. Additionally, higher body dissatisfaction (indicated by greater body shame and higher appearance anxiety) was associated with decreased rates of participation in physical activities by females [36] but increased exercise engagement among males [40]. Furthermore, males with a higher level of stress might be more likely to exercise than fe-males because fe-males are inclined to use exercise as a coping strategy [41]. Moreover, males who reported more on-screen time were more likely to fail to achieve the recommended MVPA level due to lower availability of time for exercise, but this association was not found for females [42]. Regarding parental factors, parental ex-ercise was found to only associate with boys’ exex-ercise participation [43, 44]. Research has also demonstrated sex differences in influences of parents’ screen behavior on their offspring’s screen behavior [45], which could
result in different levels of sport participation and exer-cise in boys and girls. However, whether these factors have sex-specific associations with trajectories of ESPE is yet to be explored.
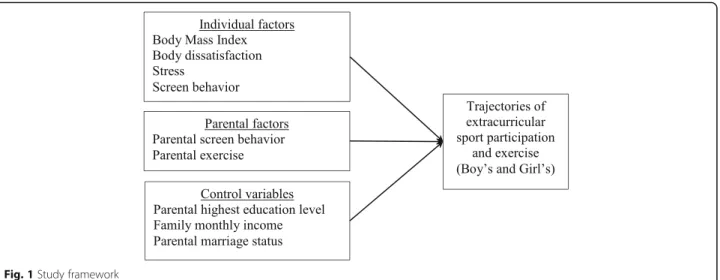
To fill these gaps in the literature, this study aimed to (1) depict the trajectories of ESPE in males and females from childhood to emerging adulthood, and (2) identify sex differences in factors associated with ESPE trajector-ies. Figure1shows the study framework; it indicates the associations of individual and parental factors as well as the control variables with sex-specific ESPE trajectories. To the best of our knowledge, this is the first longitu-dinal study focusing on the sex-specific developmental patterns of ESPE over a long lifespan (i.e., 13 time points) and further examining whether factors related to these distinct patterns vary by sex. Establishing the de-velopmental patterns of ESPE, such as whether they are increasing, decreasing, or being maintained, and their as-sociated factors can help facilitate the development of ef-fective exercise-enhancing programs.
Methods
Participants, design and setting
Data for this secondary analysis were obtained from the Child and Adolescent Behaviors in Long-term Evolution (CABLE) project. The study commenced in 2001 and followed participants annually until 2016. The CABLE project aimed to investigate the develop-ment of healthy behaviors from childhood to adoles-cence based on a socioecological model. The project incorporated multi-level factors including individual, interpersonal, organizational, and community regard-ing health lifestyle and health behavior. For example, individual-level factors included sociodemographic characteristics, personality, and lifestyle of students. Interpersonal-level factors consisted of family inter-action, family support, family conflict, and peer rela-tionship. In terms of organizational-level factors, the CABLE project collected information regarding several school characteristics such as size and facilities. Fi-nally, the community-level factors included commu-nity cohesion and safety.
Participants were cluster-sampled from all public elementary schools in Taipei City and Hsinchu County in Taiwan based on a list of names provided by the Min-istry of Education in 2001. Nine schools from each area were selected. Two cohorts, first and fourth graders in each school, were followed. Further details regarding the sampling process, sample size calculations, and instru-ment developinstru-ment are described elsewhere [46]. Signed informed consent was provided by the parents or pri-mary caregivers of all participating students.
In the CABLE project, data were collected from stu-dents and their parents. Regarding the stustu-dents, first to
ninth graders completed their questionnaires in the classroom under the supervision of trained instructors. From the 10th grade onwards, students were interviewed individually by trained interviewers. The questionnaire consisted of two sections, namely self-administered, in-cluding private questions such as health behaviors and emotions, as well as interviewer filled-in, including sociodemographic background and school-related ques-tions. The interviewers may interview the participants in any place they felt comfortable, such as a fast-food store or the student’s home, and the completed questionnaire was mailed to the CABLE team. The measurement of ESPE was included in the self-administered section. In the first four annual assessments, students also brought the maternal- and paternal-versions of the question-naires home to their parents or primary caregivers. The questionnaires, which inquired about the parental educa-tion level, family income, marital status, and parental be-haviors, were completed by the primary caregivers and then mailed back to the research team using a sealed en-velope. The project was approved by the Human Re-search Medical Ethics Committee of the National Health Research Institutes in Taiwan (EC9009003).
In this study, we analyzed data from the second cohort (fourth graders), who were followed and interviewed an-nually from 2001 to 2013 (aged 9 to 21 years, 13 waves). The completion rate for each year was equal to the number of participants who completed the questionnaire in a specific year divided by the number of participants in the first year. During the study period, the completion rate ranged from 81.6 to 98.1%. The final analytical sam-ple comprised 2072 participants (1075 males and 997 fe-males) who were enrolled in 2001 and who provided at least one wave of data on the measure of ESPE. Overall, 46.53% of participants provided ESPE data in all 13 waves, and 13.61, 7.53, 7.92, 6.03, 4.01, 2.12, 3.47, 1.69, 1.30, 1.88, 0.97, and 2.94% of participants provided ESPE
data in 12 waves to one wave, respectively. Reasons for the attrition rate included moving, refusal to be inter-viewed, health issues, and loss of contact.
Measures ESPE
The measurement of ESPE was assessed annually by ask-ing participants “Not counting normal physical exercise courses in school, have you exercised/participated in sports in the past week?”. The possible responses were “1 = never,” “2 = rarely (one or two days),” “3 = often (three to six days),” and “4 = always (every day).” The inter-method reliability was used to examine the reliabil-ity of this one-item measurement by correlating it with another three-item measure of physical activity assessed in the 12th wave that determined whether individuals met the WHO’s recommendation of physical activity. A positive association was found between the one-item and three-item measurements, and indicated good reli-ability of the one-item measurement used in the current study. Appendix 1 provides the detailed information of the calculation.
Related factors
This study examined the sex-specific effects of several individuals and parental factors on the trajectories of ESPE. Specific measures for each factor are described as follows.
Individual factors All individual factors were measured from 2001 (aged 9 years) to 2006 (aged 14 years), and scores at each wave were averaged to reflect the mean levels of each factor. BMI was measured by self-reported weight (kg) divided by the square of height (m2). The current BMI measure had high correlations with the ob-jective measures of BMI deriving from the height and weight assessed by school nurses in the 2nd and 6th
waves (r = 0.85 and 0.84, respectively). The good agree-ment between methods indicates that the self-reported height and weight is a reliable proxy measure of BMI [47]. Body dissatisfaction was measured using four items, namely self-perceived satisfaction with appearance, fig-ure, height, and weight [48], all of which were rated on a 5-point scale ranging from 1 (very satisfied) to 5 (very unsatisfied). The body dissatisfaction score was obtained by summing the four items, with higher scores indicat-ing a higher level of body dissatisfaction (Cronbach’s alpha of 0.68 to 0.72). Stress was assessed using ques-tions adapted from a previous study [49] that asked par-ticipants to rate their perceived levels of stress from eight different sources (e.g., academic performance, rela-tionships with friends, and relarela-tionships with parents). All items were rated on a 5-point scale ranging from 0 (absolutely no stress) to 4 (extremely high-level stress) and were summed to create an overall stress score (Cronbach’s alpha of 0.79 to 0.84). Screen behavior was assessed using two items:“Have you used a computer or played video games continuously for more than two hours in the past week?” and “Have you watched televi-sion continuously for more than two hours in the past week?” All responses were rated on a four-point scale ranging from 1 (never) to 4 (every day). The level of screen behavior was computed by summing the frequen-cies of these two items. Because screen behavior was measured by two-items, the Spearman-Brown coefficient was the most appropriate reliability statistic [50]. The Spearman-Brown coefficients for screen behavior were from 0.52 to 0.69 across the six waves.
Parental factors Parental exercise was measured by one item adapted from other survey studies [51, 52] asking parents“Have you exercised in the past week?” and was dichotomized as “regular exercise” (defined as at least one parent had often or always exercised) and“irregular exercise or no exercise.” Parental screen behavior was measured at each wave from 2001 to 2004 using the same two items that assessed students’ screen behavior. Response categories for these two items, which ranged from 1 (never) to 5 (always), were summed and averaged across 4 years to reflect the level of parental screen be-havior. Spearman-Brown coefficients of parental screen behavior ranged from 0.28 to 0.34, which falls in the op-timal range (i.e.,0.2–0.4) according to Briggs and Cheek’s suggestion [53].
Control variables
Parental education, household income, and marital sta-tus were included as control variables based on the pre-vious evidence of associations between these social demographic variables and exercise [39]. All control var-iables were collected between 2001 and 2004 and
reported by parents or primary caregivers. Parental edu-cation was measured as the highest level of eduedu-cation attained by either parent and was coded as low (less than or equal to 12 years) or high (more than or equal to 13 years). Monthly household income was averaged across 4 years and categorized as low (less than 59,999 new Taiwan dollars (NTD; 1 NTD≈ 0·03 $US), medium (60, 000–119,999 NTD), or high (more than 120,000 NTD) income groups. Parental marital status was dichoto-mized as married or not married.
Analytic procedure
Descriptive statistics included means, standard deviations, and study variable distribution. Student’s t-test and chi-square test were used to identify associations between the study variables and sex. Repeated-measures latent class analysis (RMLCA) was used to identify distinct ESPE tra-jectories from childhood to young adulthood [54]. RMLCA is a statistical method that can be used to cluster individuals into a number of latent classes based on the pattern of responses to the ESPE questions at discrete time points [54]. All models were estimated using SAS version 9.4 (SAS Institute Inc., Cary, NC) via Proc LCA. The number of latent patterns was determined using 1) fit indices, namely the Akaike Information Criterion (AIC), Bayesian Information Criterion (BIC), and sample size-adjusted BIC, where a lower value indicates a better model; 2) average classification probability (ACP), where a higher value indicates better classification; and 3) inter-pretation of latent groups. According to a recent simula-tion study, BIC was preferred when comparing models [55]. We performed multiple group comparisons to deter-mine potential sex differences [56] and found that the la-tent classes of exercise varied by sex. RMLCA and subsequent analyses were therefore stratified by sex. Finally, multinomial logit models were used to examine associations between related factors and different trajec-tories of ESPE across sex.
Missing data
In RMLCA, missing data were addressed using the max-imum likelihood estimation [54]. For the multinomial lo-gistic model, only complete data were used (n = 1701, 82.09%). We compared the analytic sample with those that had missing data and found no differences between the two samples in terms of sex, body dissatisfaction, stress, screen behavior, parental education, parental ex-ercise, and parental screen behavior. However, those with missing data were significantly more likely to have a lower level of BMI (18.9 vs. 19.6), parents who were not married (18.6% vs. 12.8%), or parents with low edu-cation (32.7% vs. 29.16%). A sensitivity analysis was performed to assess the robustness of the findings. This involved comparing results by using a multiple
imputation strategy with results applying a list-wise dele-tion technique [57]. Twenty sets of missing values were imputed when conducting multiple imputations by using Markov Chain Monte Carlo methods, and the results of each data set were then combined to perform multi-nomial logistic regressions.
Results
Sample characteristics
The descriptive statistics are presented in Table1. Sex dif-ferences were evident in individual factors. For instance, males had higher BMI and engaged in more frequent screen behavior than females. By contrast, females were more dissatisfied with their body and expressed a higher level of stress than males. Among parental factors, no sex differences were identified. Most of the parents reported having exercised irregularly or not exercised in the past week (n = 1195, 62.57%). The average frequency of paren-tal screen behavior ranged from rarely to sometimes. In terms of control variables, a greater proportion of males had parents with high-level education (41.46%) than did females (36.03%). There were no significant differences in other control variables across sex. The majority of parents
were married (n = 1716, 86.14%) and had a monthly household income of between 60,000 and 120,000 NTD (equals to 2000 to 4000 USD) (n = 983, 49.62%).
Trajectories of ESPE from ages of 9 to 21 years
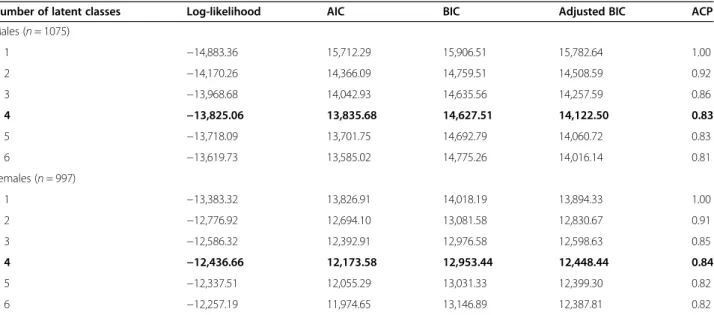
Table2displays the results of fit indices for LCA models with different numbers of latent groups. For males, the log-likelihood statistic fell substantially when the num-ber of latent classes increased to four. The four-class model also had the lowest BIC (14,627.51) and high ACP (0.83), indicating that it was the best-fitting model. For females, the model with four groups was also the best-fitting, with the lowest value of BIC (12,953.44) and a relatively high ACP (0.84).
Table 3 shows the item-response probabilities for males. Class 1 was the largest class (32% of males) and was labeled as“Often-to-Rarely.” Children who belonged to the Often-to-Rarely class had a high probability of often engaging in ESPE from the age of 9 years, but this changed to rarely engaging in ESPE after they entered high school (aged 14 years). Class 2 was labeled “Rarely-to-Never” (20%) and consisted of participants who rarely engaged in ESPE from the age of 9 years and then never
Table 1 Descriptive statistics for multi-faceted related factors across sex
Related Factors Total
(n = 2072) Male (n = 1075) Female (n = 997) P-value
n mean or % SE n mean or % SE n mean or % SE
Individual factors
Body Mass Index (averaged) 1952 19.56 0.08 1013 20.04 0.12 939 19.03 0.10 < 0.001
Body dissatisfaction (Range: 4–20, averaged) 1791 11.92 0.07 924 11.15 0.10 867 12.74 0.10 < 0.001
Stress (Range: 0–32, averaged) 1792 10.10 0.12 924 9.24 0.17 868 11.01 0.17 < 0.001
Screen behavior (Range: 2–8, averaged) 2011 3.91 0.03 1043 4.19 0.04 968 3.60 0.03 < 0.001
Parental Factors
Parental screen behavior (Range: 2–10, averaged) 1995 4.84 0.03 1035 4.87 0.04 960 4.79 0.04 0.165
Parental exercise
Regular 715 37.43% 366 37.12% 349 37.77% 0.769
Irregular or no exercise 1195 62.57% 620 62.88% 575 62.23%
Control variables
Parental highest education level
Low (<= 12 years) 1256 61.15% 624 58.54% 632 63.97% 0.012
High (> = 13 years) 798 38.85% 442 41.46% 356 36.03%
Family monthly income (averaged)
Low 584 29.48% 287 27.92% 297 31.16% 0.083
Medium 983 49.62% 508 49.42% 475 49.84%
High 414 20.90% 233 22.67% 181 18.99%
Parental marriage status
Not married 276 13.86% 147 14.22% 129 13.47% 0.628
Married or living together 1716 86.14% 887 85.78% 829 86.53%
Individual-level factors were averaged based on available data from 2001 to 2006
engaged in ESPE when they were 17 years old. Class 3 accounted for 21% of males and was labeled as “Always-to-Never.” This included participants with a high prob-ability of always engaging in ESPE from the age of 9 to 14 years and a high probability of never engaging in ESPE after the age of 18 years. Class 4 was labeled as “Always” (27%) and consisted of participants with the highest probability of always engaging in ESPE over time. The average probability of correctly classifying par-ticipants into each latent class was 0.79, 0.86, 0.81, and 0.83 for classes 1, 2, 3, and 4, respectively.
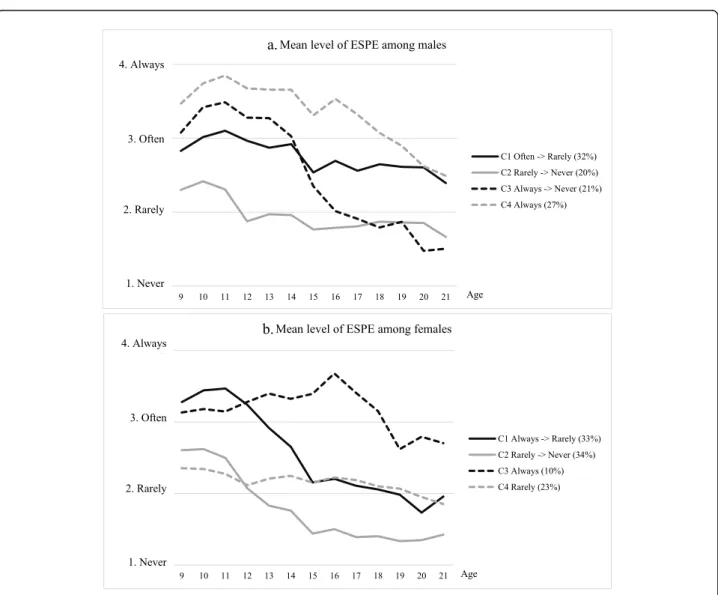
Regarding the four latent classes of ESPE for females, Class 1 was labeled as “Always-to-Rarely” and accounted for 33% of females. Females in this class had a high prob-ability of always engaging in ESPE from the age of 9 to 11 years, and an increasing probability of rarely engaging in ESPE from the age of 14 years. Class 2 (34%) was labeled as “Rarely-to-Never” and included female participants who had a high probability of rarely engaging in ESPE at the be-ginning of the study and a high probability of never en-gaging in ESPE from the age of 14 years onwards. Class 3 was the smallest class (10%) and labeled as “Always,” as they had the highest probability of always engaging in ESPE over time. However, although the pattern of the “Always” class for females was similar to that for males, the propor-tion of females was much smaller (10% of females vs. 27% of males). Class 4 was labeled as“Rarely” and included fe-males who had the highest probability of rarely engaging in ESPE over time. The average probability of correctly classi-fying female participants into each latent class was 0.82, 0.85, 0.89, and 0.82 for classes 1, 2, 3, and 4, respectively. The average level of ESPE by sex and age for every trajec-tory group is presented inAppendix 2.
Factors associated with trajectories of ESPE
Table 4shows the results of multinomial logistic regres-sions for males and females. Similar results were ob-served in the sensitivity analysis with complete data based on a multiple imputation strategy (Add-itional files 1). We use the “Rarely-to-Never” class, the lowest level of ESPE, as the reference group, because we can investigate the factors which can promote partici-pants’ ESPE. The results indicated that males who had higher levels of body dissatisfaction were significantly less likely to be categorized in the “Often-to-Rarely,” “Always-to-Never,” and “Always” classes. Furthermore, males who had higher stress were significantly less likely to be categorized in the“Always-to-Never” and “Always” classes. In addition, males who reported more frequent screen behavior had a lower probability of being catego-rized in the “Often-to-Rarely” class, but a higher prob-ability of being categorized in the “Always-to-Never” class. Regarding parental factors, males with regularly exercising parents had higher probabilities of being cate-gorized in the“Always-to-Never” class and the “Always” class than did their counterparts.
For females, again using the“Rarely-to-Never” class as the reference group, those with a higher BMI level had a higher probability of being categorized in the “Always-to-Rarely,” “Always,” and “Rarely” classes (Table 4). Fe-males who were more dissatisfied with their body were less likely to be categorized in the“Always” and “Rarely” classes. Females who reported more frequent screen be-havior were also significantly less likely to be categorized in the “Always-to-Rarely” and “Rarely” classes. No par-ental behavioral factor was found to be associated with trajectories of ESPE for females.
Table 2 Determining the number of latent groups
Number of latent classes Log-likelihood AIC BIC Adjusted BIC ACP
Males (n = 1075) 1 −14,883.36 15,712.29 15,906.51 15,782.64 1.00 2 −14,170.26 14,366.09 14,759.51 14,508.59 0.92 3 −13,968.68 14,042.93 14,635.56 14,257.59 0.86 4 −13,825.06 13,835.68 14,627.51 14,122.50 0.83 5 −13,718.09 13,701.75 14,692.79 14,060.72 0.83 6 −13,619.73 13,585.02 14,775.26 14,016.14 0.81 Females (n = 997) 1 −13,383.32 13,826.91 14,018.19 13,894.33 1.00 2 −12,776.92 12,694.10 13,081.58 12,830.67 0.91 3 −12,586.32 12,392.91 12,976.58 12,598.63 0.85 4 −12,436.66 12,173.58 12,953.44 12,448.44 0.84 5 −12,337.51 12,055.29 13,031.33 12,399.30 0.82 6 −12,257.19 11,974.65 13,146.89 12,387.81 0.82
AIC Akaike Information Criterion, BIC the Bayesian Information Criterion; Adjusted BIC, sample size-adjusted BIC. ACP average classification probability Bolded letters indicate selected models
Discussion
This study has several key findings. First, four trajector-ies of ESPE from childhood to emerging adulthood (age of 9 to 21 years) for males and females were identified. For males, these trajectories were Rarely-to-Never, Often-to-Rarely, Always-to-Never, and Always. For fe-males, these trajectories were Rarely-to-Never, Rarely, Always-to-Rarely, and Always. The finding was similar to the results of other studies that focused on the
unorganized physical exercise [58] and organized sport participants [59] in that they also found a group of males and females who kept active or who regularly exercised during the follow-up time. In this study, more than a quarter of males frequently exercised over 13 years (“Al-ways” in males), whereas only a tenth of females main-tained exercise habits from adolescence to young adulthood (“Always” in females). Despite these observed sex differences, the result indicated that extracurricular
Table 3 Item-response probabilities for a four-class model of extracurricular sport participation and exercise (ESPE) from ages 9 through 21 by sex
Latent class and membership probability
Male: Class 1 Male: Class 2 Male: Class 3 Male: Class 4
Often-to-Rarely Rarely-to-Never Always-to-Never Always
32% 20% 21% 27%
Age Never Rarely Often Always Never Rarely Often Always Never Rarely Often Always Never Rarely Often Always
9 0.06 0.32 0.35 0.28 0.14 0.51 0.22 0.14 0.09 0.19 0.27 0.44 0.04 0.11 0.24 0.61 10 0.03 0.27 0.35 0.36 0.12 0.45 0.27 0.16 0.00 0.14 0.31 0.55 0.01 0.04 0.16 0.78 11 0.00 0.21 0.46 0.34 0.16 0.45 0.28 0.11 0.03 0.07 0.29 0.61 0.01 0.03 0.08 0.87 12 0.02 0.27 0.41 0.30 0.27 0.57 0.12 0.04 0.02 0.17 0.33 0.48 0.02 0.04 0.19 0.74 13 0.04 0.28 0.44 0.25 0.21 0.59 0.15 0.05 0.04 0.20 0.28 0.48 0.01 0.04 0.24 0.71 14 0.02 0.34 0.34 0.30 0.29 0.47 0.16 0.08 0.09 0.24 0.26 0.41 0.00 0.08 0.17 0.75 15 0.08 0.41 0.35 0.15 0.44 0.41 0.07 0.08 0.22 0.38 0.19 0.20 0.08 0.14 0.23 0.55 16 0.02 0.43 0.41 0.15 0.37 0.48 0.08 0.06 0.34 0.37 0.17 0.12 0.03 0.09 0.25 0.63 17 0.07 0.48 0.29 0.16 0.45 0.38 0.06 0.12 0.36 0.40 0.14 0.10 0.05 0.15 0.29 0.51 18 0.04 0.44 0.35 0.17 0.32 0.50 0.14 0.04 0.44 0.36 0.10 0.09 0.06 0.20 0.40 0.34 19 0.07 0.39 0.41 0.13 0.38 0.43 0.13 0.07 0.47 0.33 0.04 0.16 0.08 0.26 0.35 0.31 20 0.04 0.43 0.41 0.11 0.44 0.36 0.12 0.08 0.61 0.29 0.06 0.03 0.13 0.30 0.36 0.21 21 0.11 0.45 0.35 0.09 0.48 0.38 0.11 0.02 0.64 0.25 0.08 0.03 0.17 0.29 0.40 0.13
Latent class and membership probability
Female: Class 1 Female: Class 2 Female: Class 3 Female: Class 4
Always-to-Rarely Rarely-to-Never Always Rarely
33% 34% 10% 23%
Age Never Rarely Often Always Never Rarely Often Always Never Rarely Often Always Never Rarely Often Always
9 0.02 0.17 0.35 0.46 0.10 0.41 0.27 0.22 0.04 0.23 0.28 0.46 0.10 0.51 0.25 0.13 10 0.01 0.06 0.41 0.52 0.12 0.36 0.32 0.21 0.04 0.26 0.18 0.52 0.06 0.55 0.33 0.07 11 0.00 0.07 0.42 0.51 0.11 0.42 0.32 0.15 0.04 0.22 0.27 0.47 0.09 0.56 0.31 0.05 12 0.00 0.15 0.47 0.38 0.26 0.46 0.21 0.07 0.04 0.18 0.27 0.51 0.16 0.60 0.21 0.03 13 0.03 0.33 0.35 0.29 0.37 0.45 0.12 0.05 0.00 0.18 0.25 0.56 0.06 0.72 0.19 0.03 14 0.06 0.46 0.27 0.21 0.46 0.39 0.06 0.08 0.00 0.24 0.18 0.58 0.12 0.60 0.17 0.11 15 0.29 0.38 0.24 0.09 0.69 0.22 0.03 0.06 0.04 0.11 0.31 0.53 0.21 0.54 0.15 0.10 16 0.18 0.53 0.22 0.07 0.65 0.25 0.03 0.07 0.00 0.05 0.30 0.65 0.15 0.62 0.12 0.12 17 0.25 0.49 0.18 0.08 0.70 0.22 0.03 0.04 0.00 0.18 0.30 0.52 0.18 0.60 0.10 0.12 18 0.28 0.46 0.22 0.04 0.70 0.22 0.06 0.02 0.10 0.15 0.32 0.43 0.20 0.56 0.17 0.08 19 0.32 0.48 0.13 0.08 0.73 0.22 0.05 0.01 0.16 0.29 0.37 0.18 0.21 0.59 0.13 0.07 20 0.40 0.48 0.10 0.02 0.74 0.19 0.06 0.01 0.04 0.39 0.35 0.21 0.27 0.56 0.12 0.04 21 0.36 0.39 0.22 0.03 0.68 0.24 0.08 0.01 0.12 0.28 0.40 0.20 0.34 0.48 0.15 0.03
exercise habits can be developed and sustained in this age group.
Second, the result indicated that the initial age of decline in regular ESPE was earlier for females (age 11) than for males (age 14) when comparing trajectories of ESPE with similar patterns across sexes (“Always-to-Never” for males and “Always-to-Rarely” for females). Despite previous studies [23–25,60] consistently showing different patterns of physical activity for males and females, most of them did not examine sex differences in the timing of the de-cline. Among those that did examine such differences [17,
61], Nelson et al. [61] showed an earlier decrease in phys-ical activity for girls than for boys (declining from early to mid-adolescence versus declining from mid- to late ado-lescence). However, no specific age of decline was speci-fied. Our study extends previous findings by revealing that females might decrease ESPE at the age of 11 to 13. Therefore, it is essential to develop effective health pro-motion strategies to encourage ESPE and help young people develop regular exercise habits, especially for females.
Third, some similarities in factors related to ESPE for both sexes were identified. We found that body dissatis-faction was significantly associated with low frequencies of ESPE (i.e., Rarely-to-Never in males and females). In a Chinese society that emphasizes the face-conscious (“mianzi” in Chinese) nature of social life [62], adolescents in our sample who had high body dissatisfaction may be unwilling to exercise because they feel embarrassed when doing so [36]. Screen behavior was the other factor that was associated with low ESPE in both sexes. Extending previous findings on the negative association between screen behavior and physical activity (e.g., Sisson et al., [63]), we demonstrated that screen behavior in childhood could have lasting effects on the initiation and mainten-ance of ESPE. Therefore, it is vital for both sexes to reduce screen behavior in the early stages of life to increase the likelihood of exercise in the future.
Fourth, we observed sex differences in factors related to ESPE. For individual factors, stress was only associated with trajectories of ESPE for males, and BMI was only associated with trajectories of ESPE for females. Specifically, males with a higher level of stress had a higher chance of
Table 4 Results of the multinomial logit model examining factors related to ESPE trajectories
Males (n = 874) 1. Often-rarely / 2. Rarely-Never 3. Always-Never / 2. Rarely-Never 4. Always / 2. Rarely-Never
Factors OR (95% C. I.) OR (95% C. I.) OR (95% C. I.)
Individual factors
Body Mass Index 1.047 (0.993– 1.105) 0.967 (0.909– 1.028) 1.030 (0.972– 1.091)
Body dissatisfaction 0.913 (0.842– 0.989 )* 0.894 (0.820– 0.974)* 0.844 (0.777– 0.918)*
Stress 0.994 (0.955– 1.034) 0.952 (0.910– 0.997)* 0.955 (0.914– 0.997)*
Screen behavior 0.800 (0.682– 0.937)* 1.184 (1.001– 1.402)* 0.909 (0.772– 1.070)
Parental Factors Parental exercise
Regular / unregularly or no exercise 1.459 (0.965– 2.208) 1.600 (1.011– 2.532)* 1.583 (1.025– 2.444)*
Parental screen behavior 1.020 (0.870– 1.195) 1.123 (0.942– 1.338 ) 1.094 (0.925– 1.295)
Females (n = 827) 1. Always-Rarely / 2. Rarely-Never 3. Always/ 2. Rarely-Never 4. Rarely / 2. Rarely-Never
Factors OR (95% C. I.) OR (95% C. I.) OR (95% C. I.)
Individual factors
Body Mass Index 1.080 (1.012– 1.152)* 1.214 (1.110– 1.327)* 1.074 (1.001– 1.152)*
Body dissatisfaction 0.945 (0.875– 1.020) 0.846 (0.755– 0.949)* 0.913 (0.841– 0.991)*
Stress 0.984 (0.947– 1.023) 0.999 (0.942– 1.059) 1.008 (0.967– 1.050)
Screen behavior 0.717 (0.598– 0.860)* 0.838 (0.645– 1.089) 0.729 (0.598– 0.887)*
Parental Factors Parental exercise
Regular / unregularly or no exercise 1.272 (0.888– 1.822) 1.150 (0.668– 1.980) 1.184 (0.804– 1.745)
Parental screen behavior 1.033 (0.897– 1.191) 1.190 (0.970– 1.459) 0.998 (0.856– 1.163)
The multinomial logistic model used“Rarely-Never” class as a reference group. Parental highest education, family monthly income, and parental marital status were controlled in the model
ESPE extracurricular sport participation and exercise *p < .05, OR Odds Ratio, C.I. Confidence Interval
developing chronically low frequencies of ESPE (“Rarely-to-Never” compared with “Always-to-(“Rarely-to-Never” and “Always”). Despite the surprising and counterintuitive nature of the observed direction of the association between stress and ESPE, it is likely that males who belonged to the “Rarely-to-Never” class were those who initially had a higher level of stress. Given that our study cannot infer causality, future research should further investigate causal relationships be-tween stress and exercise among males. In addition, the null association between stress and ESPE among girls may be that, unlike males who are more likely to use exercise as a coping strategy for stress, females tend to seek social sup-port or use tension-reduction strategies [41].
We also found that BMI was only associated with trajec-tories of ESPE for females. The observed sex differences may be due to the fact that females are more concerned about their weight and are more likely to use exercise to control it than are males [64, 65]. Prior studies have also found that the association between BMI and exercise was more apparent among females than males [35,39]. The na-ture of the observed association between BMI and ESPE trajectories for females, however, was inconsistent with pre-vious research. Specifically, although other studies have in-dicated that females with higher BMI were less likely to exercise [35, 39], we found that females with higher BMI were more likely to initiate and maintain ESPE. Factors that may have contributed to these discrepancies include differ-ences in the study design, sample characteristics, analytical strategy, and exercise measurement. Because there are cur-rently no other studies exploring the association between BMI and ESPE trajectories, further research is needed to clarify these relationships.
For parental factors, parental exercise was only associ-ated with ESPE trajectories for males, such that males with parents who regularly exercise were more likely to engage in high-frequency ESPE (i.e., “Always-to-Never” and “Al-ways” compared with “Rarely-to-Never”). Our findings are consistent with other studies which revealed that the ef-fects of parental exercise behavior were only significant among boys (Moor et al., [44]; Cleland et al., [43]). One possible mechanism to explain how parents’ exercise be-havior influences ESPE for males is“role modeling” as in-dicated by social-learning theory [33, 66]. Specifically, when offspring observed that their parents exercise fre-quently, which entails positive values of sport and exercise, they may embrace these values and exert similar behav-iors. The observed exercise behavior from parents may also serve as a prompt for children’s participation in ESPE. Additionally, as research has found that parents who are physically active are more likely to support their children in physical activity [29], it is possible that parental exercise behavior influences males’ ESPE indirectly via parental support in ESPE. Lastly, genetic predisposition to physical activity may help explain the observed association.
Research [44,67] has shown that there is a certain amount of heritability for sports participation. Therefore, offspring who have more ESPE may do so partly because of the gen-etic factors inherited from their active parents.
Despite the fact that we did not find a significant associ-ation between parental exercise behavior and ESPE among females, our results do not mean that parents do not have any influence on females’ ESPE. Research has suggested that having a parent to participate in ESPE with, rather than observing their behavior, may be more important for pro-moting ESPE among females [43]. It is also likely that fe-male participation in ESPE is affected more by parental attitudes to exercise behavior than by parental behavior [68]. As we did not measure other ESPE-related parental influences, more research is needed to further understand whether and how parental factors influence their offspring’s ESPE differently for males and females.
Our study has some notable strengths. First, the use of longitudinal data allowed us to delineate the sex-specific development of ESPE across multiple stages of life. Sec-ond, by applying a sophisticated data analysis, we could capture distinct developmental patterns and factors asso-ciated with ESPE. Specifically, we identified important sex differences in both the timing of the decline and the fac-tors associated with the trajectories of ESPE for males and females. Therefore, our findings not only provide import-ant information regarding the identification of potential high-risk groups, but also help develop sex-specific strat-egies for intervention. For example, the design of a phys-ical activity enhancing program tailored to females in the “Rarely-to-Never” group by focusing on reducing the ef-fect of body dissatisfaction and increasing self-monitored behavior might significantly increase women’s physical ac-tivity participation [69].
Several limitations of the study also need to be addressed. For instance, exercise was measured using a single retro-spective self-reported question that may be subject to recall bias. Second, because our sample was drawn from northern Taiwan, the generalizability of our findings may be limited. Thus, caution should be exercised when applying the current results to other populations. Third, the CABLE pro-ject did not measure the duration of ESPE; therefore, the trajectories can only represent the frequencies of exercise. However, the diversities of duration of ESPE, e.g. 15 min or an hour, may contribute differently to the recommendation of physical activity. Thus, future study should estimate the duration and frequency of ESPE simultaneously to increase the precision. Fourth, the level of ESPE might be overesti-mated if some respondents reported the frequency of phys-ical activity. Last, ESPE and parental exercise were measured by one question that did not capture the exercise quantity. Future studies that measure ESPE and parental exercise using other validated assessments are needed to confirm our results.
Conclusions
This study identified four trajectories of ESPE for males and females, respectively. The results enhance the existing knowledge by revealing the initial ages of decline in ESPE and demonstrating the sex-specific individual and parental factors which contribute to the distinct trajectories of ESPE. Our results could also benefit the future development of the ESPE promotion programs because we revealed factors that help maintain a high level of ESPE. Additionally, be-cause factors associated with ESPE are different for males and females, interventions should be tailored accordingly to increase their effectiveness.
Appendix 1
The calculation of inter-method reliability of partici-pants’ extracurricular sport participation and exercise.
To understand the reliability of our self-reported measure of ESPE, we conducted a correlation analysis
between the one-item ESPE measure with another three-item measure of physical activity (PA) assessed in the 12th wave. The three-item measure was adopted from the questions used in the chronic disease risk factor sur-veillance (STEPS) [70] as below:
Q1.On average, how many times you do exercise in 1week? (The exercise has to be continued for more than 10 min) _____ time(s)
Q2.On average, how many minutes do you spend on the exercise every time? _____ minute(s)
Q3.When you do exercise, will you feel shortness of breath? (1) nothing changed (2) small increases in breathing or heart rate (3) panting (4) out of breath
We used these three questions to define if a person meets the WHO’s PA recommendation that “Adults aged 18–64 years should do at least 150 minutes of
Appendix 2
moderate-intensity aerobic physical activity throughout the week” because our participants were 20 years old in the 12th wave of the survey. We defined Q3 > =2 as moderate-intensity PA. Q1*Q2 was used to calculate the time of PA. IF Q3 > =2 and time of PA > =150 then the participants were defined as a person who met the WHO’s recommendation.
The results of the correlation analysis are presented in the table below. We observed a significant gradient asso-ciation between the two measurements (Cochran-Armi-tage Trend Test: T = 21.1503, p < 0.001). Specifically, we found that more than 60% of the participants who re-ported “often” and “always” to the one item question of this study met the WHO’s recommendation. In addition, about one fifth of the participants who reported“rarely” met the WHO’s recommendation. However, only 1.1% of the participants who reported“never” met the WHO’s recommendation.
Met WHO_PA recommendation (%)
wave_12 ESPE
1.Never 2.Rarely 3.Often 4.Always
Yes 1.13 21.62 64.34 69.83
No 98.87 78.38 35.66 30.17
Supplementary Information
The online version contains supplementary material available athttps://doi. org/10.1186/s12889-020-09745-8.
Additional file 1. Results of multinomial logit model examining preadolescent factors related to exercise trajectories using complete data created by multiple imputation analysis.
Abbreviations
ESPE:Extracurricular sport participation and exercise; BMI: Body mass index Acknowledgements
The authors thank the entire study team from the CABLE project. Authors’ contributions
WCH, LYC and HYC designed the research, had full access to all the data in the study, and take primary responsibility for the integrity of the data and accuracy of the analysis. WCW performed the statistical analysis and wrote the first draft of the manuscript. LYC supervised the study and revised the draft. HYC supervised the conceptualization and statistical analysis, and gave valuable comments. DLL provided valuable comments about exercise. CCW coordinated and supervised the field work. FS critically revised and reviewed the manuscript, and gave valuable comments during the study period. LLY acted as the guarantor of the paper and vouched for its validity. The author(s) read and approved the final manuscript.
Funding
This work was supported by the Ministry of Science and Technology (MOST 106–2410-H-002-228, 107–2410-H-002-084-MY2, 109-2410-H-002-064-SS2). The funding source played no role in the study design, data collection, analysis, in-terpretation of data, in the writing of the articles, or in the decision to submit ar-ticles for publication.
Availability of data and materials
The data used in the present study can be made available on request to the correspondence authors.
Ethics approval and consent to participate
The project was approved by the Human Research Medical Ethics Committee of the National Health Research Institutes (approval code EC9009003). All parents or guardians in the study signed the informed consent form at baseline to allow their children to participate.
Consent for publication Not applicable. Competing interests
The authors declare no competing interests. Author details
1
Department of Health Promotion and Health Education, National Taiwan Normal University, Taipei, Taiwan.2Institute of Health Behaviors and
Community Sciences, School of Public Health, National Taiwan University, No.17, Xuzhou Rd., Zhongzheng Dist, Taipei City 100, Taiwan.3Department of
Public Health, Chung Shang Medical University, Taichung, Taiwan.4Institute of Population Health Sciences, National Health Research Institutes, No.35, Keyan Road, Zhunan, Miaoli County 350, Taiwan.5School of Public Health,
University of Sydney, Sydney, Australia.6Institute of Health Policy and
Management, School of Public Health, National Taiwan University, Taipei, Taiwan.
Received: 20 March 2020 Accepted: 21 October 2020
References
1. World Health Organization. Global Health risks: mortality and burden of disease attributable to selected major risks. Bull World Health Organ. 2009; 87(18):646.
2. Fedewa AL, Ahn S. The effects of physical activity and physical fitness on Children's achievement and cognitive outcomes: a meta-analysis. Res Q Exerc Sport. 2011;82(3):521–35.
3. Loprinzi PD, Cardinal BJ, Loprinzi KL, Lee H. Benefits and environmental determinants of physical activity in children and adolescents. Obes Facts. 2012;5(4):597–610.
4. World Health Organization. Global recommendations on physical activity for health. Geneva: Word Health Organization; 2010.
5. Kalman M, Inchley J, Sigmundova D, Iannotti RJ, Tynjälä JA, Hamrik Z, Haug E, Bucksch J. Secular trends in moderate-to-vigorous physical activity in 32 countries from 2002 to 2010: A cross-national perspective. Eur J Pub Health. 2015;25:37–40.
6. World Health Organization. Global action plan on physical activity 2018– 2030: more active people for a healthier world, vol. 104; 2018. 7. Huppertz C, Huppertz I. How voluntary exercise behavior runs in families:
twin studies and beyond. Simmerath: Vrije Universiteit; 2016.
8. Khan KM, Thompson AM, Blair SN, Sallis JF, Powell KE, Bull FC, Bauman AE. Sport and exercise as contributors to the health of nations. Lancet. 2012; 380(9836):59–64.
9. World Health Organization. WHO | Physical Activity. WHO; 2017.https:// www.who.int/health-topics/physical-activity#tab=tab_1.
10. Caspersen CJ, Powell KE, Christenson GM, Public S, Reports H, Apr NM, Reports PH. Physical Activity , Exercise , and Physical Fitness : Definitions and Distinctions for Health- Related Research. Assoc Sch Public Health. 1985;100(2):126–31.
11. Kilpatrick M, Hebert E, Bartholomew J. College students' motivation for physical activity: differentiating men's and women's motives for sport participation and exercise. J Am Coll Heal. 2005;54(2):87–94.
12. Bosch L, Wells JCK, Lum S, Reid AM. Associations of extracurricular physical activity patterns and body composition components in a multi-ethnic population of UK children (the size and lung function in children study): a multilevel modelling analysis. BMC Public Health. 2019;19(1):573. 13. Macniven R, Bauman A, Abouzeid M. A review of population-based
prevalence studies of physical activity in adults in the Asia-Pacific region. BMC Public Health. 2012;12:41.
14. Li-Jung C, Haase AM, Fox KR. Physical activity among adolescents in Taiwan. Asia Pac J Clin Nutr. 2007;16(2):354–61.
15. Dumith SC, Gigante DP, Domingues MR, Kohl HW. Physical activity change during adolescence: a systematic review and a pooled analysis. Int J Epidemiol. 2011;40(3):685–98.
16. Duncan SC, Seeley JR, Gau JM, Strycker LA, Farmer RF. A latent growth model of adolescent physical activity as a function of depressive symptoms. Ment Health Phys Act. 2012;5(1):57–65.
17. Farooq MA, Parkinson KN, Adamson AJ, Pearce MS, Reilly JKJJ, Hughes AR, Janssen X, Basterfield L, Reilly JKJJ. Timing of the decline in physical activity in childhood and adolescence: Gateshead Millennium Cohort Study. Br J Sports Med. 2017;52(15):bjsports-2016–096933.
18. Lau EY, Dowda M, McIver KL, Pate RR. Changes in physical activity in the school, afterschool, and evening periods during the transition from elementary to middle school. J Sch Health. 2017;87(7):531–7. 19. Lounassalo I, Salin K, Kankaanpaa A, Hirvensalo M, Palomaki S, Tolvanen A,
Yang X, Tammelin TH. Distinct trajectories of physical activity and related factors during the life course in the general population: a systematic review. BMC Public Health. 2019;19(1):271.
20. Audrain-McGovern J, Rodriguez D, Rodgers K, Cuevas J, Sass J. Longitudinal variation in adolescent physical activity patterns and the emergence of tobacco use. J Pediatr Psychol. 2012;37(6):622–33.
21. Kwon S, Janz KF, Letuchy EM, Burns TL, Levy SM. Developmental trajectories of physical activity, sports, and television viewing during childhood to young adulthood: Iowa bone development study. JAMA Pediatr. 2015;169(7):666–72. 22. Brown WJ, Mielke GI, Kolbe-Alexander TL. Gender equality in sport for
improved public health. Lancet. 2016;388(10051):1257–8.
23. Findlay LC, Garner RE, Kohen DE. Children’ s organized physical activity patterns from childhood into adolescence. Methods. 2009;6(6):708–15. 24. Gallant F, Thibault V, Hebert J, Gunnell KE, Belanger M. One size does not fit all:
identifying clusters of physical activity, screen time, and sleep behaviour co-development from childhood to adolescence. Int J Behav Nutr Phys Act. 2020;17(1): 58.
25. Brodersen NH, Steptoe A, Boniface DR, Wardle J. Trends in physical activity and sedentary behaviour in adolescence: ethnic and socioeconomic differences. Br J Sports Med. 2007;41(3):140–4.
26. Horn TS, Horn JL. Family influences on children's sport and physical activity participation, behavior, and psychosocial responses. In: Handbook of sport psychology. 3rd ed. Hoboken: Wiley; 2007. p. 685–711.
27. Winters ER, Petosa RL, Charlton TE. Using social cognitive theory to explain discretionary,“leisure-time” physical exercise among high school students. J Adolesc Health. 2003;32(6):436–42.
28. Dewar DL, Plotnikoff RC, Morgan PJ, Okely AD, Costigan SA, Lubans DR. Testing social-cognitive theory to explain physical activity change in adolescent girls from low-income communities. Res Q Exerc Sport. 2013;84(4):483–91.
29. Welk GJ, Wood K, Morss G. Parental influences on physical activity in children: an exploration of potential mechanisms. Pediatr Exerc Sci. 2003;15(1):19–33. 30. Bandura A. The evolution of social cognitive theory. In: Smith KG, Hitt MA,
editors. Great minds in management. New York; 2005. p. 9–35. 31. Bronfenbrenner U, Morris PA. The bioecological model of human
development. In: Damon W, Learner RM, editors. Handbook of Child Psychology Volume One: Theoretical Models of Human Development. 6th ed. Hoboken: Wiley; 2006. p. 793–828.
32. Yao CA, Rhodes RE. Parental correlates in child and adolescent physical activity: a meta-analysis. Int J Behav Nutr Phys Act. 2015;12:10. 33. Rodrigues D, Padez C, Machado-Rodrigues AM. Active parents, active
children: the importance of parental organized physical activity in children's extracurricular sport participation. J Child Health Care. 2018;22(1):159–70. 34. Dunton GF, Liao Y, Almanza E, Jerrett M, Spruijt-Metz D, Chou C-P, Pentz
MA. Joint physical activity and sedentary behavior in parent-child pairs. Med Sci Sports Exerc. 2012;44(8):1473.
35. Chung AE, Skinner AC, Steiner MJ, Perrin EM. Physical activity and BMI in a nationally representative sample of children and adolescents. Clin Pediatr. 2012;51(2):122–9.
36. Slater A, Tiggemann M. Gender differences in adolescent sport participation, teasing, self-objectification and body image concerns. J Adolesc. 2011;34(3): 455–63.
37. Moljord IEO, Eriksen L, Moksnes UK, Espnes GA. Stress and happiness among adolescents with varying frequency of physical activity. Percept Mot Skills. 2011;113(2):631–46.
38. Kim Y, Barreira TV, Kang M. Concurrent associations of physical activity and screen-based sedentary behavior on obesity among US adolescents: a latent class analysis. J Epidemiol. 2016;26(3):137–44.
39. Dowda M, Arnold NJ, Ainsworth BE, Addy CL, Saunders R, Riner W. Correlates of physical activity among U.S. young adults, 18 to 30 years of age, from NHANES III. Ann Behav Med. 2003;26(1):15–23.
40. Pila E, Barlow MA, Wrosch C, Sabiston CM. Comparing the body to superior others: associations with daily exercise and body evaluation in men and women. Psychol Sport Exerc. 2016;27:120–7.
41. Frydenberg E, Lewis R. Boys play sport and girls turn to others: age, gender and ethicity as determinants of coping. J Adolesc. 1993;16:253–66. 42. Serrano-Sanchez JA, Martí-Trujillo S, Lera-Navarro A, Dorado-García C,
González-Henríquez JJ, Sanchís-Moysi J. Associations between screen time and physical activity among Spanish adolescents. PLoS One. 2011;6(9): e24453.
43. Cleland V, Timperio A, Salmon J, Hume C, Telford A, Crawford D. A longitudinal study of the family physical activity environment and physical activity among youth. Am J Health Promot. 2011;25(3):159–67.
44. De Moor MH, Willemsen G, Rebollo-Mesa I, Stubbe JH, De Geus EJ, Boomsma DI. Exercise participation in adolescents and their parents: evidence for genetic and generation specific environmental effects. Behav Genet. 2011;41(2):211–22.
45. Jago R, Thompson JL, Sebire SJ, Wood L, Pool L, Zahra J, Lawlor DA. Cross-sectional associations between the screen-time of parents and young children: differences by parent and child gender and day of the week. Int J Behav Nutr Phys Act. 2014;11(1):54.
46. Yen LL, Chen L, Lee S-H, Hsiao C, Pan LY. Child and adolescent behaviour in long-term evolution (CABLE): a school-based health lifestyle study. Promot Educ. 2002;Supplement 1:33–40.
47. Pérez A, Gabriel KP, Nehme EK, Mandell DJ, Hoelscher DM. Measuring the bias, precision, accuracy, and validity of self-reported height and weight in assessing overweight and obesity status among adolescents using a surveillance system. Int J Behav Nutr Phys Act. 2015;12(S1):S2.
48. Bucchianeri M, Arikian A, Hannan P, Eisenberg M. Body dissatisfaction from adolescence to young adulthood: findings from a 10-year longitudinal study. Body Image. 2013;10(1):1–15.
49. Compas BE. Stress and life events during childhood and adolescence. Clin Psychol Rev. 1987;7(3):275–302.
50. Eisinga R, Grotenhuis M, Pelzer B. The reliability of a two-item scale: Pearson, Cronbach, or spearman-Brown? Int J Public Health. 2013;58(4):637–42. 51. Domar AD, Conboy L, Denardo-Roney J, Rooney KL. Lifestyle behaviors in
women undergoing in vitro fertilization: a prospective study. Fertil Steril. 2012;97(3):697–701 e691.
52. Joiner TE, Tickle JJ. Exercise and depressive and anxious symptoms: what is the nature of their interrelations? J Occup Rehabil. 1998;8(3):191–8. 53. Briggs SR, Cheek JM. The role of factor analysis in the development and
evaluation of personality scales. J Pers. 1986;54(1):106–48.
54. Collins LM, Lanza ST. Repeated measures latent class analysis and latent transition analysis. In: Latent Class and Latent Transition Analysis: With Applications in the Social, Behavioral, and Health Sciences. Hoboken: Wiley; 2010. p. 181–224. 55. Nylund KL, Asparouhov T, Muthén BO. Deciding on the number of classes
in latent class analysis and growth mixture modeling: a Monte Carlo simulation study. Struct Equ Model. 2007;14(5):535–69.
56. Collins LM, Lanza ST. Multiple groups latent transition analysis and latent transition analysis with covariates. In: Latent Class and Latent Transition Analysis: With Applications in the Social, Behavioral, and Health Sciences. Hoboken: Wiley; 2010. p. 225–65.
57. Sidi Y, Harel O. The treatment of incomplete data: reporting, analysis, reproducibility, and replicability. Soc Sci Med. 2018;209:169–73. 58. Findlay LC, Garner RE, Kohen DE. Patterns of children's participation in
unorganized physical activity. Res Q Exerc Sport. 2010;81(2):133–42. 59. Howie EK, McVeigh JA, Smith AJ, Straker LM. Organized sport trajectories
from childhood to adolescence and health associations. Med Sci Sports Exerc. 2016;48(7):1331–9.
60. Telama R, Yang X, Viikari J, Välimäki I, Wanne O, Raitakari O. Physical activity from childhood to adulthood: a 21-year tracking study. Am J Prev Med. 2005;28(3):267–73.
61. Nelson MC, Neumark-Stzainer D, Hannan PJ, Sirard JR, Story M. Longitudinal and secular trends in physical activity and sedentary behavior during adolescence. Pediatrics. 2006;118(6):e1627–34.
62. Qi X. Face:Achinese concept in a global sociology. J Sociol. 2011;47(3):279–95. 63. Sisson SB, Broyles ST, Baker BL, Katzmarzyk PT. Screen time, physical activity,
and overweight in U.S. youth: national survey of children's health 2003. J Adolesc Health. 2010;47(3):309–11.
64. Barry AE, Whiteman S, Piazza-gardner AK, Jensen AC. Gender differences in the associations among body mass index , weight loss , exercise , and drinking among college students. J Am Coll Heal. 2013;61:407–14.
65. Cluskey M, Grobe D. College weight gain and behavior transitions: male and female differences. J Am Diet Assoc. 2009;109(2):325–9.
66. Dilorenzo TM, Stucky-Ropp RC, Vander Wal JS, Gotham HJ. Determinants of exercise among children. II. A longitudinal analysis. Prev Med. 1998;27(3):470–7. 67. Beunen G, Thomis M. Genetic determinants of sports participation and daily
physical activity. Int J Obes. 1999;23(3):S55–63.
68. Gustafson SL, Rhodes RE. Parental correlates of physical activity in children and early adolescents. Sports Med. 2006;36(1):79–97.
69. Segar M, Jayaratne T, Hanlon J, Richardson CR. Fitting fitness into women’s lives: effects of a gender-tailored physical activity intervention. Womens Health Issues. 2002;12(6):338–47.
70. World Health Organization. WHO STEPS surveillance manual: the WHO STEPwise approach to chronic disease risk factor surveillance. Geneva: World Health Organization; 2005.https://apps.who.int/iris/handle/10665/43376.
Publisher’s Note
Springer Nature remains neutral with regard to jurisdictional claims in published maps and institutional affiliations.