1
New simulator that can regenerate real human blood pressure waveforms
Chen-Chuan Hung, Ming-Chi Su, Sheng-Jui Chen, Hsin-Tse Lee
Center for Measurement Standards/ITRI, Hsinchu, Taiwan 300, R.O.C.
E-mail:c-chung@itri.org.tw
Abstract
Center for Measurement Standards/ITRI (CMS/ITRI) has established a new simulator that can regenerate real human blood pressure waveforms previously recorded in the clinic. The new simulator can also improve the quality of the automatic non-invasive blood pressure(NIBP) monitor and reduce the number of subjects in clinical trial. The repeatability (one standard deviation from 20 determinations) of systolic blood pressure generated by the simulator and presented to a automatic NIBP monitors covering the range from 83 mmHg to 161 mmHg is below 2 mmHg. And the repeatability of diastolic blood pressure covering the range from 48 mmHg to 95 mmHg is below 3 mmHg. In order to prove the simulator can generate realistic waveforms, we calculate the differences between two systolic blood pressures and two diastolic blood pressures where directly recorded from two subjects and regenerated from simulator by using a NIBP monitor. The absolute difference is not more than 4 mmHg. Finaly, the 255 oscillometric waveforms and simultaneous auscultatory blood pressures were recorded from 115 subjects at cuff deflation rates of 2 to 3mmHg/s in order to carry out clinical evaluation of the simulator compliance with the overall system accuracy defined in EN 1060.
Key words: simulator, automatic non-invasive blood
pressure monitor, clinical evaluation
1. Introduction
Automatic non-invasive blood pressure (NIBP) monitor based on the oscillometric method was widely used in healthcare since 1980[1,2,3]. In the technique, the pressure oscillations arising from arterial pulse wave are introduced to the inflated bladder of a cuff. Then the monitor will estimate the value of systolic pressure and diastolic pressure by using the special algorithm software. In order to validate automatic NIBP monitor, we are commonly used blood pressure
simulators (such as CuffLink, BP Pump, SmartArm and so on)[4,5]. These commercially available simulators are useful tools to test automatic NIBP monitors for maintenance purposes and are highly repeatable. However Dr. Mieke’s result[6] showed that the systolic pressure and diastolic pressure values of commercial simulators may not represent true blood pressure values. And Mr. SIMS et al [7] studied the different pressure pulse envelopes arose from different commercial simulators on a single automatic NIBP monitor. As a result, they found it has significant differences in the measurement of blood pressure between simulators.
For this reason, people hope to improve the simulator in order to generate more realistic waveforms [8]. CMS/ITRI had established a new simulator (design by PTB Germany) which not only can regenerate real human blood pressure waveforms but also reflect the special human characteristics and its variability. This paper describes the characterization of CMS/ITRI simulator, the waveform consistency and waveform authenticity and clinical evaluation.
2. The CMS/ITRI simulator
The pressure pulse generator is the most important
hardware of the simulator. The main mechanism is in a metal housing including pressure transducer, motor, pressure chamber and level, which is thermally shielded. The lever has an automatic power shut down, when the maximum amplitude is detected. It has to generate the oscillometric pulses recorded earlier in the clinic. The cuff of the automatic NIBP monitor under test was wrapped around the mandrel and connected via its hose and a T-piece adaptor to the NIBP monitor and Pulse Generator (Fig.1). It has to withstand quasi constant pressures up to 300 mmHg and shall be able to generate pulses of 0.5 - 10 mmHg for frequencies up to 10 Hz. By a special software the simulator has to adopt the actual measuring situation of the automatic NIBP monitor, i.e. the actual cuff
pressure. This requires a pressure transducer connected with the pneumatic system of the automatic NIBP monitor. On basis of this information the PC has to select from a table one recorded oscillation fitting best to the actual cuff pressure. To generate this table the original data have to be segmented, meaning that for each oscillation a cuff pressure range has to be defined for which it is representative. The preparation of the data for the simulation is done by the program DvBp.EXE
Figure 1. The Schematic diagram of the automatic NIBP monitor test by simulator
3. Test method of the CMS/ITRI simulator
In order to test CMS/ITRI simulator, an indirect approach was required, because there is no any classical standard can be used to validate NIBP simulator. A method was developed to establish three characteristics of the simulator: the repeatability of the generated oscillometric waveforms, the authenticity of the generated waveforms and clinical evaluation.
3.1. Repeatability of the generated oscillometric waveforms
We chose 3 oscillometric waveforms covering low, medium and high blood pressures early collected in clinical. Each waveform was repeatably generated by the CMS/ITRI simulator in 20 times, and presented to Omron HEM-907 automatic NIBP monitor. The systolic blood pressure of 3 oscillometric waveforms covering the range from 83 mmHg to 161 mmHg and the diastolic blood pressure covering the range from 48 mmHg to 95 mmHg. Figure 2 shows the cuff pressure and the oscillometric waveform of 115/63 mmHg blood pressure which had used for simulation.
Figure 2. The cuff pressure and the oscillometric waveform of 115/63 mmHg blood pressure
Consistency criteria, base on the other work with commercially available CuffLink simulator, was used which considered the standard deviation of the 20 repeated measurements.
3.2. The authenticity of the generated waveforms
Test was carried out to examine if the CMS/ITRI simulator could generate realistic waveforms that can be used to substitute for human subjects. The test method we use was the reproduction of waveforms with automatic NIBP monitor.
We used CMS/ITRI simulator to record the two oscillometric waveforms from two subjects while a automatic NIBP monitor was recording the blood pressure from the subjects. This was carried out on the Microlife BP 3BTO-A automatic NIBP monitor with about 5 mmHg/s deflation rate. The recorded oscillometric waveforms were then regenerated by the CMS/ITRI simulator and led to the same automatic NIBP monitor to measure the blood pressure. The blood pressure values between the directly recorded and CMS/ITRI simulator regenerated pressures measured by Microlife BP 3BTO-A automatic NIBP monitors were discussed.
3.3. Clinical evaluation
The Omron HEM-907 automatic NIBP monitor had previously validated against auscultatory references were evaluated [9,10]. The deflation rate of Ormon HEM-907 is 5 mmHg/s. The CMS/ITRI simulator currently includes a database of 255 oscillometric waveforms from 115 subjects. Each oscillometric waveform was recorded at a cuff deflation rate of 2 to 3 mmHg/s from a Recording system (Fig.3), together with auscultatory blood pressures measured
simultaneously and independently by two observers. During data recording, the cuff size was chosen appropriate for the limb circumference. Both observer measurements had to agree within 4 mmHg for inclusion in the database. The averages of the two systolic and the averages of the two diastolic pressures were used as the auscultatory references associated with each oscillometric reading.
Figure 3. The recording system used to collect oscillometric waveforms from a subject
The published automatic NIBP monitor standards [11,12,13] require a wide range of subjects and specify minimum requirements for the number of subjects with particular ages, genders, arm circumferences and systolic and diastolic pressures.
4. Results
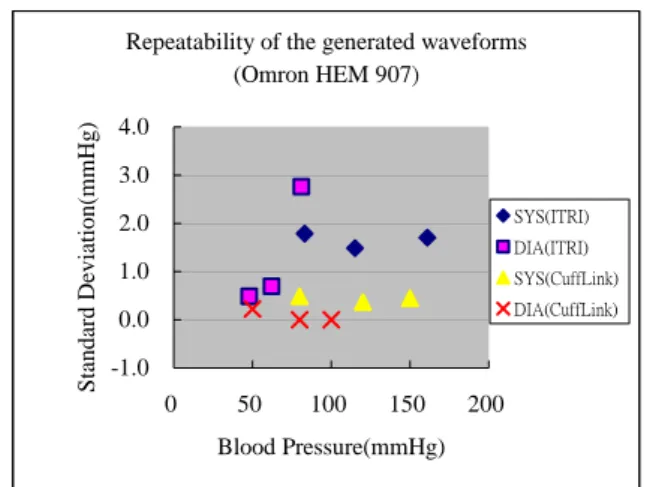
Figure 4 shows the repeatability of the generated oscillometric waveforms presented to the Ormon HEM-907 automatic NIBP monitor by both CMS/ITRI simulator and CuffLink simulator. The standard deviations of systolic blood pressures covering the range from 80 mmHg to 161 mmHg is below 2 mmHg. And the standard deviation of diastolic blood pressure covering the range from 48 mmHg to 100 mmHg is below 3 mmHg.
The differences between two systolic and two diastolic blood pressures through the directly recorded pressures and regenerated pressures were calculated in Table 1. The maximum difference is –4 mmHg in diastolic pressure measurement by using 122/78 mmHg oscillometric waveform.
Repeatability of the generated waveforms (Omron HEM 907) -1.0 0.0 1.0 2.0 3.0 4.0 0 50 100 150 200 Blood Pressure(mmHg) Standard Deviation(mmHg) SYS(ITRI) DIA(ITRI) SYS(CuffLink) DIA(CuffLink)
Figure 4. the repeatability of the generated oscillometric waveforms presented to the Omron HEM-907 automatic NIBP monitor by both CMS/ITRI simulator and CuffLink simulator.
Table 1 Differences between two systolic and two diastolic blood pressures through the directly recorded pressures and regenerated pressures
Numbers of waveforms Directly recorded pressures (mmHg) Regenerated pressures (mmHg) Difference Systolic pressure 122 123 1 Subject 1 Diastolic pressure 78 74 -4 Systolic pressure 97 98 1 Subject 2 Diastolic pressure 57 55 -2
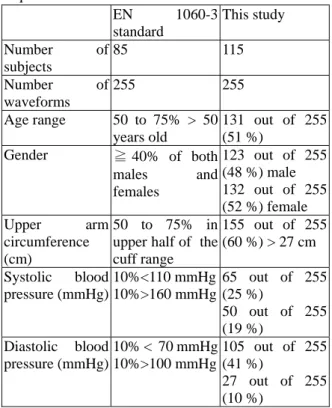
Table 2 summarises the statistics for the 115 subjects whose waveforms were recorded, and compares these with the requirements of EN1060-4 [11]. Systolic and diastolic pressures were recorded from Ormon HEM-907 automatic NIBP monitor for each of the 255 waveforms. The differences between the HEM-907 measured blood pressures (device pressure) and the mean blood pressures of two observers (Reference pressure) were calculated and plotted against the device pressure in Figure 5. The mean and standard deviation of the differences of 255 waveforms were also calculated and compared with the requirements of EN 1060, AAMI SP 10, which details in Table 3. The mean differences of systolic pressure and diastolic pressure are –0.5 mmHg and –4.0 mmHg respectively. Where the standard deviations are 5.3 mmHg and 4.4 mmHg respectively.
Table 2 Comparison of subject group and requirements of the EN 1060-4 standard
EN 1060-3 standard This study Number of subjects 85 115 Number of waveforms 255 255 Age range 50 to 75% > 50 years old 131 out of 255 (51 %) Gender ≧ 40% of both males and females 123 out of 255 (48 %) male 132 out of 255 (52 %) female Upper arm circumference (cm) 50 to 75% in upper half of the cuff range 155 out of 255 (60 %) > 27 cm Systolic blood pressure (mmHg) 10%<110 mmHg 10%>160 mmHg 65 out of 255 (25 %) 50 out of 255 (19 %) Diastolic blood pressure (mmHg) 10% < 70 mmHg 10%>100 mmHg 105 out of 255 (41 %) 27 out of 255 (10 %)
According to the above regulations, the mean difference must not large than ± 5 mmHg and standard deviation must not large than 8 mmHg.
Table 3 Means and standard deviations of the differences between the measured pressures and the reference pressure for Omron HEM-907. The published clinical studies of White et al. [9] and El Assaad et al. [10] results for the Omron 907 are given for comparison. Where SYS means systolic pressure and DIA means diastolic pressure.
Omron HEM-907
This study White et al El Assaad et al SYS DIA SYS DIA SYS DIA
Mean -0.5 -4.0 -1.56 -3.49 -1 -5 Standard deviation 5.3 4.4 4.42 4.61 7 6 Compliance with AAMI (12) and EN1060 (11)
Pass Pass Pass Pass Pass Pass
5. Discussion and Conclusions
The new simulator developed by CMS/ITRI had proved to regenerate real human blood pressure waveforms repeatably and accurately. Although the repeatability of systolic pressure and diastolic pressure tested from ITRI simulator is good (smaller than
Figures 5. The differences between the blood pressures measured by Omron HEM-907 automatic NIBP monitor (Device pressure)and the mean blood pressures of two observers (Reference pressure) from 255 waveforms
-25
-20
-15
-10
-5
0
5
10
15
20
25
40
60
80
100 120 140 160 180 200 220
Reference pressure (mmHg)Device pressure - Reference pressure
(mmHg)
Systolic Diatolic Ormon HEM-907
3 mmHg) in Fig 4., the repeatability tested from commercial available CuffLink simulator is more good (smaller than 1 mmHg). We assumed that the main reason is waveform generated by step motor design in CuffLink simulator is different from that generated by metal-rubber diaphragm in ITRI simulator. A better signal control and servo pulse generator with metal-rubber diaphragm of ITRI simulator can generate more realistic bio-signal have proved in Table 1., but CuffLink simulator can not [6]. ITRI simulator has another strong function that it can test overall system accuracy of automatic NIBP monitors that all commercial simulators could not. Table 3 proved that ITRI simulator successfully passed the clinical evaluation by comparison with clinical validated Omron HEM-907 device according to the EN1060 and AMMI SP10 regulation. Amoore[14] used the same method to evaluate PTB simulator (same design as ITRI simulator) through 243 waveforms collected in clinical. But fail to pass in the mean difference of diastolic pressure and the difference value is –8.9 mmHg. We think that Amoore’s study is not totally meet the EN1060-4 regulation and only 7% diastolic pressure waveforms are larger than 100 mmHg (it need 10% at least in EN 1060).
Further study should collect more clinical data including very high and very low blood pressures (according to BHS protocol), diabetics and other special patients in order to understand if the validated automatic NIBP monitors can measure the certain blood pressure group accurately. We believe that ITRI simulator can improve the quality of automatic NIBP monitors and can substitute part of clinical trial of the devices in development.
References
1. Ramsey M III. Noninvasive automatic determination of mean arterial blood pressure. Medical and Biological Engineering & Computing, Vol.17, 11-18, 1979.
2. Geddes LA, Voelz M, Combs C, Reiner D, Babbs CF. Characterisation of the oscillometric method for measuring indirect blood pressure. Annal Biomed Eng, Vol.10, 271-280,1982.
3. Ng K-G, Small CF. Survey of automated non-invasive blood pressure monitors, Journal of Clinical Engineering, Vol. 19, 452-475,1994. 4. Amoore JN, Assessment of oscillometric
non-invasive blood pressure monitors using the Dynatech Nevada CuffLink analyzer. Journal of Medical Engineering & Technology, Vol. 17, No. 1, 25-31, January/February 1993.
5. Amoore JN, An Evaluation of Three Oscillometric Non-Invasive Blood Pressure Simulators, Journal of Clinical Engineering, Vol. 22, No.2, 93-100,1997.
6. Mieke S. Substitution of simulators for human subjects. Blood Pressure Monitoring, Vol.2, 251-256,1997.
7. SIMS A.J., REAY C.A., BOUSFIELD D.R., MENES J.A. and MURRY A., Oscillometric blood pressure devices and simulators: measurements of repeatability and differences between models, Journal of Medical Engineering & Technology, Vol. 29, No.3, 112-118, May/June 2005.
8. Groβ H, Mieke S, Ulbrich M, An arm phantom: a digital simulation system for testing sphygmomanometers, Journal of Medical Engineering & Technology, Vol. 20, No.2, 75-83, March/April, 1996.
9. White WB, Anwar YA. Evaluation of the overall efficacy of the Omron office digital blood pressure HEM-907 monitor in adults. Blood Pressure Monitoring, 6:107-110, 2001.
10. El Assaad MA, Topouchian JA, Darné BM, Asmar RG. Validation of the Omron HEM-907 device for blood pressure measurement. Blood Pressure Monitoring, 7:237-241, 2002.
11. EN 1060 Non-invasive sphygmomanometers: EN 1060-3 Part 3: Supplementary Requirements for electro-mechanical blood pressure measuring systems. EN 1060-4 Part 4: Test procedures to determine the overall system accuracy of automated non-invasive sphygmomanometers, 2004.
12. ANSI/AAMI SP10, Manual, electronic,or automated sphygmomanometers, 2002.
13. The British Hypertension Society protocol for the evaluation of blood measuring devices, Journal of Hypertension, Vol.11 (Suppl 2): S 43 – 62, 1993. 14. AmoorePPJN, Emilie Vacher at el: Can a simulator
that regenerates physiological waveforms evaluate oscillometric non-invasive blood pressure devices? Blood Pressure Monitoring 11(2), 63-67, April 2006, 2005.