Exchange Rates Forecasting Using
a Hybrid
Fuzzy and
Neural Network
Model
An-Pin
Chen'
and Hsio-YiLin21)Institute ofInformationManagement,National Chiao-TungUniversity, HsinChu, Taiwan300
2)Deartmectt
nc
oF u ty2)DepartmentofFinance,
Ching-Yun University, Jung-Li,
Taiwan 320Abstract-Artificialneural networks(ANNs)arepromising approaches forfinancial time series predictionand have been widely appliedtohandlefinance problemsbecauseof its nonlinear structures.However,ANNshave somelimitationsinevaluatingthe outputnodes as a resultofsingle-pointvalues.This study proposed ahybrid model,calledFuzzy BPN,consisting of backpropagation neural network(BPN)andfuzzy membership function for taking advantage of nonlinear featuresandintervalvaluesinstead ofthe shortcoming of single-point estimation. Inaddition,the experimental processingcandemonstrate thefeasibility of applyingthehybrid model-FuzzyBPN and theempiricalresults show thatFuzzyBPNprovidesauseful alternativetoexchange rateforecasting.
Keywords- backpropagationneuralnetwork, FuzzyMembership Function,Exchange rate.
I. INTRODUCTION
Recentlyinternational investment activitiesare morefrequent andglobal trades becomemoreliberal, floating exchangerate system causeuncertainty of exchangerateintheinternational trade and investment.Thus, exchangeratesforecasting, using linear time seriesmodels, non-linear time series models, and artificialintelligence models, becomes animportantfinancial problem and has beena recurrentsubject of research during the lasttwodecades.
Meese and
Rogof[115]
demonstrated the forecasts ofexchange rate predictability from structural model based on
monetary and asset pricing theories of exchange rate
determination performnobetter than theonesgenerated by the
simplest of all models in terms of out-of sample forecasting
ability. Further, many literatures[1,3,17,21] also pointed out
the standard econometric methods are unable to produce
significantly better forecasts than the random walk model and supportive of theefficient-markethypothesis.
Although these findings are strength advocated that the
exchange rates trend is random walk, many researchers have
attemptedtosearch various alternative methods formodeling of exchangerates forecasting. Oneof thefirst studiestooverthrow
the random walk model is the proposal made by MacDonald
and Taylor[14]. Many literatures haveproposed several proofs
explaining thatExchange rates belongtononlinear behavior. In addition, Kilian and Taylor[12] also signified that the forecast
efficiency of econometric exchange models is not able to
achieve its optimum because it is constrained by the linear
quality of the traditional statistics models. Afterwards, the
exchange rates time-series property has beenproven to existin
the family of Autoregressive conditional
heteroskedasticity(ARCH) effect.
In the past ten years, following the rapid advancement of
technology and the vast application of artificial intelligence,
researchers have become more tend to use artificial neural
network(ANN) as an alternative method in exchange rates
forecasting andBackpropagation neural networks(BPNs) isone
of the most popular ANN used. Lisi and Schiavo[13] used
BPNs, chaotic modelswereseparately appliedontheexchange
rate prediction and the results from both were better than the
random walk hypothesis. Funahashi[8] and Hornik et al.[10]
believed thatANNis moresuitable for time seriesprediction. Inaddition, mostof the studies done recently hybridize several
artificial intelligence techniques, for instance [9, 20], or
integrate ANN statistics methods, for example, Chen and
Leung[5] used the GeneralRegression Neural Network(GRNN)
to predict foreign exchange rates and through actual proofs
discovered that GRNN approach not only results better
exchange rate forecasts but also products in higher investment returnsthan thesingle-stage model.
However,thepredictiveoutputsofANN aregenerally
single-pointvalues. It seemsunreasonable that"single-point
values"outperformaninterval forforecasting certain financial predicting
problems,
thatis,
stockprices indexes,returns,
andexchangerates. Asingle-pointvalue indeed hasmore
difficulty thananinterval valueinforforecastingatargetvalue. Inordertotakeadvantage ofBPNsnon-linear feature and
improve the single-point values problemsin BPNs,thispaper attempts to propose a BPNsusingafuzzysetarchitecture, and modified neuralnetwork is designedtocombine the non-linear learning characteristic ofBPNsand the interval estimation of statistics, thuscanbeadynamical model forrecognize the financial time seriespatternsand for forecast theexchangerate trend.
The remainder of thispaperconsists of five sections.
Section2 introduces the basicconceptofBPNandGARCH
models. Section3 then describesafuzzysetintervalapproach basedontheBPNmodel forforecastingexchangerates
movement inthis part, a casestudy of theUS New Taiwan
Dollarexchangeratesis alsodesignedtoexamine the influence of thepredictive performance of the modifiedBPNs(short-call
Fuzzy BPNsbelow) suggested by thisstudy, andacomparison
is drawn between the traditionalBPNmodel,Fuzzy BPNsand
AR-GARCHmodel. Subsequently, theempirical results are
presented and discussedinsection4. Finally, the concluding remarksarepresentedin section5.
II.ARTIFICIAL NEURAL NETWORK AND GARCH
MODEL
A.
Artificial
Neural Network ModelTheANNusedinthispaperisBPN,whichuses
Backpropagation trainedby gradient descentalgorithm. This algorithmsupposesthat the jthneuronof the hiddenlayer
receives that activation function:
H Z xiwh (1)
Where xi is thesignaltotheinputneuron iand
wh
is theweight of the connection between the i th inputneuronand
the he jthneuronof the hiddenlayer.,then this activation functionproducesasoutputbyatransfer function
f
of the hiddenlayerhj
=fr
(Hi)=
f
(2)Then eachoutput neuron
k
receivesasinput from theoutputof theprevious layer(hidden layer)andproducesthe final result
°k Z wojk X hj (3)
where
wo
jk is theweightof the connection between hiddenneuron
j
andoutput neuronk,
and it istransformedagaintoT kernk
(ok
) k (4)The
goal
ofthelearning
processistodetermineasetofweights when the actualoutput Yk by the networkgiven
xi
asinput beascloseaspossibletothe desiredoutput ok' the function ofsquarederrorsfor eachneuron,which istobe minimized,
E = ZE (Yk -
°k)'
2k
(5)
The data fed to aninput nodearemultiplied bya setof weights; all suchweighted inputsaretotaledusinganactivation function thatdependsonthelearning algorithmateach node of thenextlayer. Theoutputof the activation function then transforms therawinput foranodeinthenextlayer, this processis called "feed-forward"
Inaddition, theweightsaremodifiedtoreduce thesquared error. Thechangeinweights,
(6)
Awkj
71-Where 7 is thelearningrate,0< 7 <1, Rumelhartet
al.(1986)[16]
introduceda momentum term a in(6), thus obtaining thefollowing learning rule,Aw.
(t+ 1) = -7aWkj + aAw.(t)
(7)
Themomentum a isusuallysetinthe interval[0,1] and itcan also behelpfultokeep the learningprocessfrom fell into the local minima.
Thatis,inthe finallayer, the predictive values of the outputnodesmaydiffer from thetargetvaluesowingtothe
weights beingrandomly initialed. Theerrorbetween the
predictive and thetargetvaluescanbeadjusted by adjusting the weights oflearning epochs, usingadelta rule derived froma
costfunction of theerror.Thisprocessistermed "backward".
B. GARCHModel
TheGARCHmodel ofEngle[7] andBollerslev[2] requires
joint estimation of thecurrentconditionalmeanmodelas
formula(8) and thepastconditional variance(9)inorderto
capturethenon-linearityinvolved the distribution of financial data isleptokurtic. TheGARCH(p,q)modelcanberepresented
by the following model:
(8)
m n
Et = aO + E aEi + E b et-j
i=l j=l
where Et is series of continuousexchange rate(normalized),
the
ao,
aiandbj
aretheconstantparameters,Et N
(0,
h) and the conditional variance oferrors,ht
is given by:p q
ht = Zto+ a
±2
+ E6jhtj (i=l j=l
Where ao
>O,ai/j
>.0 and Ziai +,j,ij
<1These restrictionsontheparameter preventnegative variances
and theGARCH(1,1)wasfoundtobe themostpopular.
III. THE HYBRIDMETHODOLOGY AND RESEARCH
DESIGN
A. Fuzzy BPNs
Thispaper proposesfuzzy-interval architecture using fuzzy setforimproving the single-point shortcoming of BPNs, call
Fuzzy BPNbelow. Further, afuzzysetis completely
characterizedby it membership function (MF), theMFof fuzzy-interval approach is defined in thispaperis the Gaussian
MFand specified bytwo parameters {c, G}:
1 (x-C)2 f(X;c,c7)= e 2 o7
C,.2T(
(10) where cis the Gaussian MFscenterand Gydetermines the MFs width.Inthispaper,the cindicatesthemeanofweekly
exchangeratesand the Gyintentsthe standard deviation of weekly exchangerates,the MFoffuzzy-interval is also decided completely by candc. Note that GaussianMFisadirect
generalization of the normal distributionuseinprobability
theory, when fuzzy-intervalMFis centeredon c and the
extent towhich itspreadsoutaround c is added and
subtracted1.96Gy(+1.96u) of 95% probability of confidence
interval(see Fig. 1).
Fig.1Gaussian MF offuzzy-interval approachinthispaper
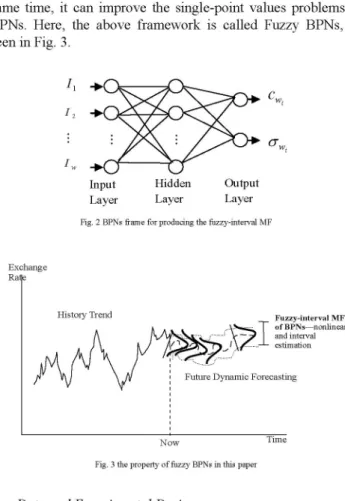
According to the assumption of the MF above mentioned,
this research tries tolearn the parameter c and Gy using BPN. Fig. 2 is shown the BPNs frame for producing the fuzzy-interval
MF, then used c and Gy to find the fuzzy-interval MF, in this
way,notonlycanit maintain theBPNs non-linearfeature,atthe
same time, it can improve the single-point values problems in
BPNs. Here, the above framework is called Fuzzy BPNs, as
seeninFig. 3.
I2
cWi
Input Hidden Output Layer Layer Layer
Fig. 2 BPNsframe for producing the fuzzy-intervalMF
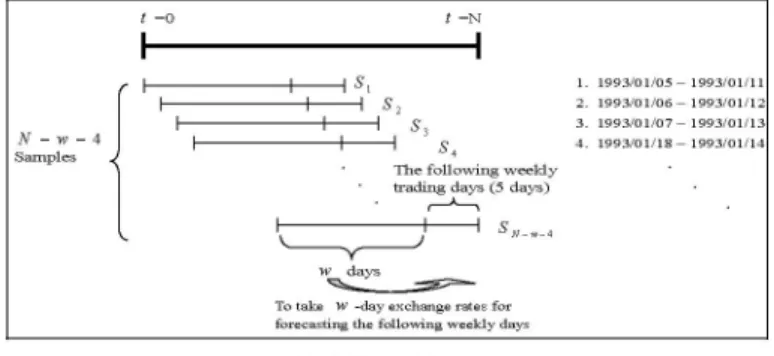
Exchange Ra4e
HistoryTrend Fuzzy-intervalMF
ofBPNs-nonlinear
A.... andinterval
..1 estimation FutureDynamic Forecasting
Now Time
Fig.3thepropertyof fuzzyBPNsinthispaper
B. Data and Experimental Design
The data sets werebilateral exchange rates between New
Taiwan Dollar and US dollar (NTD/USD), and composed of
daily rates covering almost 14-year period from the beginning
of Central Bank of China, Republic of China (Taiwan), on
January 3, 1993 to October 14, 2006 and including 3425
observations.
This study attempts to take w days for predict the
following weekly (5 trading days) exchange rate. To put it
plainly, when we want to forecast the next unknown weekly
exchange rate, we can use the past w days ahead the future
next weekly days to training model for get predicted values.
Consequently, a "sliding window" was proposed as shown in
Fig. 4 with different window width w + 5 moving from the
first period to the last period of the entire data set labeled by
S (i is from oneto N-w-4) resultingin all N (N =3425)
observations being divided again into N- w-4 samples.
Consulting Chen and Tsao[4] and Tay and Cao[19], there are
five different w, their being5,10,15,20 and 25, considered in this paper. Many investigations have used a convenient ratio to separate in-samples form out-of samples ranging from
C
-1.96 cy +1.96cy
70%:30% to 90%:10%[22]. Hence, about approximately 25% of the samplesareused fortest, 75%for traininginthispaperand every sample comprises a time series data containing
w + 5 exchange-rateobservations. tO tN
l
I
Sl 1. 1993/01/05 1993/01/11 5 s 2. 1993/01/06 1993/01/12 l I| S 3. 1993/01/07 1993/01/13 N-W s 4 1993/01/18 1993/01/14 Samples i4n ~~~~~~~Thefollowing weekly
*tradinlg days (5 days)
<
~
ISN--W days
Totake W-day exchangeratesfor
forecastingthefollowing weekly days
Fig. 4.Slidingwindow
Foreffective predictive performance ofBPNandGARCH
processing, thispapertakes the natural logarithmic
transformationtostabilize the time series ofexchangeratevia normalization. The normalizations oftwo outputvariables of theexchangerates inthispaperseparatelyare
mean Si(=
K.)
-11
SD
jt (ln(pI|
- mean s)
where Pw denotes the normalized basic day of the following
weekly exchangerates for theprevious w days, while
means
andSDS
representsthemeanand standard deviation for thefollowing week exchangeratesduring periodSi
.IV. EMPIRICAL RESULTS
This sectioninterprets andpresentsthe bestspecificationsof
Fuzzy BPNs,traditionalBPNsandGARCHmodel fordaily
NTD/USDexchange-rate series.
A. BPNsModel
TheBPNsmodel usedinthis study isathree-layer feed forwardnetwork, and is trainedtomapthenextweekly-day
meanand standard deviation for thecoming w days usinga
backpropagation algorithm. This study varies the number of nodesinthe hiddenlayer and stopping criteria for training, TABLE Iis theparameterssetting list and Matlab7.0program languagewas runfor theexperiments ofBPNsinthisstudy.
TABLE I BPNs parameters setting inthis study
parameters settingvalue Hidden layer I layer and 2 layers
Ilayer 5, 15, 30, 50, 100
Hidden nodes 2 layers :5, 15, 30
Learningepochs 10000
Learningrate 010.3,05,07 10
Momentum tenn DefaultedbyMatlabprogramlanguage Total number of 350 1layer 5 x5x 5 (w) 125
trial-and-error 2 layers 3x3 x5x 5 (w) 225
Severalperformance criteria are used to model BPNs, this
study includingthe Meansquarederror(MSE) suggested by
Coakley et al.[6]to determine the point at which the training stopsandassesstheforecasting performance.
n,
Z
(F
i)2
MSE = i
nw-1
where
nw
is the number of theexamplesequences,(13)
n =
N-
w-4,
0 is thetargetvalue,
F is thepredicted
value,the final determined parameters of each w-daysBPNs arebasedonthe smallestconvergedMSEtheir ownrespectively. 1) Since themajorpurposeof thispaperistoinvestigate the effects
ofBPNsparameters onthemodeling and forecasting
performance ofBPNs,the values ofMSEbetweentrainingset
(in-sample) and testingset(out-of-sample) will be compared,
2) with theemphasisput ontheout-of-sample analysis, because it
is only using the testing data that theBPN parameter setting with the bestforecasting capabilitycanbeprovenand found.
Alltheset parametersafter passing through Trail andError, then basedonthe smallestMSEvalue of the5differentw,the MSEvalue is chosenasitsfirstmeasurementstandard,ifthe training dataMSEvalue is thesamethen thetraining data becomes the secondscreening standard,TABLEIIis the best parametersetting model (the best performance) chosenand arrangedasfollows.
TABLE II BPNsbestparameter settingmodel
trainingdata testingdata
W Hidden learningrate
MSE MSE 5 0.000010357 0.000010723 30 0.5 10 0.000009428 0.000009566 15X15 0.3 1 5 0.000005957 0.000008403 30X30 0.7 20 0.000007632 0.000012630 1 5 1.0 25 0.000008058 0.000010245 5X15 0.5 B. GARCHModel
Variousgoodness-of-fitstatisticsareusedtocomparethe all estimatedGARCHmodelinthispaper,thediagnosticsare the MSE, the likelihood-ratiotests, testsfor the standard
residuals, Schwarz's Bayesianinformationcriterion (SBC) by Schwarz(1978)[18] and Akaike's information criterion
(AIC)[11].The GARCH models were tried for p=1,2, *
,5
and q =1,2,. .,5 usingSAS programsoftware,TABLE III
shows that thestatistically significantparameters for every AR( w)-GARCH(p,q) model and the last resultswaslisted,the
estimated values of parameters
a0o,
l and y allsatisfyao > 0, al >0, ,8> 0 and
a+,8/<1.
This indicates the weaknesses of imposing the parameter estimates of a GARCH model to certain constraints such as stationary.TABLE III Estimationresults of GARCH models for NTD/USD exchangerates
t -value Model
a0(xlO6)
t-value 1 t-valuet1
/ 3 4 p p-v3
4 AR(5)GARCH(1,4) 4.5487 17.5 0.001401 0.03 0.0421 0.0276 0.0231 0.0281 - 27.95 7.07 4.24 6.72AR(lO)GARCH(1,4) 4.5564 17.21 0.001382 0.03 0.0421 0.0275 0.0229 0.0278 - 27.13 6.69 3.98 5.67
AR(15)GARCH(1,5) 4.5185 13.35 0.001567 0.02 0.0423 0.0256 0.0183 0.0171 0.0228 25.64 5.23 2.83 2.95 5.39
AR(20)GARCH(1,5) 5.9404 9.55 0.0172 0.17 0.0399 0.0256 0.0186 0.0182 0.0212 20.59 3.73 2.3 2.23 3.44
AR(25)GARCH(1,3) 0.67168 13.51 0.4395 14.28 0.1156 0.0804 0.0907 - - 24.38 4.67 3.86
TABLEIVindicates allfinal AR( w)-GARCH(p,q) models
that their own MSEvalues,Log Lvalues,the lowest AIC and
SBC,dividedly. Inthenextsection, theFuzzy BPNsand
traditionalBPNsmodels will becompared the forecasting
performance with finalAR-GARCHmodels.
TABLE IV Thegoodness-of-fitstatisticsvalues of allfinal AR(W)-GARCH(p,q)models
Model Goodness-of-Fit Statistics
MSE LogL SBC AIC
AR(5)-GARCH(1,4) 0.0000204 11061.0956 -22028.009 -22098.191 AR(10)-GARCH(1,4) 0.0000204 11045.7559 -22057.512 -21958.113 AR(15)-GARCH(1,5) 0.0000203 11044.3184 -22042.637 -21908.183 AR(20)-GARCH(1,5) o0ooi099 11031.2324 -22006.465 -21842.826 AR(25)-GARCH(1,3) 00000198 11739.1774 -23416.355 -23235.244 C. ForecastingPerformance
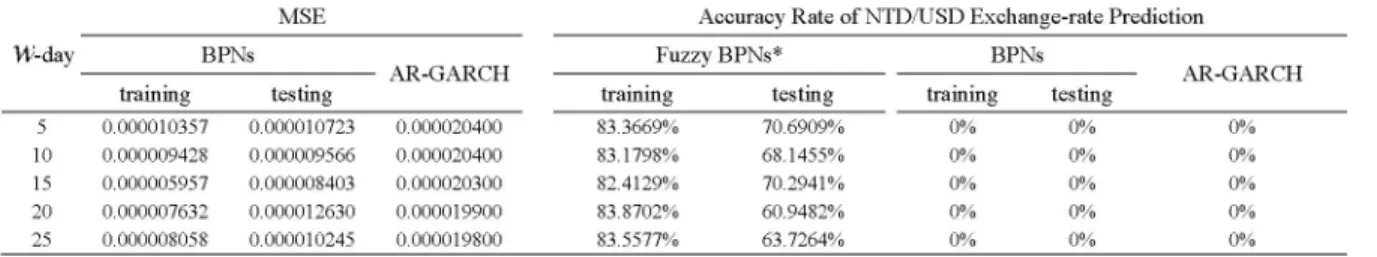
Fuzzy BPNs, traditional BPNs, and AR-GARCH models all
used similar measurement standard- MSE values as its
MSE
W-day BPNs
measurementstandard. It canbe known fromTABLEVthat the
MSEvalue of different W BPNsmodels areall lower than
those with AR-GARCH models, which shows that the
forecasting ability of the BPNs models are better than the
AR-GARCH models; in addition, from the point of view of
forecasting accuracy rate as the judgment standard, the
exchange rates oftraining data of the Fuzzy BPNsare between
the fuzzy-intervalMF's forecastingareas, which are 83.3669%,
83.1798%, 82.4129%, 83.8702%, and 83.5577% respectively,
while the accuracy rateof the exchangerates of training data
to be guessed correctly are 70.6909%, 68.1455%, 70.2941%,
60.9482%, 63.7264%, while theaccuracy rate of the traditional
BPN models and the AR-GARCH models is 0%. It can be
known than that aside from the Fuzzy BPNs having a better
forecasting ability than the AR-GARCH models, the study
made use of the sector characteristic offuzzy MF to improve
the single point forecasting shortcoming of the traditionalBPN models.
TABLE V Theperformancecomparisonof FuzzyBPNs,traditionalBPNsand AR-GARCH models
Accuracy Rate ofNTD/USD Exchange-ratePrediction
IXKAD 1XAD
IFuzzy
BPNs* BPNstraining testing training testing
5 0.000010357 0.000010723 0.000020400 83.3669% 70.6909%
10 0.000009428 0.000009566 0.000020400 83.1798% 68.1455%
15 0.000005957 0.000008403 0.000020300 82.4129% 70.2941%
20 0.000007632 0.000012630 0.000019900 83.8702% 60.9482%
25 0.000008058 0.000010245 0.000019800 83.5577% 63.7264%
*Assumption of 95%probabilityinGaussiandistribution,theFuzzy-intervalMFswereextended basedonc±1.966yw
training 0% 0% 0% 0% 0% testing 0% 0% 0% 0% 0% 0% 0% 0% 0% 00 31--ADIIIJ
V. CONCLUSIONS
The applications ofANNs in financial areahave obtained
increasing popularity in the past decades. Nevertheless, a
strictmethodologyonhowtoproperly designasystemofANNs
for forecasting time series data is still a difficult problem; the
disadvantages of ANNs also have be widely discussed and
solved, suchas"blackbox", single-point prediction, etc. Inthis
study, amethod called Fuzzy BPNs consisted offuzzy-interval
MF was suggested for the purpose of improving upon the
shortcomings of single-point estimations in conventional
artificial neural networks, and still has possession ofANNs
nonlinear capabilities. This paper also provides evidence for
the forecast performance ofFuzzy BPNs in terms of interval
evaluation is not only much better than traditional BPNs in
terms of single-point evaluation, but more well than
AR-GARCH models. To conclude, this contribution presents
that a combination ofBPNs with Fuzzy membership function
proposed by this research offers auseful approach for predicting time seriespatterns inexchange market data.
VI.REFERENCES
[1] D.Alexander,L.R.Thomas,"Monetary/asset Models ofExchangeRate Determination: How Well HaveTheyPerformedinthe 1980's?" International JournalofForecasting,vol. 3, pp53-64, 1987.
[2] T.Bollerslev,"GeneralisedAutoregressive ConditionalHeteroskedasticity,"
JournalofEconometrics, vol. 31,pp3O7-327,1986.
[3] G.Canarella,S. K.Pollard, "EfficiencyinForeignExchangeMarkets:a
VectorAutoregressionApproach,"JournalofInternational Money and Finance,vol. 7, pp33 1-346, 1987.
[4]S.-H.Chen,C. YTsao, "Information Content of the Trajectory-Domain
Models,"9hinternationalConferenceonComputinginEconomicsand Finance,Seattle, USA,July2003.
[5] A.-S.Chen,M. T.Leung,"Regression Neural Network for Error Correction
inForeignExchangeForecastingandTrading,"Computers and Operations Research, vol. 31,ppl049-1068,2004.
[6]J.R.,Coakley,D. D.Mcfarlane,WG.Perley,Alternativecriteriafor
evaluatingartificial neural networkperformance, presentedatTIMS/ORSA JointNationalMeeting,April1992.
[7] R. F.Engle,"Autoregressive ConditionalHeteroskedasticity withEstimates of the Variance of U.K.Inflation,"Econometrica,vol.50, pp267-287,
1992.
[8]K.Funahashi,"OntheApproximateRealization of ContinuousMappings
byNeuralNetworks,"NeuralNetworks,vol.2,ppl 83-192,1989. [9] K. Huarng, T. H.-K. Yu, "TheApplicationofNeural NetworkstoForecast
Fuzzy TimeSeries," PhysicaA,vol.363, pp481-491,2006.
[10]K.Hornik,M.Stinchcombe,H.White, "MultilayerFeedforward Networks AreUniversalApproximateors,"NeuralNetworks,vol.2, pp359-366,1989.
[11] G. G. Judge, W E. Griffiths, R. C. Hill, H. Lutkepohl, T. C. Lee, :The Theory and Practice of Econometrics,"2nd ed., New York:Wiley, 1985. [12] L.Kilian, M. P. Taylor, "Why Is It So Difficult to Beat theRandom Walk
Forecastof Exchange Rates?" in: European Central Bank Working Paper
Series,WP No.88,November 2001.
[13] F. Lisi, R. A. Schiavo, "A Comparison between Neural Networks and Chaotic Models forExchange Rate Prediction," Computational Statistics and DataAnalysis, vol. 30, pp87-102, 1999.
[14] R. MacDonald, M. P. Taylor, "The Monetary Model ofthe Exchange Rate: Long-runRelationships, Short-run Dynamics and How to Beat aRandom Walk," Journal ofInternational Money and Finance, vol. 13, pp276-290, 1994.
[15] R. A. Meese, K. Rogoff, "Empirical Exchange Rate Models ofthe Seventies: DoThey Fit Out of Sample?" Journal ofInternational Economics,vol. 14, pp3-24, 1983.
[16] D. E. Rumelhart, G. E. Hinton, R. J. Williams, "Learning Internal Representationsby Error Propagation." in: D. E. Rumelhart,J. L. McClelland, (Eds.), Parallel DistributedProcessing,vol. 1,MIT press,
Cambridge,MA, pp 318-362, 1986.
[17]N.Sarantis, C. Stewart,"Structural, VAR and BVAR Models ofExchange RateDeterminate:AComparisonof Their ForecastingPerformance,"
JournalofForecasting, vol. 14, pp201-215, 1995.
[18] G. Schwarz, "Estimating the Dimension of a Model", Annals of Statistics, vol.6,pp461-464,1978.
[19] F. E. H. Tay, L. J. Cao, "Modified Support Vector machinesinFinancial Time Series Forecasting," Neurocomputing,vol. 48, pp.847-861, 2002. [20] M. Versace, R.Bhatt,0.Hinds,MShiffer, "Predicting theExchange
Traded Fund DIA with a Combination of GeneticAlgorithms and Neural
Networks,"Expert systems withApplications, vol. 27, pp417-425,2004. [21] C. C. P.Wolff, "Time Varying Parameters and theOut-of-sample
ForecastingPerformance of StructuralExchange RateModels,"Journalof Business Economicsand Statistics,vol. 5, pp87-103, 1987.
[22] G. P.Zhang, "Business Forecasting with Artificial Neural Networks: An overview", in: G.PZhang(Ed.),Neural NetworksinBusinessForecasting, Idea GroupPublishing, Hershey, PA, 2004.